Rejoignez notre page de fans
- Vues:
- 4818
- Note:
- Publié:
- 2018.06.25 13:03
- Mise à jour:
- 2018.06.25 13:05
-
 Vous manquez des opportunités de trading :
- Applications de trading gratuites
- Plus de 8 000 signaux à copier
- Actualités économiques pour explorer les marchés financiers
Inscription Se connecterVous acceptez la politique du site Web et les conditions d'utilisation
Si vous n'avez pas de compte, veuillez vous inscrire -
 Besoin d'un robot ou d'un indicateur basé sur ce code ? Commandez-le sur Freelance
Aller sur Freelance
Besoin d'un robot ou d'un indicateur basé sur ce code ? Commandez-le sur Freelance
Aller sur Freelance
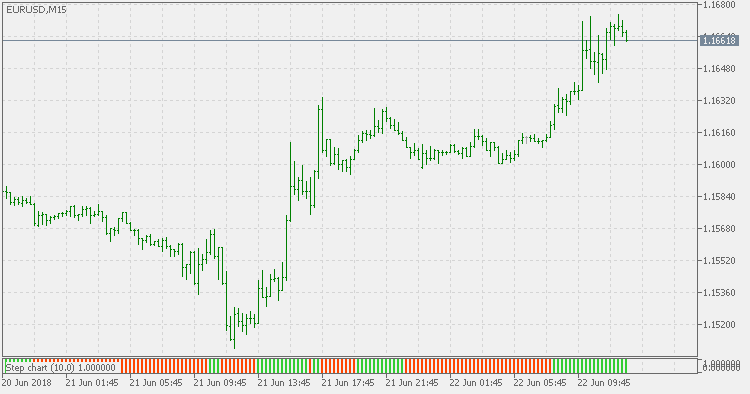
Step Chart Histogram indicator monitors the price change (in pips) and according to that, determines if a new "step" has been made or not.
Compared to the Step Chart indicator, this version displays the values in a separate window as a histogram (as a sort of a help to see the trend changes in an easier way).
 Step Chart
Step Chart indicator monitors the price change (in pips) and according to that, determines if a new "step" has been made or not.
Volatility Pivot
Volatility Pivot indicator calculates "pivots" (support/resistance lines) based on current symbol/timeframe Average True Range calculated volatility.
Step Chart Separate
Compared to the Step Chart indicator, this version displays the values in a separate window (as a sort of a help to see the trend changes in an easier way).
CCI Squeeze
Combination of two very well known indicators (CCI and Moving Average) that estimates the direction strength of the current market trend.