Join our fan page
- Views:
- 5467
- Rating:
- Published:
- 2018.06.25 13:03
- Updated:
- 2018.06.25 13:05
-
 You are missing trading opportunities:
- Free trading apps
- Over 8,000 signals for copying
- Economic news for exploring financial markets
Registration Log inYou agree to website policy and terms of use
If you do not have an account, please register -
 Need a robot or indicator based on this code? Order it on Freelance
Go to Freelance
Need a robot or indicator based on this code? Order it on Freelance
Go to Freelance
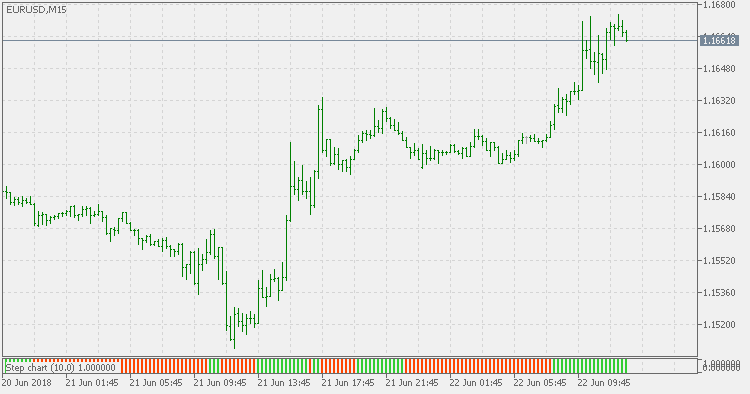
Step Chart Histogram indicator monitors the price change (in pips) and according to that, determines if a new "step" has been made or not.
Compared to the Step Chart indicator, this version displays the values in a separate window as a histogram (as a sort of a help to see the trend changes in an easier way).
 Step Chart
Step Chart indicator monitors the price change (in pips) and according to that, determines if a new "step" has been made or not.
Volatility Pivot
Volatility Pivot indicator calculates "pivots" (support/resistance lines) based on current symbol/timeframe Average True Range calculated volatility.
Step Chart Separate
Compared to the Step Chart indicator, this version displays the values in a separate window (as a sort of a help to see the trend changes in an easier way).
CCI Squeeze
Combination of two very well known indicators (CCI and Moving Average) that estimates the direction strength of the current market trend.