Rejoignez notre page de fans
- Vues:
- 15565
- Note:
- Publié:
- 2018.02.12 16:58
-
 Vous manquez des opportunités de trading :
- Applications de trading gratuites
- Plus de 8 000 signaux à copier
- Actualités économiques pour explorer les marchés financiers
Inscription Se connecterVous acceptez la politique du site Web et les conditions d'utilisation
Si vous n'avez pas de compte, veuillez vous inscrire -
 Besoin d'un robot ou d'un indicateur basé sur ce code ? Commandez-le sur Freelance
Aller sur Freelance
Besoin d'un robot ou d'un indicateur basé sur ce code ? Commandez-le sur Freelance
Aller sur Freelance
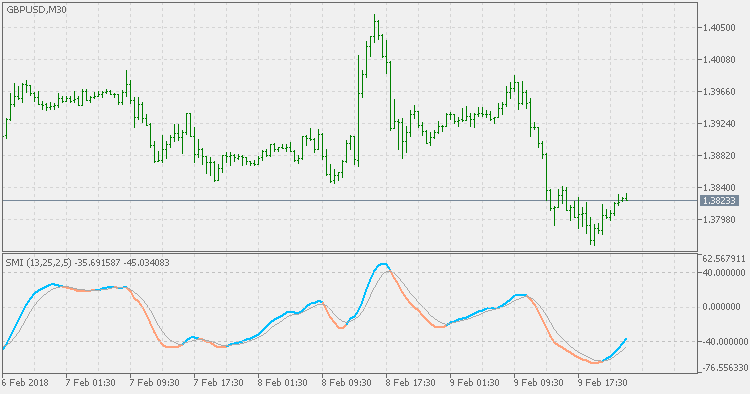
The Stochastic Momentum Index (SMI) was developed by William Blau and was introduced in the January 1993 issue of Technical Analysis of Stocks & Commodities magazine.
It incorporates an interesting twist on the popular Stochastic Oscillator. While the Stochastic Oscillator provides you with a value showing the distance the current close is relative to the recent x-period high/low range, the SMI shows you where the close is relative to the midpoint of the recent x-period high/low range.
The result is an oscillator that ranges between +/- 100 and is a bit less erratic than an equal period Stochastic Oscillator.
- When the close is greater than the midpoint of the range, the SMI is positive.
- When the close is less than the midpoint of the range, it is negative.
The interpretation of the SMI is virtually identical to the Stochastic Oscillator.
Three popular methods include:
-
Buy when the SMI falls below a specific level (e.g., -40) and then rises above that level, and sell when the Oscillator rises above a specific level (e.g., +40) and then falls below that level.
However, before basing any trade off of strict overbought/oversold levels it is recommended that you first qualify the trendiness of the market using indicators such as r-squared or Chande Momentum Oscillator. If these indicators suggest a non-trending market, then trades based on strict overbought/oversold levels should produce the best results. If a trending market is suggested, then you can use the oscillator to enter trades in the direction of the trend.
-
Buy when the SMI rises above its signal line (dotted) line and sell when the SMI falls below the signal line.
-
Look for divergences. For example, where prices are making a series of new highs and the SMI is failing to surpass its previous highs.
Mr. Blau also notes that a 1-day SMI (with large smoothing periods such as 100) is very sensitive to the close relative to the high and low of the day.
 Directional Efficiency Ratio
The Efficiency Ratio (ER) was first presented by Perry Kaufman in his 1995 book "Smarter Trading". It is calculated by dividing the price change over a period by the absolute sum of the price movements that occurred to achieve that change. The resulting ratio ranges between 0 and 1 with higher values representing a more efficient or trending market.
TTM trend
The TTM (Trade The Markets) Trend is basically an easier way to look at candlesticks. It is the The Heikin-Ashi method. Literally translated Heikin is "average" or "balance,", while Ashi means "foot" or "bar." The TTM trend is a visual technique that eliminates the irregularities from a normal candlestick chart and offers a better picture of trends and consolidations.
T3 Stochastic Momentum Index
This version is doing the calculation in the same way as the original Stochastic Momentum Index, except in one very important part: instead of using EMA (Exponential Moving Average) for calculation, it is using T3. That produces a smoother result without adding any lag.
Stochastic Extended
This version of Stochastic Oscillator allows you to use any of the 4 basic types of averages (default is SMA, but you can use EMA, SMMA or LWMA too) - some are "faster" then the default version (like EMA and LWMA versions) and SMMA is a bit "slower" but this way you can fine tune the "speed" to signals ratio.