Rejoignez notre page de fans
- Publié par:
- Mladen Rakic
- Vues:
- 9228
- Note:
- Publié:
- 2016.10.04 13:43
- Mise à jour:
- 2017.05.02 17:07
-
Besoin d'un robot ou d'un indicateur basé sur ce code ? Commandez-le sur Freelance Aller sur Freelance
In statistics and the theory of probability, quantiles are cutpoints dividing the range of a probability distribution into contiguous intervals with equal probabilities, or dividing the observations in a sample in the same way. There is one less quantile than the number of groups created. Thus quartiles are the three cut points that will divide a dataset into four equal-size groups (cf. depicted example). Common quantiles have special names: for instance quartile, decile (creating 10 groups: see below for more). The groups created are termed halves, thirds, quarters, etc., though sometimes the terms for the quantile are used for the groups created, rather than for the cut points.
q-Quantiles are values that partition a finite set of values into q subsets of (nearly) equal sizes. There are q − 1 of the q-quantiles, one for each integer k satisfying 0 < k < q. In some cases the value of a quantile may not be uniquely determined, as can be the case for the median (2-quantile) of a uniform probability distribution on a set of even size. Quantiles can also be applied to continuous distributions, providing a way to generalize rank statistics to continuous variables. When the cumulative distribution function of a random variable is known, the q-quantiles are the application of the quantile function (the inverse function of the cumulative distribution function) to the values {1/q, 2/q, …, (q − 1)/q}.
More information can be found here.
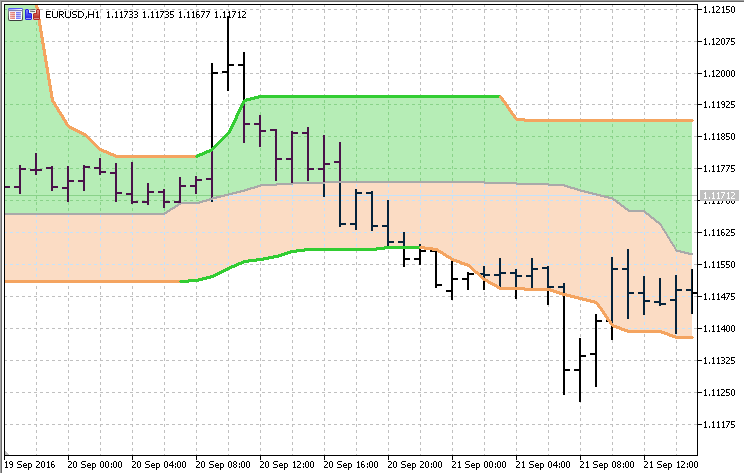
This indicator is constructing "bands" using 3 quantile values.

Traduit du russe par MetaQuotes Ltd.
Code original : https://www.mql5.com/ru/code/16491
 Bollinger Bands with Filling
This version of Bollinger Bands has a choice of calculating the standard deviation as a sample or as an uncorrected deviation.
 Fibonacci Auto Channel
The indicator is finding out the minimum and maximum for the desired period and draws fibo zones in those bounds.
 New Bar Alerter
Indicator sends the alert when new bar is formed.
 MA Ribbon
The indicator shows the areas, where fast MA and slow MA cross.