Rejoignez notre page de fans
- Vues:
- 10188
- Note:
- Publié:
- 2012.12.13 10:55
- Mise à jour:
- 2016.11.22 07:32
-
Besoin d'un robot ou d'un indicateur basé sur ce code ? Commandez-le sur Freelance Aller sur Freelance
The real author:
Svinozavr
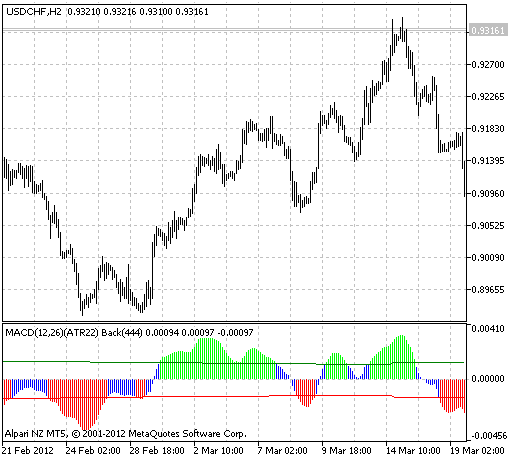
From the usual MACD type the _MACD_Xtr indicator differ in adaptive overbought/oversold zones (red and green lines), and also bars color in histogram in the corresponding colors when entering MACD in these zones.
Usually to adapt the indicator as a regulator, the indicator itself is used. If, for example, the scope of MACD is increased, correspondingly overbought/oversold zones' level is increased. The trouble of such approach is a phase delay. I.e. at first the indicator will display this overbought or oversold zones and only then with the delay on smoothing it will move the zones on a new level. As a result the extremum will be displayed at the very beginning of the movement, the meaning of such adaptation is only for the subsequent extremums. And if these are V-/\-shaped formations, why not W-M? And it is undesirable to lose profit from the first extremum.
What is the solution? For lack of time machine reasonable to use volatility source with a shorter period than the adaptive indicator itself. In this case, you can "pre-empt" the movement of the indicator, shifting levels of PC / PP before it begins its movement to them. But here is the complexity due to meeting two contradicting conditions for the control signal. On the one hand it can not be smooth, so as not to make the phase delay when volatility increases, and on the other hand it is necessary to hold and filter the reached level of the same volatility from the noise.
To solve this problem use a filtering with separated smoothing for front and damping which principle is described here. In this case you need only the damping filtering, and filtering of the control signal front is not necessary at all. (It is better to increase the volatility of the period itself.)))
Indicator input parameters:
//+----------------------------------------------+
//| Indicator input parameters                   |
//+----------------------------------------------+
input int FastMA=12; // period of the fast EMA
input int SlowMA=26; // period of the slow EMA
input AlgMode Source=ATR; // source
input uint SourcePeriod=22; // period of the source
input uint FrontPeriod=1; // Edge smoothing period; m.b. <1
input uint BackPeriod=444; // Period of damping smoothing; m.b. <1
input double xVolatility=0.5; // volatility
input uint Sens=0; // sense limit in pips. or in ticks (for volume)
input ENUM_APPLIED_VOLUME VolumeType=VOLUME_TICK;  //volume
input int Shift=0; //horizontal shift of the indicator in bars
This indicator was first implemented in MQL4 and published in Code Base at mql4.com on 04.02.2010.

Fig.1 The MACD_Xtr indicator.
Traduit du russe par MetaQuotes Ltd.
Code original : https://www.mql5.com/ru/code/1219
 Volatility_FBA_NR
The indicator to search extremums of volatility
 Exp_MA_Rounding_Channel
The breakthrough trading system using the MA_Rounding_Channel indicator.
 AutoTrendLines
The indicator automatically identifies points and draws support and resistance trend lines on them. There are two types of lines calculation
 Exp_TrendValue
Trading system drawn on the basis of the signals of the TrendValue indicator