Angle High Low
- Indicadores
- Taras Slobodyanik
- Versión: 1.30
- Actualizado: 10 junio 2020
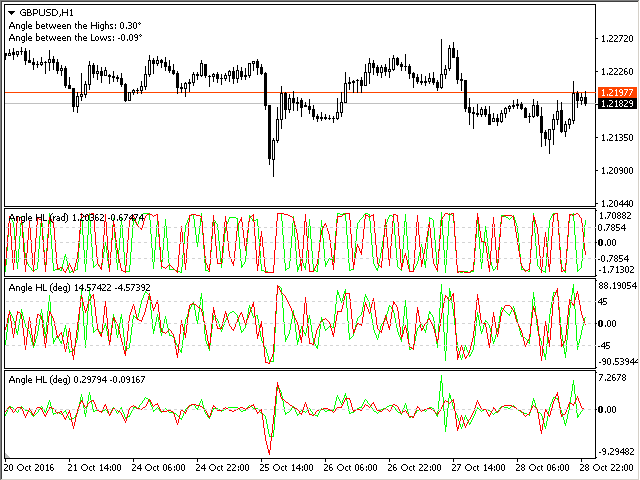
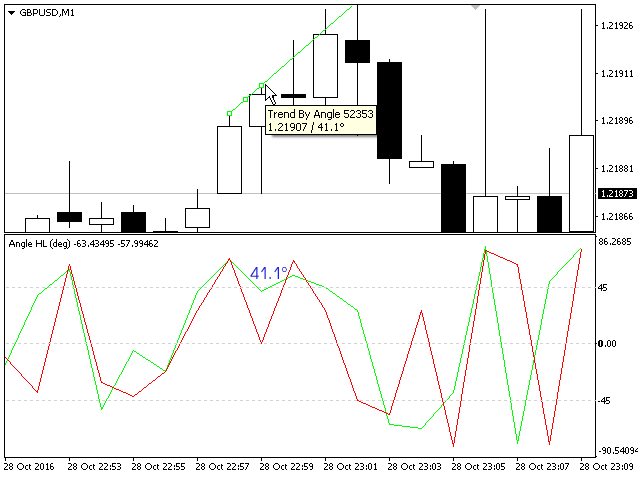
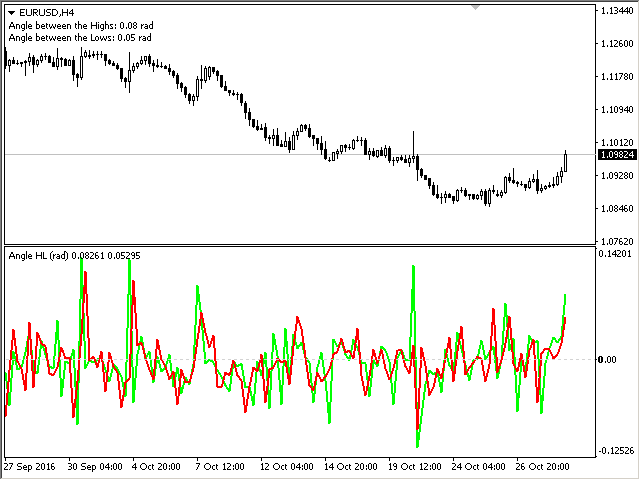
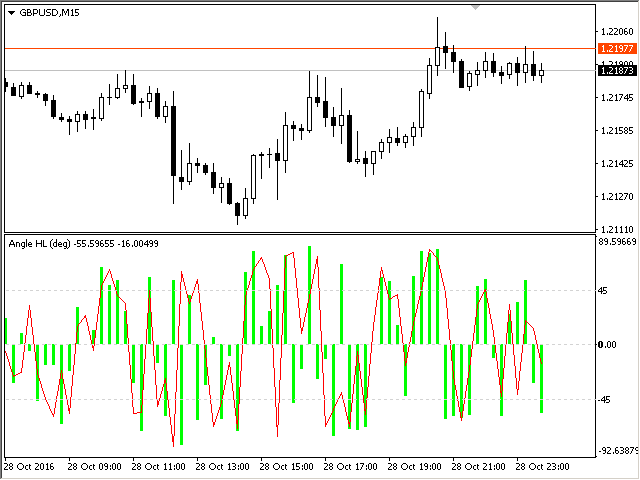
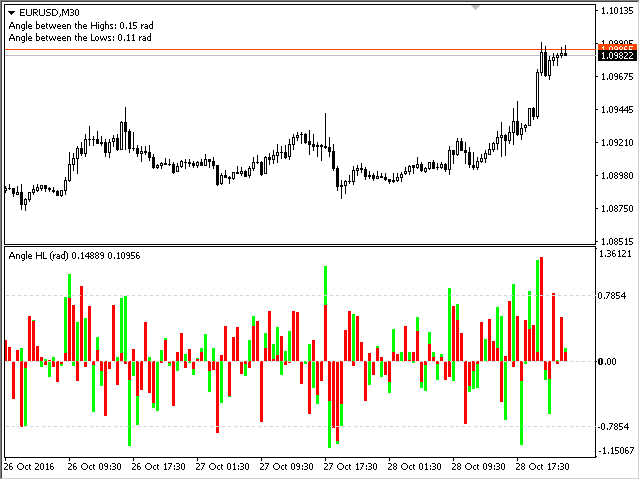
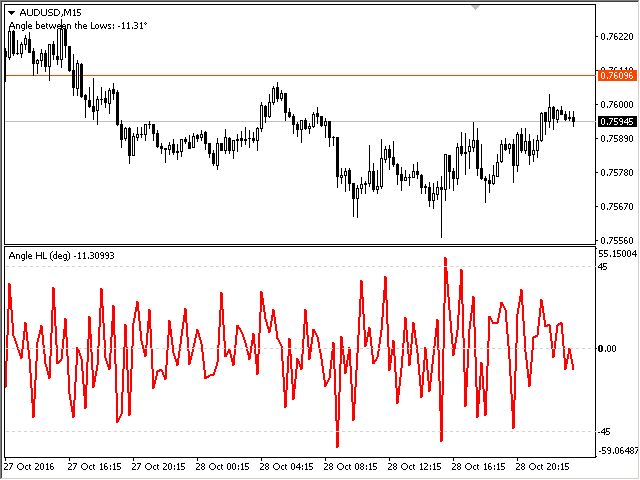
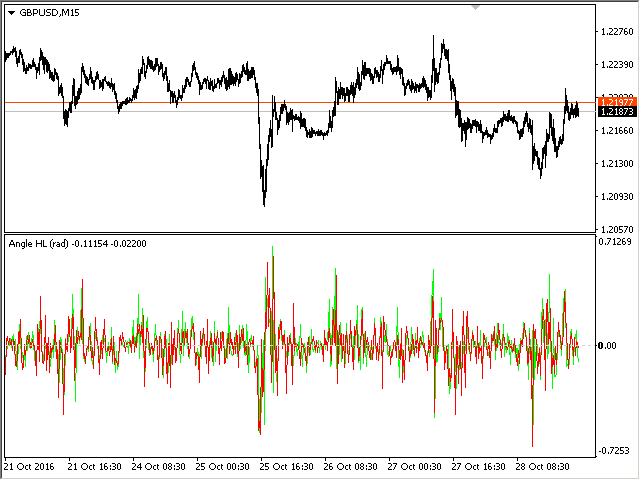
The indicator calculates the angle between the Highs, Lows and Closes of neighboring bars. The angle can be measured in degrees or radians. A linear chart or a histogram is drawn in a subwindow. You can set the scale for the calculation — floating or fixed.
For use in the EA, you need to specify a fixed scale.
Parameters
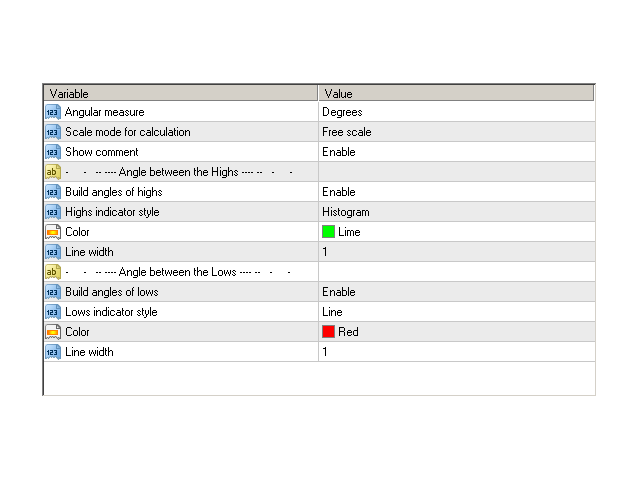
- Angular measure — degrees or radians.
- Scale mode for calculation — scaling mode. Free scale — free transformation, the indicator will calculate values each time the chart scale is changed. Fixed 1:1 — fixed scale (data will not be changed when the chart scale changes), calculations are performed in the 1:1 chart scale. Fixed 1:10 — fixed 1:10 scale, 1 unit along the Y-axis is increased tenfold. Further scales change accordingly.
- Show comment — show current data in a comment.
- Indicator Level 1 — value 1 for the indicator level.
- Indicator Level 2 — value 2 for the indicator level.
- Indicator Level 3 — value 3 for the indicator level.
- Build angles of Closes — enable plotting angles based on Closes.
- Style — drawing style for Closes: line or histogram.
- Color — the color of the Close lines.
- Line width — the width of the Close lines.
- Build angles of Highs — enable plotting angles based on Highs.
- Style — drawing style for Highs: line or histogram.
- Color — the color of the High lines.
- Line width — the width of the High lines.
- Build angles of Lows — enable plotting angles based on Lows.
- Style — drawing style for Lows: line or histogram.
- Color — the color of the Low lines.
- Line width — the width of the Low lines.
