Inside Bar Dashboard for MT5
- Indicadores
- Taras Slobodyanik
- Versión: 1.90
- Actualizado: 14 marzo 2024
- Activaciones: 10
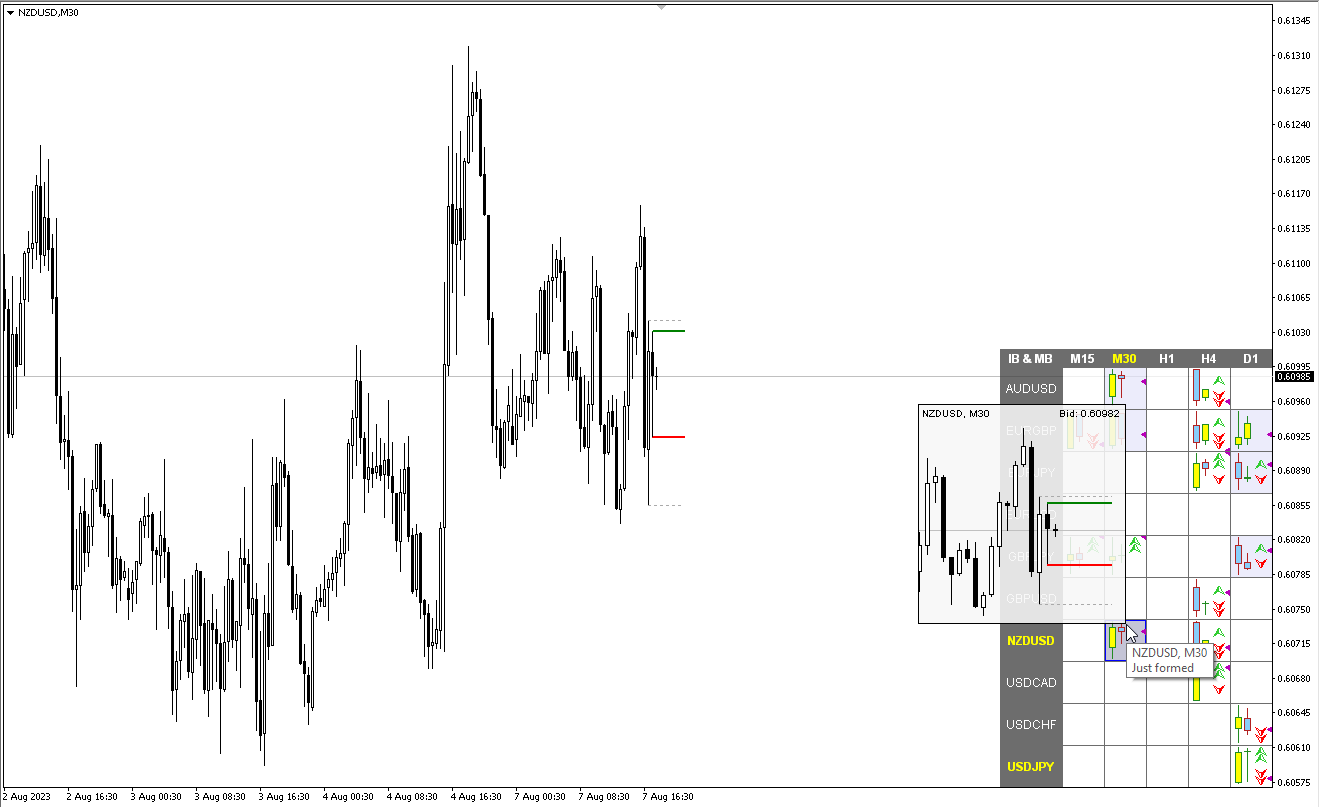
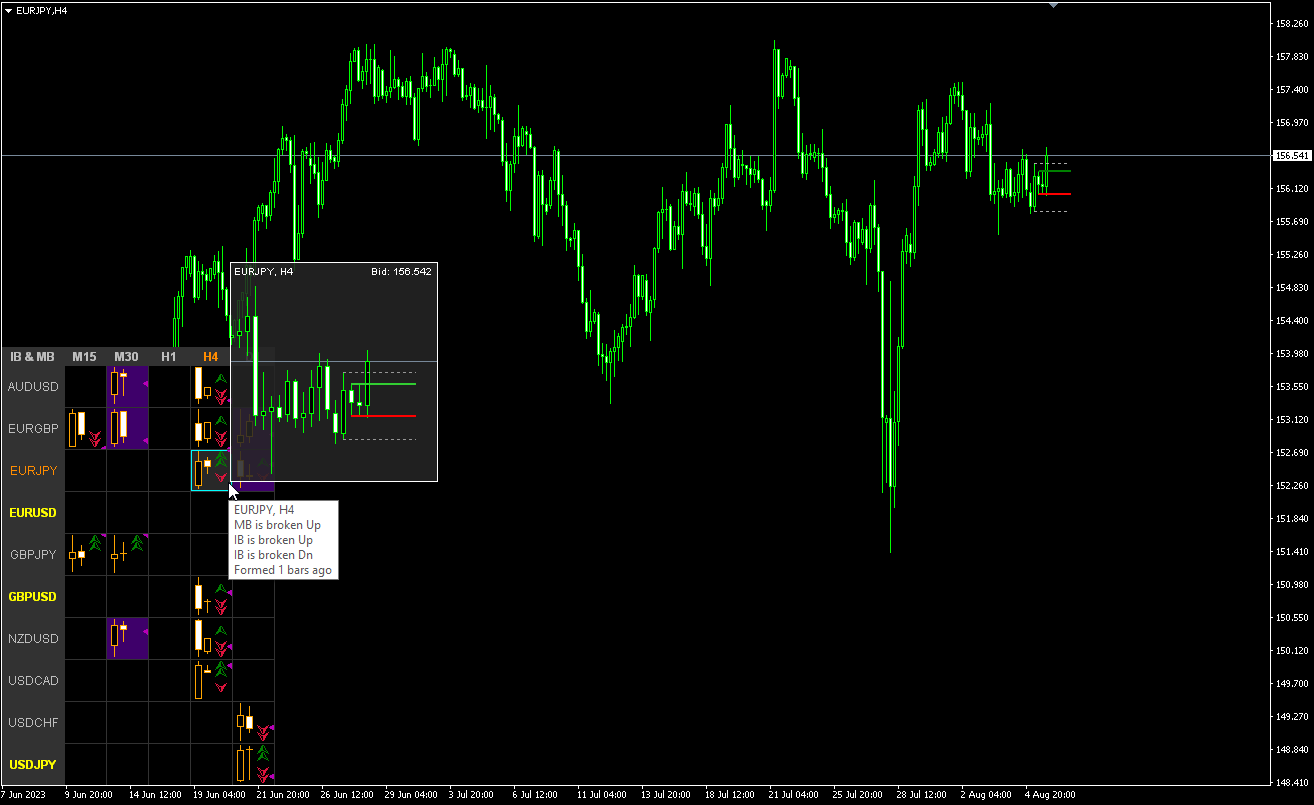
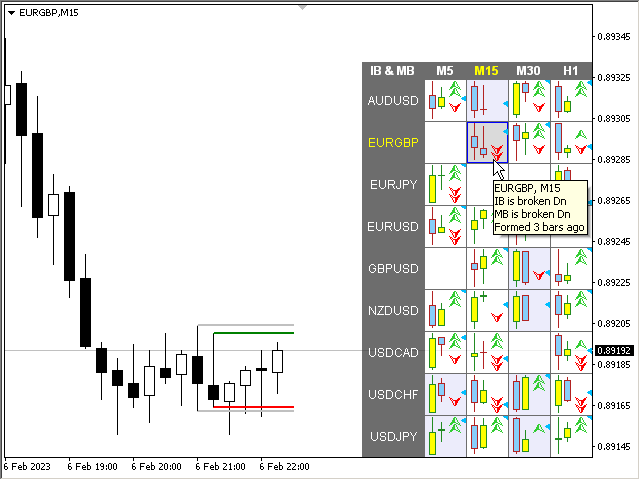
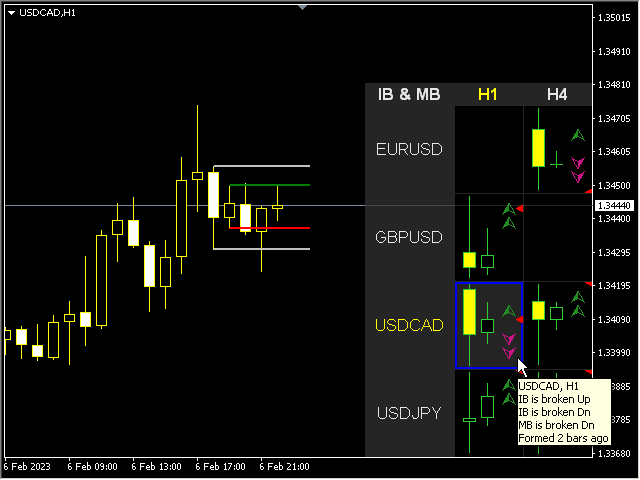
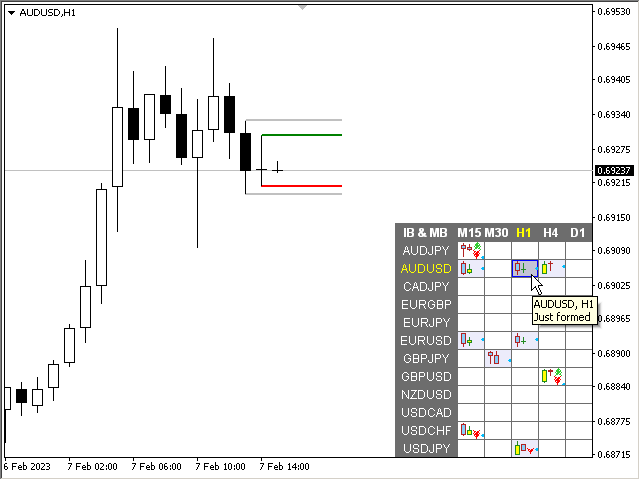
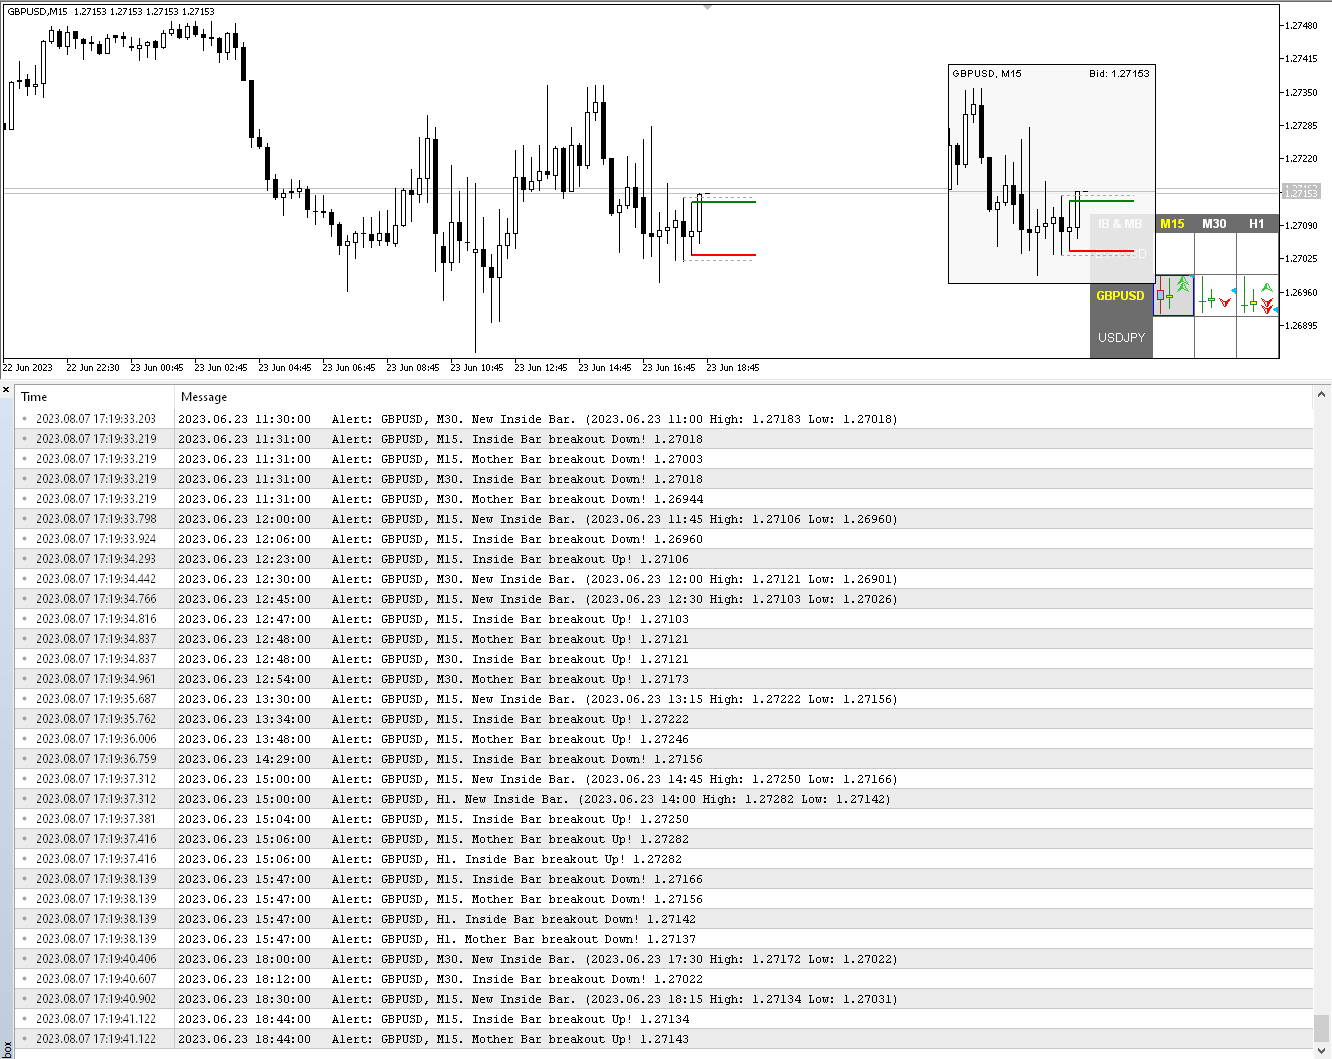
Indicador multidivisa y multitemporal Inside Bar (IB). En los parámetros, puede especificar las monedas y plazos que desee. El panel muestra el último patrón de barra interior (y barra madre) encontrado, la posición actual del precio y la ruptura de los niveles de las barras madre e interior. Puede establecer el tamaño y el color de las barras y el texto de las celdas. El indicador también puede enviar notificaciones cuando se superan los niveles. Al hacer clic en una celda con un punto, se abrirá el símbolo y el punto especificados. Este es el escáner MTF.
La clave para ocultar el panel del gráfico es "D" de forma predeterminada.
Parámetros
- How long pattern will be valid after first breakout (bars) — cuántas barras se mostrará la señal en una celda.
- IB body must be inside of the MB body - El cuerpo IB debe estar dentro del cuerpo MB.
- IB body and wicks must be inside the MB body - El cuerpo IB y las mechas deben estar dentro del cuerpo MB.
- If MB is IB, choose the next MB — Si MB es IB, elija el siguiente MB; si la barra madre encontrada es la barra interior de la señal anterior, entonces se mostrará la señal anterior.
- MB body must be large than IB body - El cuerpo MB debe ser más grande que el cuerpo IB.
- MB wicks must be smaller than MB body - Las mechas MB deben ser más pequeñas que el cuerpo MB.
- Ignore IB wicks (look only at the bar body) - Ignora las mechas IB (mira sólo el cuerpo de la barra)
- Ignore MB wicks (look only at the bar body) - Ignora las mechas MB (mira solo el cuerpo de la barra)
Panel
Clear the chart at startup - Limpiar el gráfico al inicio
Set of Pairs - Conjunto de pares:
— Market Watch - Reloj de mercado— Specified manually - Especificado manualmente— Current pair - Par actual.
Pairs (separated by a space or semicolon) — lista de símbolos separados por espacios o punto y coma. Los nombres de las monedas deben escribirse exactamente como los del broker, manteniendo las mayúsculas y minúsculas y el prefijo/sufijo.
Time Frames (separated by a space or semicolon) (multi timeframe) - Marcos de tiempo (separados por un espacio o punto y coma) (marcos de tiempo múltiples)
Sort pairs - ordenar pares
Position on chart - Posición en el gráfico
X offset (pix) - Desplazamiento X (píxel)
Y offset (pix) - Desplazamiento Y (píxeles)
Refresh dashboard every (seconds) - Actualizar el panel cada (segundos)
Open the pair in a new window - Abre el par en una nueva ventana.
Chart template - Plantilla de gráfico
Code breakout Up - Desglose del código hacia arriba
Code breakout Down - Desglose del código hacia abajo
Arrow color when IB is broken Up - Color de flecha cuando IB está dividido Arriba
Arrow color when IB is broken Down - Color de flecha cuando IB está desglosado
Arrow color when MB is broken Up - Color de flecha cuando MB se divide
Arrow color when MB is broken Down - Color de flecha cuando MB está desglosado
Bullish candle (fill) - Vela alcista (relleno)
Bearish candle (fill) - Vela bajista (relleno)
Bar up (boundary) - Barra arriba (límite)
Bar down (boundary) - Barra hacia abajo (límite)
Show price label in cell - Mostrar etiqueta de precio en la celda
Price label color - Color de la etiqueta de precio
Highlight color when IB just formed - Color de resaltado cuando IB se acaba de formar
Candles height size (font size multiplier) - Tamaño de altura de las velas (multiplicador de tamaño de fuente)
Candles width size (font size multiplier) - Tamaño del ancho de las velas (multiplicador del tamaño de fuente).
Alertas
New IB - Nuevo IB: alerta cuando se forma un nuevo IB.
IB breakout - Ruptura de IB: alerta cuando se superan los niveles de IB.
MB breakout - Desglose de MB: alerta cuando se superan los niveles de MB.
Lines on the chart - Líneas en el gráfico
Draw pattern on the chart - Dibuja el patrón en el gráfico.
Lines length (bars) - Longitud de líneas (barras).

Very good tool. Run smoothly.