ADX Dashboard
- Indicadores
- Taras Slobodyanik
- Versión: 3.70
- Actualizado: 6 mayo 2024
- Activaciones: 10
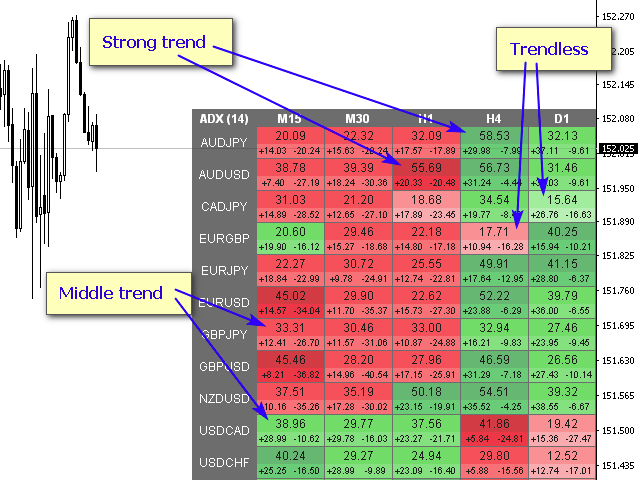
El indicador ADX se utiliza para determinar la tendencia y su fuerza. La dirección del precio se muestra mediante los valores +DI y -DI, y el valor ADX muestra la fuerza de la tendencia. Si +DI está por encima de -DI, entonces el mercado está en una tendencia alcista, si por el contrario, está en una tendencia bajista. Si ADX está por debajo de 20, entonces no hay una dirección definida. Tan pronto como el indicador supera este nivel, comienza una tendencia de fuerza media. Los valores superiores a 40 indican una tendencia fuerte (una tendencia bajista o alcista).
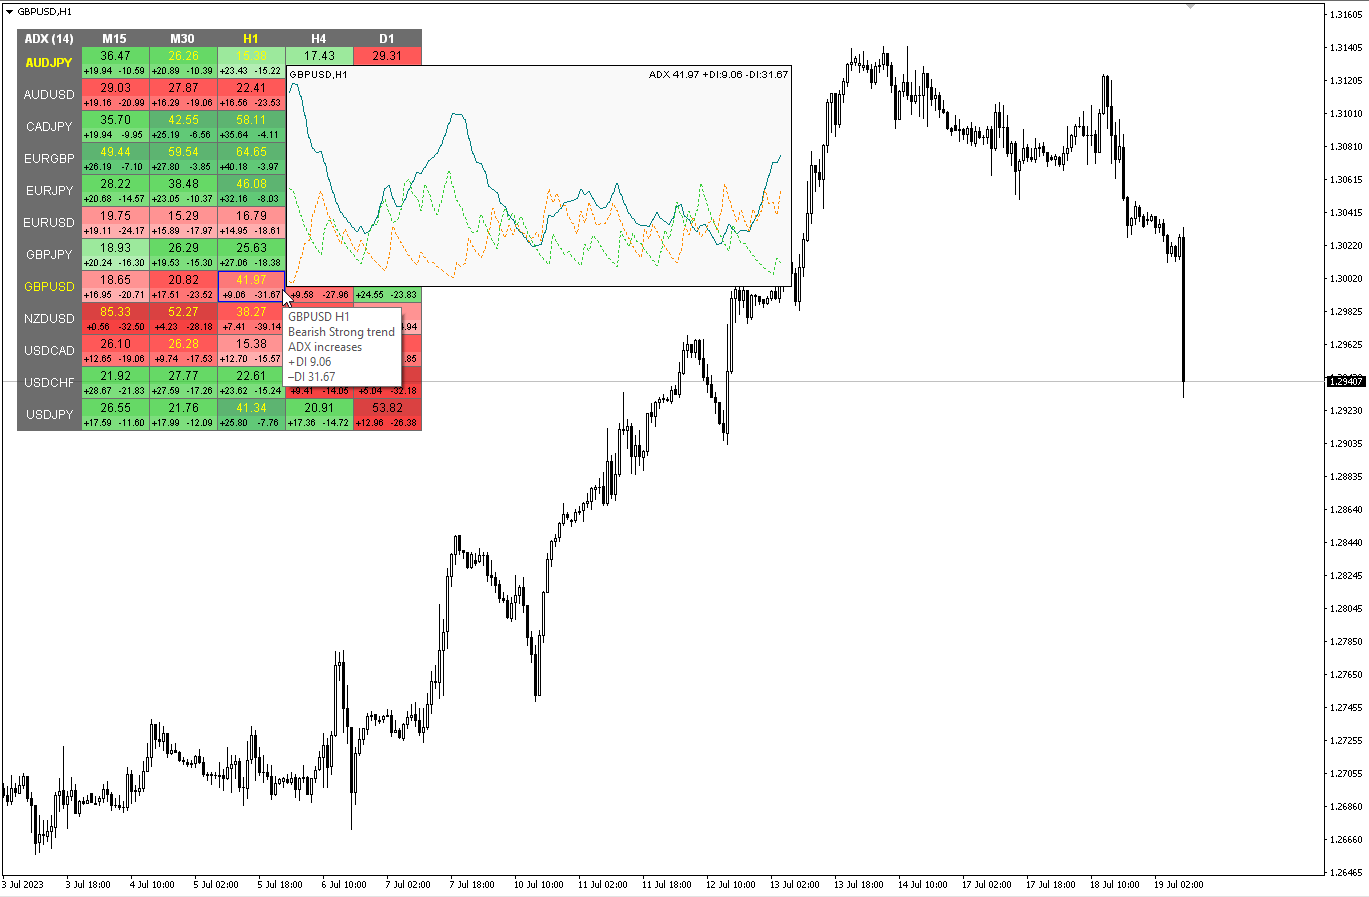
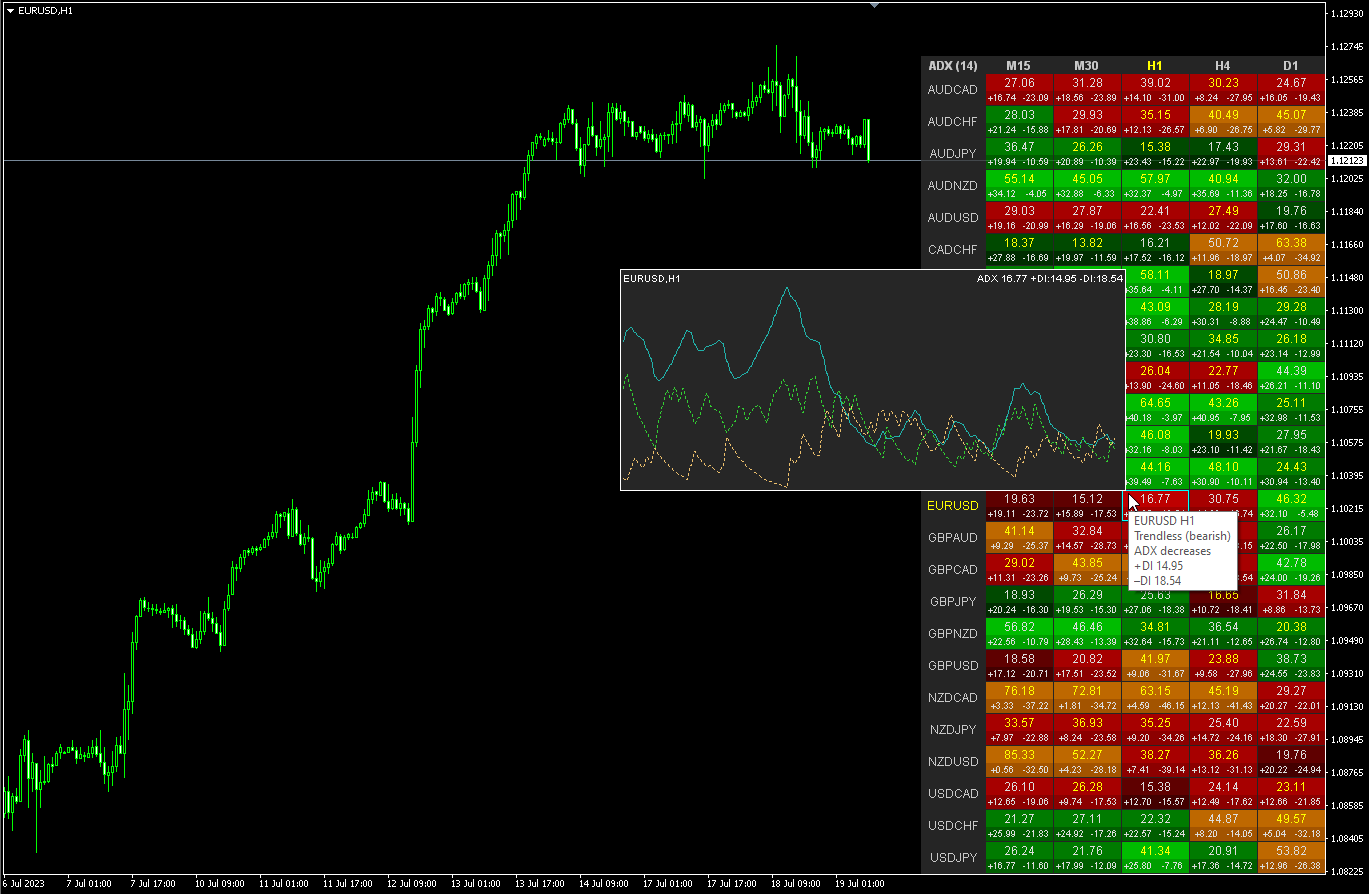
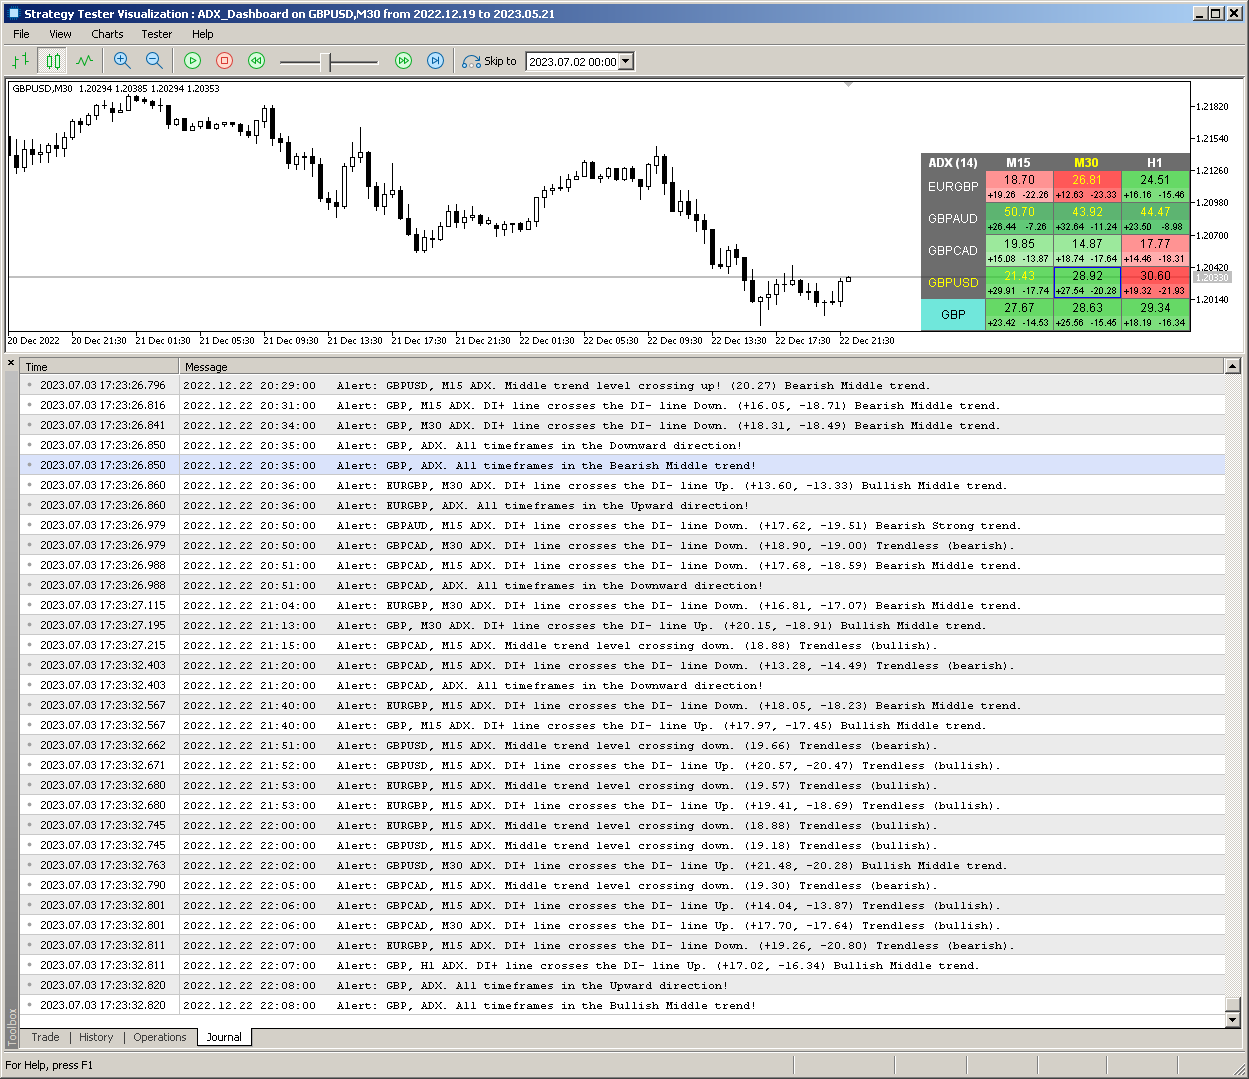
Modificación multidivisa y multitemporal del indicador Índice de movimiento direccional promedio (ADX). Puede especificar las monedas y plazos que desee en los parámetros. Además, el indicador puede enviar notificaciones cuando se cruzan los niveles de fuerza de la tendencia y cuando se cruzan las líneas +DI y -DI. Al hacer clic en una celda con un punto, se abrirá este símbolo y punto. Este es el escáner MTF.
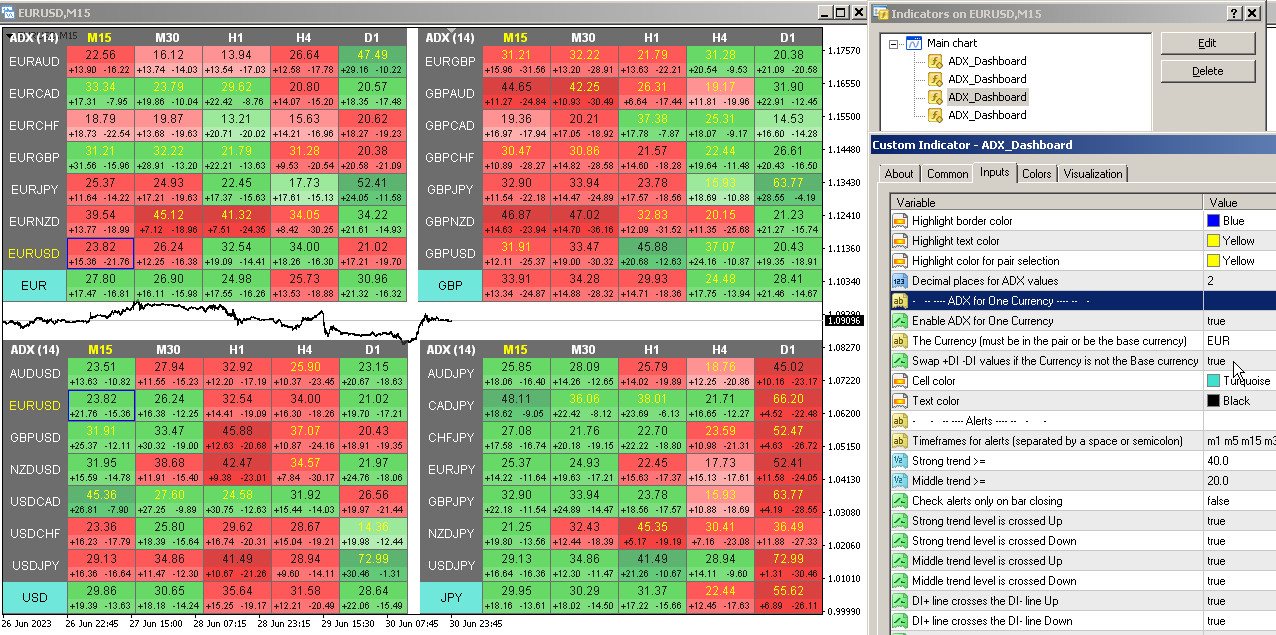
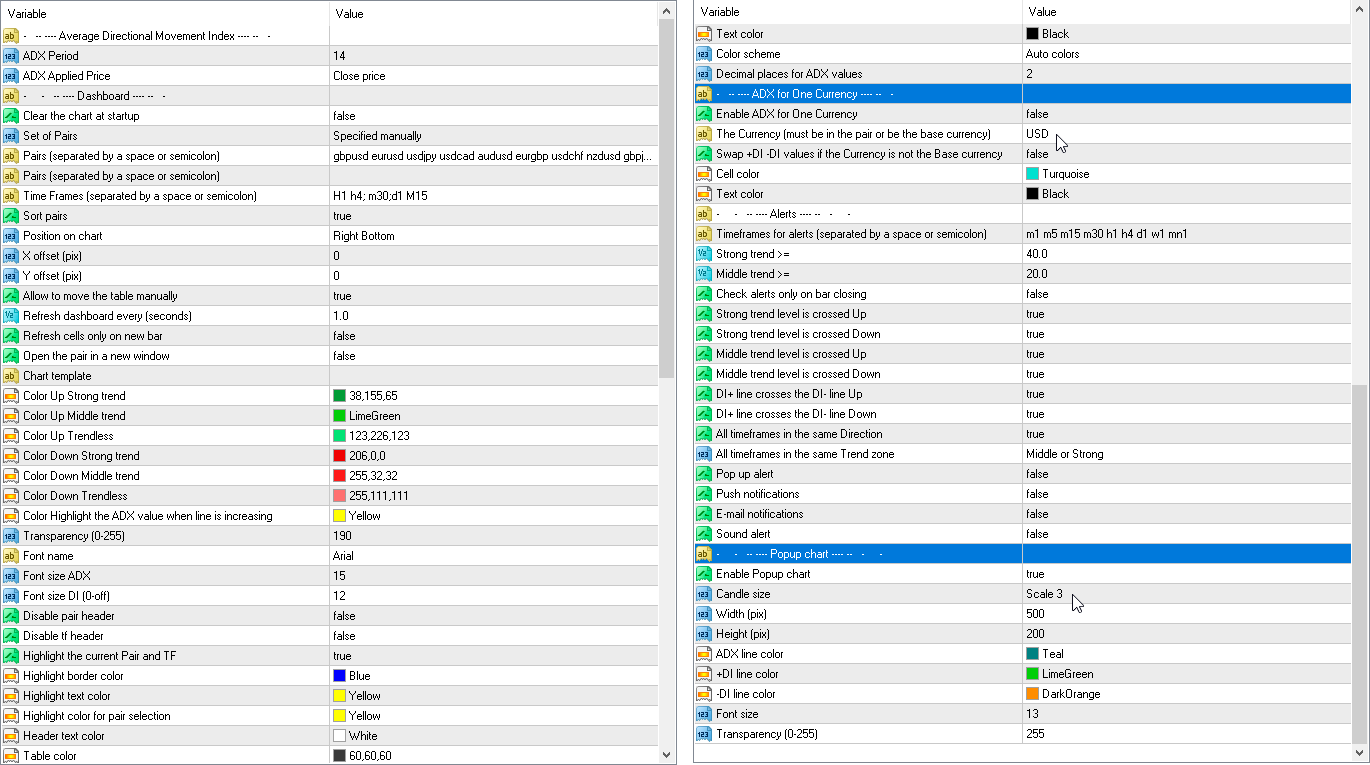
De manera similar al medidor de fortaleza de la moneda, el Panel puede seleccionar automáticamente pares que contengan una moneda específica o aquellos pares que tengan esa moneda como moneda base. El indicador busca Moneda en todos los pares especificados en el “Conjunto de Pares”; otros pares se ignoran. Y en base a estos pares, se calcula el ADX total para esta moneda. Y puedes ver cuán fuerte o débil es esa moneda.
La clave para ocultar el panel del gráfico es "D" de forma predeterminada.
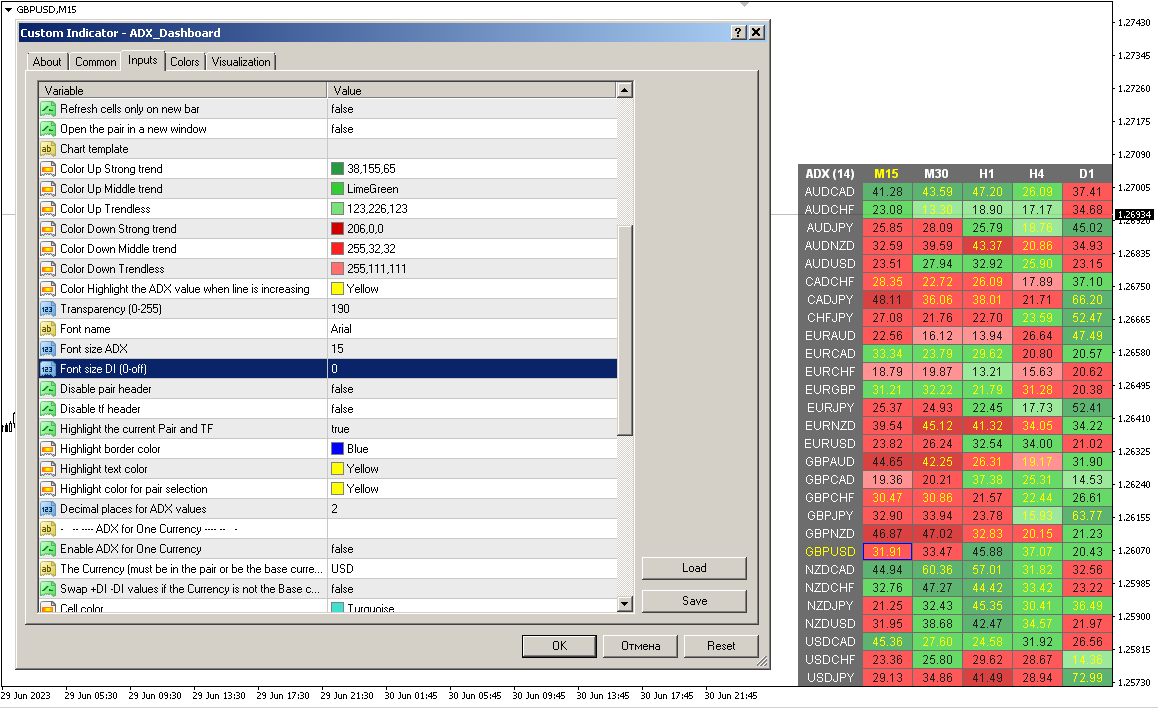
Parámetros
ADX Period - período de promediación.
ADX Applied Price - tipo de precio.
Clear the chart at startup - borre el gráfico al inicio.
Set of Pairs - conjunto de símbolos
— Market Watch — pares de "Market Watch".— Specified manually - pares especificados manualmente, en los parámetros "Pares".— Current pair - muestra solo el par actual.
Pairs (separated by a space or semicolon) - lista de símbolos separados por espacios o punto y coma. Los nombres de las monedas deben escribirse exactamente igual que los del bróker, manteniendo las mayúsculas y minúsculas y el prefijo/sufijo.
Time Frames (separated by a space or semicolon) - lista de períodos de tiempo separados por espacios o punto y coma (marcos de tiempo múltiples).
Sort pairs - ordenar la lista de pares.
Position on chart - esquina para mostrar el panel en el gráfico.
X offset (pix) - desplaza el panel a lo largo del eje X.
Y offset (pix) - desplaza el panel a lo largo del eje Y.
Allow to move the table manually - permite mover la mesa con el mouse.
Refresh dashboard every (seconds) - período de actualización para todos los pares y períodos de tiempo.
Refresh cells only on new bar - las actualizaciones de celda (y alertas) solo se producirán cuando aparezca una nueva barra.
Open the pair in a new window - abra un símbolo en una nueva ventana del gráfico haciendo clic.
Chart template - el nombre de la plantilla del gráfico, si el gráfico se abre en una ventana nueva.
Configuraciones de color
Color Up Strong trend - color de celda si hay una tendencia fuerte.
Color Up Middle trend - color de celda, si es la tendencia media.
Color Up Trendless - color de celda si no hay tendencia.
Color Down Strong trend - color de celda si hay una tendencia fuerte.
Color Down Middle trend - color de celda, si es la tendencia promedio.
Color Down Trendless - color de celda si no hay tendencia.
Transparency (0-255) — transparencia del panel.
Font name - Nombre de la fuente.
Font size ADX - Tamaño de fuente ADX.
Font size DI (0-off) - Tamaño de fuente DI (0-apagado).
Alertas
Timeframes for alerts (separated by a space or semicolon) - lista de períodos durante los cuales se enviará la alerta (separados por un espacio o punto y coma).
Strong trend >= — el nivel de una tendencia fuerte
Middle trend >= — el nivel de la tendencia media.
Check alerts only on bar closing - verifique el paso a nivel solo después del cierre de la barra.
Strong trend level is crossed Up - alerta cuando ADX cruza el nivel de una tendencia fuerte hacia arriba.
Strong trend level is crossed Down - alerta cuando ADX cruza el nivel de una tendencia fuerte hacia abajo.
Middle trend level is crossed Up - alerta cuando el nivel de la tendencia media se cruza hacia arriba.
Middle trend level is crossed Down - alerta cuando el nivel de la tendencia media se cruza hacia abajo.
DI+ line crosses the DI- line Up - alerta cuando DI+ cruza la línea DI-arriba.
DI+ line crosses the DI- line Down - alerta cuando DI+ cruza DI- hacia abajo.
All timeframes in the same direction - alerta cuando todas las celdas muestran la misma dirección.
DI+ changes direction - DI+ cambia de dirección.
DI- changes direction - DI- cambia de dirección.
DI+ crosses level X (0-off) - DI+ cruza el nivel X (0-apagado).
DI- crosses level X (0-off) - DI- cruza el nivel X (0-off).
Pop up alert - Alerta emergente.
Push notifications - Notificaciones push.
E-mail notifications - Notificaciónes de Correo Electrónico.
Sound alert - Alerta sonora.
Gráfico emergente
Enable Popup chart - Habilitar gráfico emergente
Candle size - Tamaño de la vela
Width (pix) - Ancho (píxeles)
Height (pix) - Altura (píxeles)
Font size - Tamaño de fuente
Transparency (0-255) - Transparencia (0-255)


HI, I just bought this indicator after the excellent RSI dashboard Multicurrency and i will try it now.
the 5 star are because Mr Taras made an update before i buy the product !
to add the possibility to adjust the number of decimals like my demand for RSI dashboard
Thanks so much for taking care of what your buyer need
I will come back after using it
Thanks again Warmly
2023 06 08 : with DASHBOARD RSI they are the 2 main that i use; very accurate and for me bring me good information's for my scalping M1 M5; Well done
2023 07 03 : I ask to add an functionality and this was made so quickly ! definitively Mr Taras has very good products and an real attention to the need of his users
i really regret to not be able to put 10 stars.
Well done and thanks so much to make it so so quickly
You are in the top of the sellers taking care of users ++++++++
2023 07 05 : It ask for an update (but later) and Taras made it so so so quickly. Thank you so much
10 stars for user supports , quality, usability, and so on
2024 04 30 : the 2 dashboard RSI and this one ADX are really efficient, easy to use and param and light in ressources computer, 2 of my most important indicator. well done.
2024 04 30 : this day i ask for a change of display and the same day Taras made an update, it save me half width of the dashboard on a very big screen. Thank you a lot and difficil to make better. Very Very well done.