Leonardo Barata / Profile
- Information
|
10+ years
experience
|
0
products
|
0
demo versions
|
|
0
jobs
|
0
signals
|
0
subscribers
|
Leonardo Barata
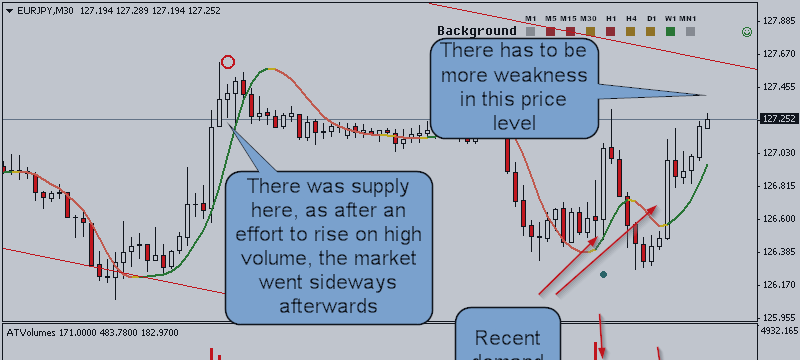

Euro/Yen has an established trend channel, that is validated since 6th April. It’s now bouncing off the lower line and getting near the upper part of the channel, which makes it an interesting pair to watch right now...
Share on social networks · 2
146
Leonardo Barata
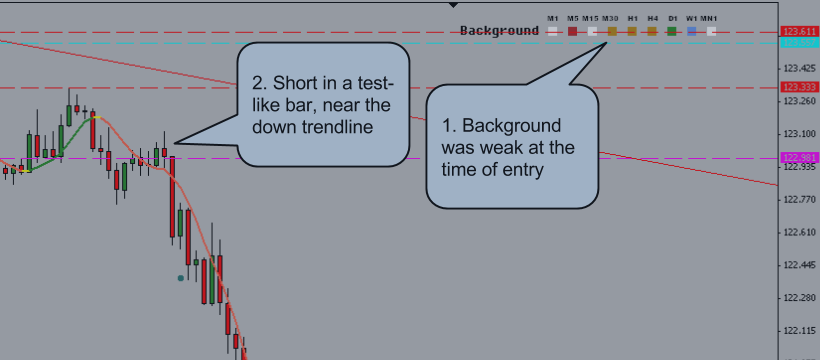

1. Weak background, signaling a previous downtrend and weak prospect before the trade 2. When prices are near the down trendline, short in a test-like bar (http://analyticalvsa.com/entry-bars/4587792396) 3. Exit on a strong signal. On the previous blue signal was also possible...
Share on social networks · 4
195
2
Leonardo Barata


Like I wrote in the previous post about EURUSD, this pair is currently ranging and seeing both selling on the tops, and buying on the bottoms (ie near the support). So the strategy should be to wait for prices to come either near the support or resistance, and trade accordingly...
Share on social networks · 1
275
Leonardo Barata
Published post EURUSD Intraday Volume Spread Analysis
Since 27/January, Euro/US Dollar is in a trading range between 1126 – 1153. We’ve seen very high buying activity near the lower support, and selling on the middle/near the resistance, and now the prices are right in the middle...
Share on social networks · 4
374
Leonardo Barata
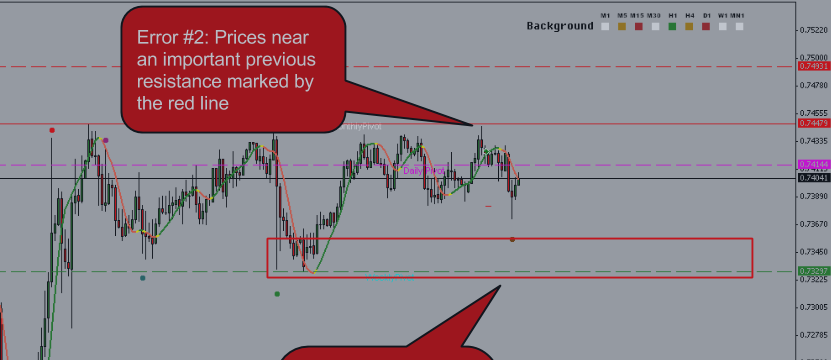

Long in 7414, whereas in this situation, you should look for longs in the 7320 – 7350 area marked by the rectangle. This is because that’s the price level where there was previous strength (green signal with very high volume earlier), so we want to wait for prices to test that area...
Share on social networks · 3
156
Leonardo Barata


After being alerted of prices being near a down trendline in NZDCAD, it also can be seen that Analytical Trader is pointing that the background is weak both in M30 and H1, which is a good indication...
Share on social networks · 2
165
Leonardo Barata
Published post AUDCAD Intraday Analysis - AUD Pairs Showing Strength Despite Gold's Weakness
Lately AUD pairs are showing some interesting behavior, and are keeping the advances despite the gold tanking. AUDCAD, after failing the break-out of the 99 80 resistance (#1 – shown by the red supply signals, and by the fall since then), started showing demand at 23th January (#2...
Share on social networks · 2
123
Leonardo Barata
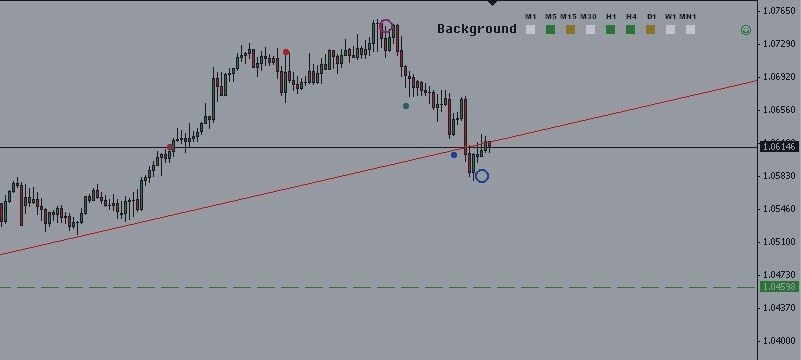

Looking at AUDNZD H1, there's an uptrend in place, but trading the trend is not all.. Also have to see if the recent volume action may break the trendline later, and we've seen supply at 106 92 - 107 29 (to watch at Monday) Read more http://analyticalvsatrading.com/2015...d-h1-analysis...
Share on social networks · 2
155
Leonardo Barata


Published post USDCHF H1 - 15/January/2015 +1375 Pips today!
Hours before the Swiss National Bank announcement to cut the LIBOR rate, there was a heavy supply signal in H1. Shorted right after that bar: The movement that proceeded : Exit right after that demand (green signal), for a total of +1375 PIPS...
Share on social networks · 3
773
1
tradesafenow
2015.01.16
How could you exit your trade as there was no liquidity in that time even for brokers!!! This can't be true as you said, people are not stupid as you think!
Leonardo Barata
2015.01.16
Lol, mate, I posted the trade and the trade log there in the post so don't even bother. Take care.
Leonardo Barata
2015.01.16
If you looked at it carefully before making false accusations, you'd see the exit is 70 pips above. Turns out that in 1400+ pips, 70 pips doesn't really make a difference.
Leonardo Barata
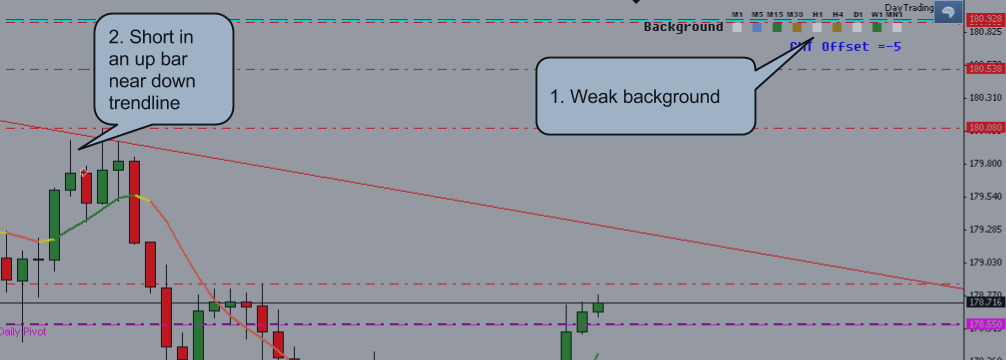

1. Background was weak at the time of entry 2. Enter in a low volume up bar near a down trendline 3. Exited on the trailing stop. There was a minor signal (the first dot), but I wait for 2 of those to exit...
Share on social networks · 2
168
Leonardo Barata
Published post CADJPY M15 13/January/2015 - Why not to enter too far away from the trendline
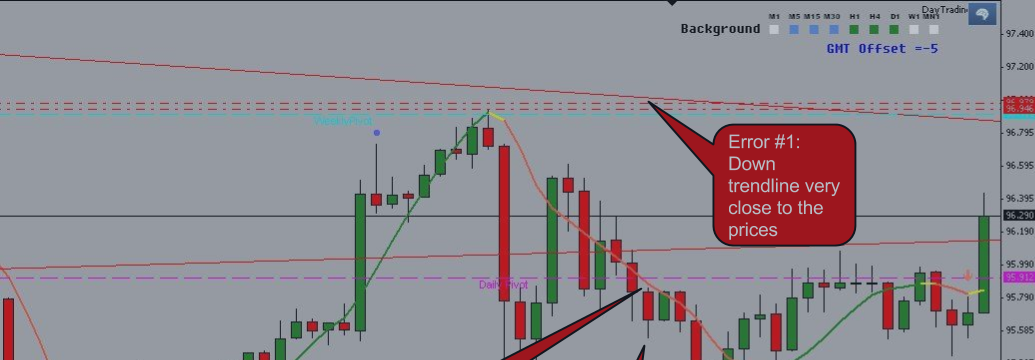
This is an incorrect way of trading the trendline setup. With the prices so far away from the trendline, whipsaws are much more likely...
Share on social networks · 3
148
Leonardo Barata


1. Weak background - Analytical Trader analyzes the trend and VSA signals to determine the strength or weakness of the market. 2. Enter in a low volume up bar near the down trendline (trendline drawn from 16th December) 3. Exited on trailing stop...
Share on social networks · 4
180
Leonardo Barata


(trade at 11th December) 1. Background strong or neutral at entry 2. Demand signals when Hull was still red (market was in downtrend). Go long in a low volume down bar when Hull is green, as this signals lack of supply. 3. Exit on a supply signal...
Share on social networks · 3
280
Leonardo Barata
Left feedback to developer for job Verifying the checksum of a file
Did the job quickly and effectively!
Leonardo Barata
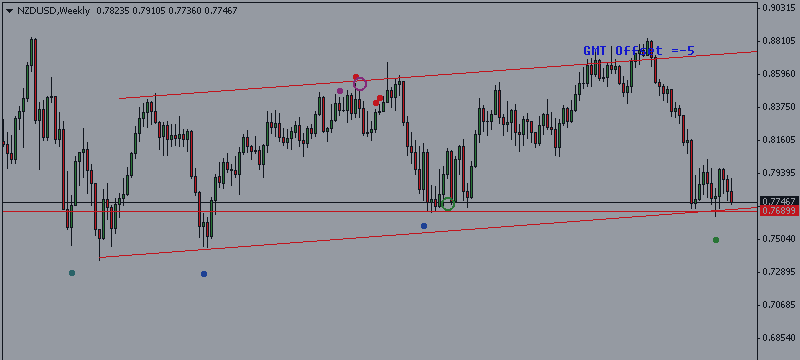

New Zealand Dollar/USD is right above a long-term up trendline and also above a support formed in June/2013. In terms of volume, in the daily, we got a big market shake-out on that blue signal with a very high volume, which also made a new low...
Share on social networks · 2
143
Leonardo Barata


1. Strong background on the current and above timeframe 2. Strong signals before the Hull turned green 3. Exit after a strong signal. +35 pips Analytical Trader...
Share on social networks · 1
133
Leonardo Barata


EURJPY has seen a lot of selling at 142.8 – 143.931 level by institutional traders. This was first marked by a high volume up bar with the next candles down. If this was true buying, the market would have gone up instead of stalling...
Share on social networks · 1
213
Leonardo Barata


Waiting for prices to come lower. It’s possible that it continues the current rally, especially because there was a large amount of accumulation recently, but a decent stop loss would be too far away, and it’s a counter-trend trade. Analytical Trader...
Share on social networks · 1
233
Leonardo Barata


Bank of Japan announcement made most of the move happen – when you use VSA, you’ll be exactly on the right side of the news, because the professionals and insiders already took their positions before the announcement (refer to the last post on FOMC announcement), and you can see it on the chart...
Share on social networks · 4
204
:
