Leonardo Barata / Profile
- Information
|
10+ years
experience
|
0
products
|
0
demo versions
|
|
0
jobs
|
0
signals
|
0
subscribers
|
Leonardo Barata


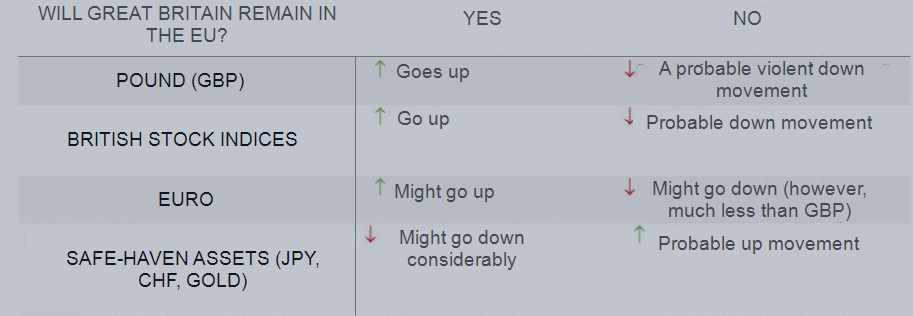
As the voting for the Brexit continues, many investors are trying to figure out what’s going to happen, and what the consequences of the voting will be...
Share on social networks · 3
238
Leonardo Barata


NZDUSD broke out an old high at 0.705 last week. Since then, it has been showing weak action seen by the stalling prices and high volume, and today, a low volume rally to the breakout’s price...
Share on social networks · 2
125
Leonardo Barata


Daily For the past months, Euro/Yen has seen buying between 121.00 – 124.50, shown by the multiple strong signals at this area, and the high volumes at the bottom...
Share on social networks · 1
417
Leonardo Barata


In this trade a long was taken at the strong VSA signal, though there was distribution behind. This is seen by the multiple Major Supply signals, with the prices not advancing further...
Leonardo Barata


USDJPY On the last post I noted that USDJPY was on a trading range, and the closest zone to watch was between 106.200 – 106.300. Prices reached that zone on the Asian session, and did so on wide high volume bars, breaking-out 106.200 to the downside, which also made the background turn to weak...
Share on social networks · 1
151
Leonardo Barata


After a wide upthrust bar, also marked as heavy supply, on last Wednesday, the Yen broke the support at 107.62 the day after. It broke with healthy volume, and the prices only stopped downtrending on a reverse upthrust, and later a churn, which are volume patterns that show demand...
Share on social networks · 1
138
Leonardo Barata


Gold Upon reaching $1235, there has been significant selling on gold by major players, which can be seen by the volumes in both Forex (on high liquidity brokers) and Futures. An important high was made at $1272, which held on multiple break-out attempts...
Share on social networks · 1
109
Leonardo Barata


Tomorrow the number of US non-farm employment numbers will be released, together with the Unemployment rate. Before, at 9:30 UTC+1, the British manufacturing PMI will also be known. GBPUSD is on a short-term uptrend, ad on the long-term, it’s near a down trendline...
Leonardo Barata


In the first hours of today’s London session, activity and volumes spiked up in gold. This activity, VSA showed, was major supply hitting the market, just below a high formed days before, on heavy supply, at $1258...
Share on social networks · 1
228
Leonardo Barata


These commodities have been among the biggest rises in prices in the past few months, and coupled with the bond market, give an interesting inter-market view on the global financial markets. Stock Market The latest rally has been in a great part, lead by gold/oil groups...
Share on social networks · 1
188
Leonardo Barata


The 4-hour chart of the USD/CHF once again shows a minor supply signal, which, taking into account weak background of the market, may mean that the bearish trend will continue...
Share on social networks · 1
320
Leonardo Barata


After a break-out of an important support at around 9300 on 8th February, DAX, along with the other European and American indices, made a significant retracement and rallied above the break-out price. The chart of M15 below shows the second rally, with prices reaching the previous high...
Share on social networks · 1
232
Leonardo Barata


EURUSD has been in a strong uptrend after breaking out from a base last week. The prices also broke an important down trendline in a furious up movement, on high volume and wide range up bars. It’s now in a critical area that will be characterized by a high volatility...
Leonardo Barata


In my previous EURJPY analysis I pointed out that the prices were just testing a down trendline, and given the accumulation seen behind, it’d be wise to wait for an up-breakout of the resistance...
Leonardo Barata
The trading guide on our website for VSA was just updated with new images, following the recent changes in the trading guide, after the 3.0 update on AT – Alert System. In each of the sections, you can now find the new charts explaining the concepts, showing successful and failed setups. Likewise, Alert System page was also updated.
Soon there will be new videos available, and an exciting new indicator, specialized in spotting important price zones. Stay tuned!
http://www.analyticaltrader.com/trading-guide-update/
Soon there will be new videos available, and an exciting new indicator, specialized in spotting important price zones. Stay tuned!
http://www.analyticaltrader.com/trading-guide-update/
Leonardo Barata


XMAS Discount: Until 14th January we're making a discount of $50 on Reversals indicator. This is an indicator that shows probable price reversals with a high degree of accuracy and has customizable inputs so the indicator can be optimized for the given market and timeframe to further increase its accuracy. The newer version also works in Renko charts. If you still haven't tried it, feel free to download the Free demo and try it for yourself!

Leonardo Barata
2016.01.12
While it was my intention for this to be a discount campaign, due to general fall in prices of indicators meanwhile in the market, we decided to make this new price permanent for now.
Leonardo Barata

The version 1.20 of Reversals is now available. In these last 2 updates, there was a general improvement on reversals success rate, while the least successful reversals were removed. The detection algorithms were also improved, and the lower sensitivities are now showing more reversals than before. There were also some important bug fixes along the way.
Altogether, Reversals 1.20 is now a more robust indicator than before, so if you don't own it, you can check the product's page to try a free demo of the indicator.
If you already own it, make sure to update it in the Terminal > Market > Applications (while logged in the MQL5 account), or visit its page here and click Buy while logged in (it wont spend anything as you already own it, and it'll download to Metatrader automatically).
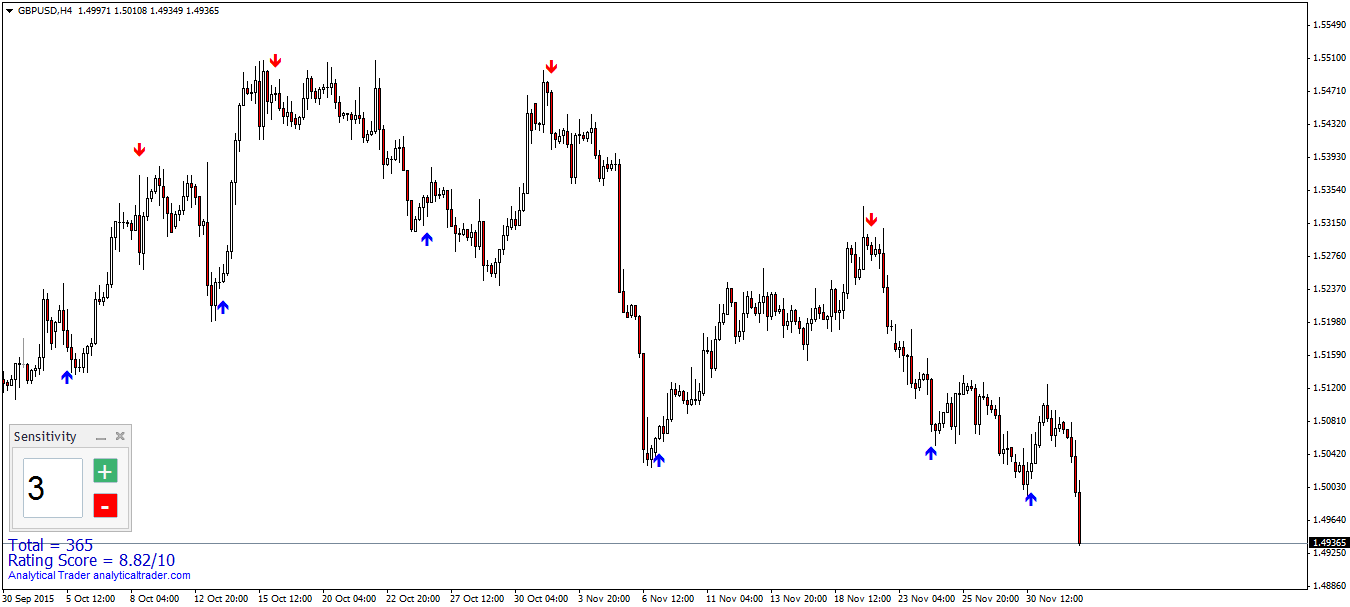
GBPUSD H4 with Sensitivity = 3 (FxPro feed), a low sensitivity that has been working well in this pairs H4 for the past months

Leonardo Barata


If we look at big picture in USDSEK, we see that Swedish krona has been moving in Mark-up phase since March 2014. It was a very persistent bull market without any reaction to the uptrend...
Share on social networks · 2
175
Leonardo Barata


In this chart you can see how short term resistance 5 times showed itself as a resistance to higher prices. The more often the resistance shows itself, the stronger it becomes...
Share on social networks · 1
319
Leonardo Barata


In this point the price has broken previous up-trendline and continued mark-down. This is a wide spread bar on very high volume closing in the middle. For the next bar to be up, this high volume must have contained more buying than selling (sign of strength...
Share on social networks · 1
168
: