Daily
For the past months, Euro/Yen has seen buying between 121.00 – 124.50, shown by the multiple strong signals at this area, and the high volumes at the bottom. It’s a quite loose accumulation pattern, since the market made a lower low at mid April (point 2) than the first bottom at February/2016 (point 1), along with the very significant selling seen on the lower timeframes, on the last rally (point 3). There is also a down trendline nearby, and due to these reasons, I’d be more inclined to trade a break-out of it on a lower timeframe such as H4, where it’ll be easier to manage the trade for a faster exit.

4 Hours
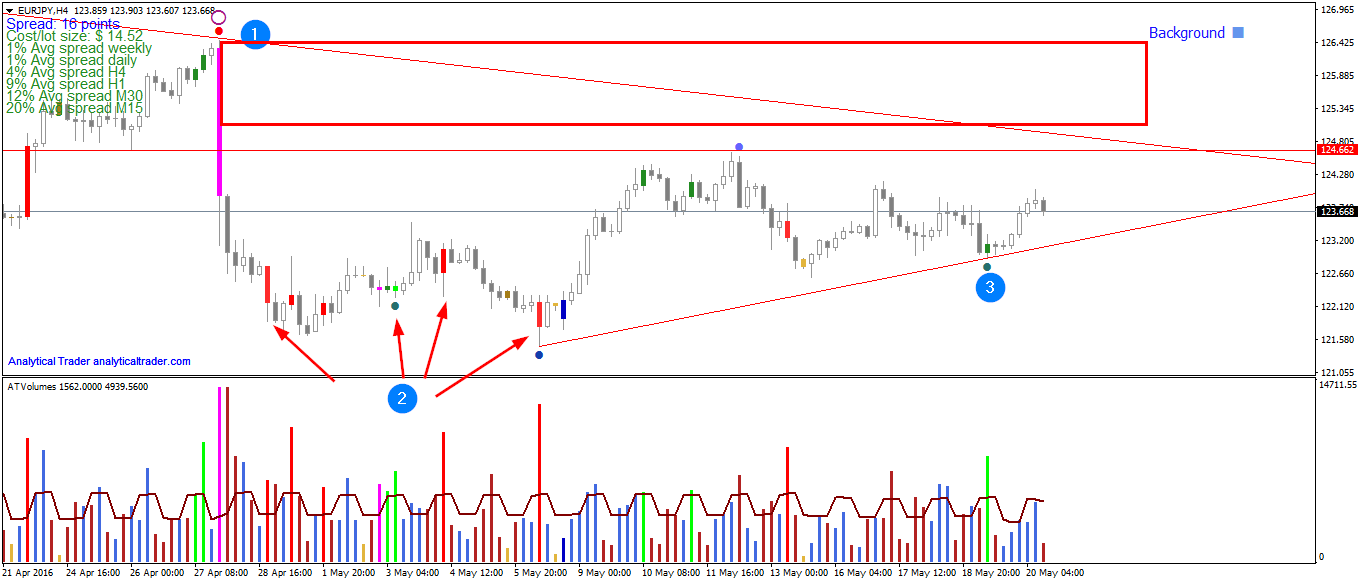
In the 4-hours timeframe, in point 1 VSA marked the bar as Major Supply, and as Supply using multi-timeframe analysis (showing as a circle). In this lower timeframe the most recent buying can be more easily seen, starting in point 2, where the arrows are pointing. Those are either high volume bars (red painted bars), which after a strong fall and price congestion, show demand in a more ‘disguised’ way than the VSA signals, and 2 VSA Demand signals. In point 3 there is another Demand signal, which is also a churn.
It’ll be valuable to see if there is a break-out of the trendline for a long trade, and to be alert for supply signals in the zone of previous supply, painted as the red rectangle. At 24/May (Tuesday) German ZEW Economic Sentiment is being announced, which if positive, could provide a price boost towards 124.670.


