Watch the Market tutorial videos on YouTube
How to buy а trading robot or an indicator
Run your EA on
virtual hosting
virtual hosting
Test аn indicator/trading robot before buying
Want to earn in the Market?
How to present a product for a sell-through
Technical Indicators for MetaTrader 4 - 131

an indicator for binary trading based on 3ma cross with macd , it gives buy and sell signals on bar open and it Doesn't Repaint or Back paint
the indicator is not focused on high win rate as it is made for martingale trading , the indicator focus on lowest losing signal count in a row.
Strategy :
Minimum Deposit is 1000 unite , we start the trading with 1 unite (trade size is 1 unite for every 1000 capital)
we double trade size on next signal if current signal lost , we only take indicator

Camarilla Pivot Points is a math-based price action analysis tool that generates potential intraday support and resistance levels. Pivot price values are stored in output buffers within this indicator, enabling any Expert Advisor to utilize this indicator's data for trading purposes. This indicator offers the potential for developing numerous strategies. To explore some of these strategies, please visit the following websites: https://www.babypips.com/forexpedia/camarilla-pivot-points https:
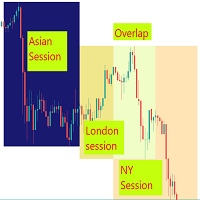
Visual guide which divides the 24 hours into three trading sessions. The default setting is to show Asian , London and New York sessions. But, the session start and end hours can be adjusted as required.
The indicator is useful to develop trading strategies by making it easy to see the market behavior during the three sessions.
Inputs Time Zone Start and End hours (Please provide values in HH:MM format, like 02:00, not like 2:00. Both the hours and minutes should have 2 digits)
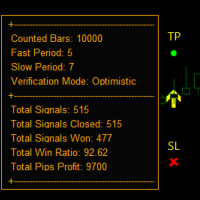
Based on 3 moving averages cross strategy the Statistic Arrow give buy and sell signals with tp and sl in points drawn on chart, it comes with back test dashboard that shows win rate and how many trades been close , how many have won, how many have lost , final profits made, the indicator prints arrow along side tp and sl ON -----BAR OPEN---- , and it gives pre alert.
Parameters are shown in settings screen shot and are explained.

**Title: Unveiling the GOLDEN SUN 123 TREND_Dashboard_With_Alert MT4 Indicator**
In the ever-evolving world of financial markets, traders are constantly seeking tools that provide them with a competitive edge. Amidst this quest for precision and profitability, the GOLDEN SUN 123 TREND_Dashboard_With_Alert MT4 Indicator shines as a beacon of opportunity. This remarkable indicator, designed for the MetaTrader 4 platform, encapsulates the essence of strategic trading with its trend-following cap
El estudio realizado en la plataforma MetaTrader 4 (MT4) se centra en el análisis de los niveles de desviaciones estándar (SD) correspondientes al modelo de retornos normales de precios en activos financieros. A través de un meticuloso procesamiento de datos históricos del mercado, se calculan las desviaciones estándar, lo que permite identificar rangos estadísticos donde los precios podrían oscilar en el futuro cercano. Es crucial entender que esta herramienta de análisis y medida cuantitativa
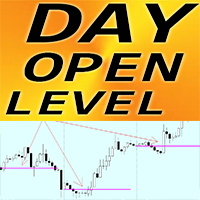
Forex Indicator DAY OPEN LEVEL for MT4 Indicator "Day Open Level" is very useful auxiliary indicator OPEN day level is so important because very often price returns to that area during the day. Indicator shows you daily open line for each day It is useful for intraday traders to set up targets or use as support/resistance area. Day Open Level indicator can be used for Reversal intraday trading // More great Expert Advisors and Indicators are available here: https://www.mql5.com/en/users/def138

This indicator is great for trading on many currency pairs The indicator itself uses mathematical strategies with augmented precision. Many settings can be configured. There are elements on the chart for visualization. He displays his solution on a graph in the form of icons. There are several types of icons. In the tester it works fine by default in the settings. It is already configured by default. Happy bidding.

This indicator is great for trading on various trading pairs. The indicator itself uses mathematical linear strategies of augmented accuracy, but for now they are optimized for some currency pairs. Many settings can be configured in the initial settings. There are lines and arrows on the graph for visualization. He displays his solution on a graph in the form of icons. There are only two types of badges. In the tester it works fine by default in the settings. It is already configured by default

In the ever-evolving world of financial markets, having the right tools at your disposal can make all the difference. Introducing "Super Trend Filtering," the MetaTrader 4 (MT4) indicator that elevates your ability to identify and leverage market trends. Key Highlights: Pinpoint Trend Accuracy: "Super Trend Filtering" harnesses cutting-edge algorithms to precisely identify market trends. Tailored to Your Preferences: Customize "Super Trend Filtering" to align with your trading strategy. Adjust

Point Trend Indicator - An indicator of the upper and lower level of the trend, which can determine the trend direction and indicate its strengthening. The trend direction is determined by round dots; if the points are above the zero line, the trend is bullish; if below, the trend is bearish. The increase in directional movement is indicated by arrows. It has the only parameter for manual adjustment - Duration of the trend direction.
Possibilities
Works on all time frames Adapts to any fin

Are you looking for a reliable tool to help you identify trends in the Forex market? Look no further! Introducing "Trend Spotting," your ultimate trend identification solution for MetaTrader 4 (MT4).
How to determine the trend: Down Trend: As soon as the Yellow signal line is below zero, the Green Slow Trend line is below zero and the main trend osliator falls below zero, it means that the downtrend has started. Up Trend: When the Yellow signal line is above zero, the Green Slow Trend line is

Bollinger Squeeze Trend Indicator is a technical analysis tool used in the investment and trading world. This indicator helps identify market trends by analyzing the price movements of assets.
The Bollinger Squeeze Trend Indicator uses a variation of Bollinger Bands and focuses specifically on the relationships between volatility and price movements. Essentially, the Bollinger Squeeze Trend indicator is designed to recognize periods of narrowing and widening of bands. This can help identify p

xBrat Range Breakout For The MT4 Platform. Designed to help define opening ranges of major markets, along with Gold Pit opens, Oil Pit opens and for major economic data points. We recommend timeframes for opening ranges on different type of instruments further down this description.
The xBrat Range Breakout combines the xBrat indicator with the range breakouts. It identifies price movements, market momentum, and trends. MT4 xBrat Range Breakout isn’t only about finding breakout chances. It hel

A universal pulse indicator for finding an entry point for a trend breakdown, followed by transaction tracking at Fibonacci levels without redrawing. The indicator itself is an independent trading system designed for intraday trading on the M5 time frame, but it also performs well on large timings. Trading on the indicator occurs exclusively with pending orders, which allows you to solve one of the biggest problems of any trader, these are trend - flat definitions. The essence is to filter out

The Market Structures Pro indicator finds and displays 5 (five) patterns of the Smart Money Concepts (SMC) system on the chart, namely:
Break Of Structures (BoS) Change of character (CHoCH) Equal Highs & Lows Premium, Equilibrium and Discount zones with Fibo grid High-high, Low-low, High-low and Low-high extremes
Patterns are displayed for two modes - Swing and Internal and are easily distinguished by color on the chart. Internal mode features higher contrast colors, finer lines, and sm

custom Power Trading Indicator or in short called Customm.
This indicator combines multiple build in custom indicators for super accurate prediction of price movements on all trading pairs like EUR/USD , USD/JPY , GOLD , OIL , SILVER . This indicator can be converted to and expert adviser also , this indicator is very good for scalping or a long time positions . This indicator doent not repaint or re draw .

Fibonacci Killer - Your Ultimate Trading Assistant Are you ready to take your trading to the next level? Introducing Fibonacci Killer, the ultimate trading indicator designed to help you spot critical trading opportunities like never before. Key Features : Fibonacci Magic : Fibonacci Killer harnesses the power of Fibonacci retracement levels to provide you with precise entry signals. It monitors the market and generates signals as soon as a new candle begins, giving you a head start in your trad

Next level of trend trading here. Possibility 75%, the indicator analyzes the current market to determine short (small dot), middle (circle with a dot inside) and long (cross with a circle and a dot inside) trends. Wingdings characters of Aqua color represents the beginning of the UP trend. Wingdings characters of Orange color represents the beginning of the DOWN trend. Possibility 75% Indicator will improve your trading in the world of forex, commodities, cryptocurrencies and indices.

Добрый день. Всем привет. Здравствуйте. Я. трейдер 20 лет опыта торгов. Вадим Сергеевич Лепехо. Предлагаю Вам на смотрины индикатор. Индикатор прост. Работает по мувингам. Работать на нем лучше всего с 09:00- 18:00 мск. времени. На "таймфреме": m5; m15. Слегка замысловатая схема чтения сигнала в виде стрелок. Если индикатор рисует стрелку на графике вверх, ХОД ДЕЛАЕМ ВНИЗ от Low - откладываем 10 пипсов, ход делаем - отложенным ордером(pending), SELL STOP Если индикатор рисует стрелку на графике
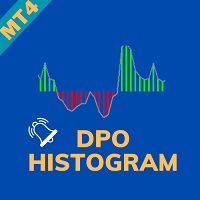
Indicator DPO Histogram Alert - The Ultimate Trading Companion Unveil the potential of the "DPO Histogram Alert Indicator," your steadfast ally in the realm of trading. This robust tool is meticulously crafted to ensure you're always in the know by providing prompt alerts based on the Detrended Price Oscillator (DPO) Histogram. Basic Details : Indicator Type : DPO Histogram Alert Alert Features : Real-time alerts for significant DPO Histogram movements. Customization : Fully adjustable settings

Всем привет. Данный индикатор прост, как божий день. Кстати, я , Вадим Сергеевич Лепехо, трейдер(частный) опыт 20 лет. Предлагаю приобрести мой индикатор. Построен он на базе индикатора arrrows_template. Индикатор рисует стрелки на графике при пересечении скользящих. Все просто. Видим стрелку вниз - ходим вниз отложенным ордером(pending) SELL STOP, откладываем от Low 10pips(пипсов). Фиксируем профит в целях 5, 10,15 пунктов. Видим стрелку вверх - ходим вверх отложенным ордером(pending) BUY STOP

The UT Bot Alert MT5 Indicator is an advanced technical analysis tool designed to help traders optimize their trading performance. This indicator is MT5 conversion of the UT Bot alerts indicator by “QuantNomad “ in Trading View website and some alert methods are added to provide real-time alerts when a trading signal is generated, in order to allow traders to act quickly and efficiently. Key Features: Alert Types: in addition to the terminal pop-up alerts, the mobile notification sends the alert

Добрый всем ДЕНЬ, вечер, утро. Я, трейдер(частный), Вадим Сергеевич Лепехо, 20 лет опыта. Предлагаю Вам очередной продукт. Построен на базе индикатора arrows_template.Индикатор не затейливый. Вообщем прост в понимании. Видите квадраты синего цвета: High & Low. Ждите куда цена пробьет, после пробития дожидаемся появления зоны: боковик, флэта, консолидации, замедления, накопления. Выставляем отложенный ордер от High или Low смотря куда был пробой: вверх или вниз. Цена приблизительно почти доходи
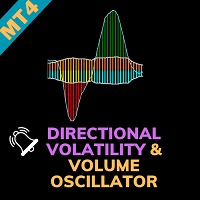
Directional Volatility & Volume Oscillator - Unleash Your Trading Potential Welcome to a new era of trading excellence with the "Directional Volatility & Volume Oscillator." This innovative indicator is engineered to provide you with essential insights into market volatility and volume, empowering you to make well-informed trading decisions. Basic Details : Indicator Type : Directional Volatility & Volume Oscillator Key Metrics : Real-time volatility and volume insights for precise trading analy

Step into the future of automated trading with the Beast Indicator V7, The indicator allows you to trade binary options. T his indicator give high winning ratio with over 20 years of backtesting an unparalleled tool that seamlessly transforms your trading journey into an effortless and lucrative venture. Designed to simplify and optimize the trading process, the Beast Indicator is the ultimate game-changer, offering a hassle-free experience that allows you to set your buy and sell options effo
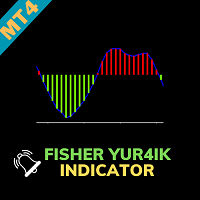
Fisher Yur4ik Indicator - Unlock Precise Trading Insights Explore a world of precision in trading with the "Fisher Yur4ik Indicator." This advanced tool is designed to provide traders with accurate insights into price trends, allowing for well-informed decisions and enhanced profitability. Basic Details : Indicator Type : Fisher Yur4ik Indicator Key Metrics : Real-time analysis of price trends and potential turning points. Customization : Fully customizable settings to align with your unique tra

GG TrendBar Indicator - Your Multitimeframe ADX Trading Solution Experience the power of multi-timeframe trading with the "GG TrendBar Indicator." This versatile tool, built upon the ADX indicator, offers precise insights by considering multiple timeframes, ensuring you make well-informed trading decisions. Basic Details : Indicator Type : GG TrendBar Indicator (Multi-Timeframe ADX) Key Metrics : Real-time ADX analysis across multiple timeframes. Customization : Enable or disable specific timefr

We are pleased to introduce the All in One Indicator named
Top Breakout Indicator MT4
The indicator has been developed by a team with years of experience in trading and programming.
MQL5 Channel: https://www.mql5.com/en/channels/diamondscalping Telegram Channel: https://t.me/autoprofitevery MT5: https://www.mql5.com/en/market/product/107047?source=Site+Market+Product+Page
With just this one indicator, you can both trade and manage your account easily. The indicator consists of 2 main fu
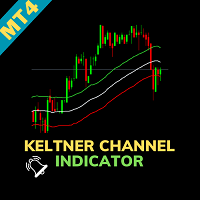
Keltner Channel Indicator - Uncover Market Trends with Precision Welcome to the world of precision trading with the "Keltner Channel Indicator" for MetaTrader 4. This powerful tool, inspired by Chester Keltner's work, helps you analyze price movements and identify potential trends with remarkable accuracy. Basic Details : Indicator Type : Keltner Channel Indicator Key Metrics : Real-time price volatility analysis. Customization : Fully customizable settings to align with your unique trading stra

Introducing the Accumulated RSI, your ultimate tool for precise trend identification and momentum analysis in the world of Forex and financial markets. This cutting-edge MetaTrader 4 (MT4) indicator, designed for traders seeking unparalleled insight and accuracy, empowers you to make well-informed trading decisions like never before. Features Accurate Trend Detection: The Accumulated RSI utilizes the Relative Strength Index (RSI) in an innovative way to pinpoint the prevailing market trends wit

The " Rsi Monitor Screen " is a powerful and versatile MetaTrader 4 (MT4) indicator designed to provide a comprehensive overview of the Relative Strength Index (RSI) across multiple timeframes on a single screen. This tool is essential for traders seeking a holistic view of RSI data, enabling informed decision-making and precise analysis. Key Features: Multi-Timeframe RSI Display: This indicator displays RSI values for various timeframes, from M1 (1 minute) to MN1 (monthly), all on a single, use

The Levels ResSup MT4 trading indicator independently builds support and resistance lines on the price chart, as well as the expected additional channel lines.
INFORMATION ABOUT THE INDICATOR The indicator has support levels (indicated in blue) and resistance levels (indicated in red). The indicator also has more forming support levels (such levels come in strokes with the colors mentioned earlier).
There are also internal support levels (marked in green) and resistance levels (marked in pi
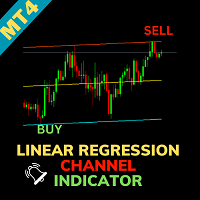
Linear Regression Channel Indicator - Visualize Trends with Precision Enter the world of precision trading with the "Linear Regression Channel Indicator" for MetaTrader 4. This versatile tool, based on linear regression analysis, provides you with a clear visual representation of market trends, enabling you to make well-informed trading decisions. Basic Details : Indicator Type : Linear Regression Channel Indicator Key Metrics : Real-time price trend analysis through linear regression. Customiza
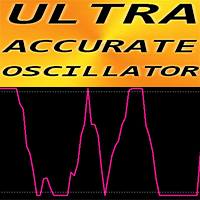
ULTRA ACCURATE Oscillator for MT4 UA Oscillator - is an advanced custom indicator with around 80% accuracy when it is used in combination with trend indicator such as EMA for example. Advanced new calculation method is used. UA Oscillator is much faster and more accurate than standard MT4 oscillators. New generation of Oscillators - see pictures to check examples of how to use it in combination with EMA10. Oversold values: below 0.03 // Overbought values: over 0.97 There are plenty of opportu
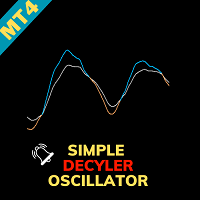
Welcome to the Simple Decycler Oscillator, a powerful indicator designed to enhance your trading experience. This user guide provides comprehensive insights into using the indicator effectively, ensuring you make informed trading decisions. Overview The Simple Decycler Oscillator is a versatile tool that combines two Decyclers, utilizing periods of 100 (fast - green) and 125 (slow - blue). This dual approach, akin to moving averages, facilitates trend identification through a straightforward cr
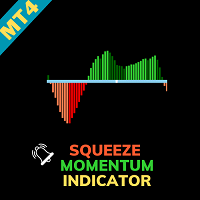
Squeeze Momentum Indicator - Unleash the Power of Market Momentum Welcome to the world of precision trading with the "Squeeze Momentum Indicator" for MetaTrader 4. This advanced tool is designed to help you harness the power of market momentum, providing you with actionable insights to make well-informed trading decisions. Basic Details : Indicator Type : Squeeze Momentum Indicator Key Metrics : Real-time analysis of market momentum. Customization : Fully customizable settings to align with your

Всем Добрый День. Вас беспокоит всех снова, я Вадим Сергеевич Лепехо. Предлагаю свой продукт на обозрение, просмотр, оценку его. Продукт(индикатор) прост в понимании сигнала(алерта), алготрейдинга. Индикатор рисует над свечами кружки, точки красного и зеленого цвета. Нужно дождаться появления череды точек одного цвета(цвет череды красный), а потом должен появиться зеленого цвета кружок, точка и обязательно сформироваться потом точка другого цвета, т.е. красного. Выставляем сетку ордеров вверх и

Всем добрый. Это снова, я, Вадим Сергеевич Лепехо. Предлагаю приобрести и протестировать кота в мешке, мяууууууу )))). Очень просится вы заметили. Данный индикатор рисует знаки на графике. Цена пробивает их и в принципе ожидаем возврата цены обратно. Индикатор работает, отталкивается от дивергенции на рынке форекс. Хотя, если вы опытные трейдер, юзеры. Рынка(форекс), как такого и нет. Это не суть Главное получать профит постоянно. Спасибо за внимание До свидания.

The GGP Squeeze Momentum MT4 Indicator is a volatility and momentum tool designed to help traders optimize their trading performance and providing traders with actionable insights to make well-informed trading decisions. This indicator is MT4 conversion of the Squeeze Momentum Indicator by “LazyBear “ in Trading View website and some alert methods are added to provide real-time alerts when a trading signal is generated, in order to allow traders to act quickly and efficiently. For MT5 version p
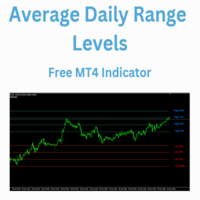
The Average Daily Range Levels indicator shows the ADR levels on the chart as if they were supports and resistances and is updated daily.
By default the indicator uses the 5-day average of the daily range. There are several strategies that suggest that these levels can be used to determine where the price can bounce and it is often said that the price can typically move 75% of the ADR.
In future versions I may add alerts at each level
Can you suggest any changes?
Greetings!

Support and Resistance Barry Indicator - Your Path to Precision Trading Explore the world of precision trading with the "Support and Resistance Barry Indicator" for MetaTrader 4. This robust tool is designed to help you identify key support and resistance levels with exceptional accuracy, enhancing your ability to make well-informed trading decisions. Basic Details : Indicator Type : Support and Resistance Barry Indicator Key Metrics : Real-time identification of crucial support and resistance l
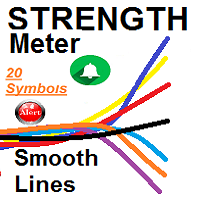
SMOOTH STRENGTH METER INDICATOR (SMOOTH LINE) it draws Currencies TREND Volatility Power / Strength lines : - Detects the 2 highly TRENDED Volatile pairs ( will be the Bold Lines ) - A very Helpful Indicator - It draws smooth lines for up to 20 currencies pairs representing Volatility strength and power - First it indicates the most powerful trended direction pairs : Strongest / Weaker - MAIN FUNCTION :it gives indication of the UP trend most Volatile Line and the

The signal trading indicator Sea Candles MT4 determines the direction of price movement using the CCI oscillator, generating signals to open a position. Commodity Channel Index [CCI] — measures the deviation of the price from its moving average. Divergence appears when the price reaches a new high and the CCI cannot rise above the previous highs. This classic divergence is usually followed by a price correction. CCI usually ranges within ±100. Values above/below ±100 inform about the overbought

The GGP Wave Trend Oscillator MT4 Indicator is a volatility and momentum tool designed to help traders optimize their trading performance and providing traders find the most accurate market reversals. This indicator is MT4 conversion of the Indicator: WaveTrend Oscillator [WT] by “ LazyBear “ in Trading View website and some alert methods are added to provide real-time alerts when a trading signal is generated, in order to allow traders to act quickly and efficiently. When the oscillator is ab

The Advanced Scalper MT4 forex indicator is a formula based on scalping trading, as well as on oversold and overbought levels. The indicator works on all currency pairs, cryptocurrencies, stocks, indices. A universal indicator that can be customized to your needs and it will never be superfluous in any trading strategy.
INFORMATION ABOUT THE INDICATOR The Advanced Scalper MT4 Forex indicator is presented in the form of a color histogram that does not hurt the eye and is pleasant to perceive.

The GGP ADX and DI MT4 Indicator is used to quantify trend strength. ADX calculations are based on a moving average of price range expansion over a given period of time. This indicator is MT4 conversion of the ADX and DI Indicator by “BeikabuOyaji “ in Trading View website and some alert methods are added to provide real-time alerts when a trading signal is generated, in order to allow traders to act quickly and efficiently. For MT5 version please click here . ADX is plotted as a single line w

Std Channels The Std Channels Indicator is a technical indicator that uses standard deviation to create five channels around a price chart. The channels are used to identify support and resistance levels, as well as trends and reversals. The indicator is calculated by first calculating the standard deviation of the price data over a specified period of time. The channels are then created by adding and subtracting the standard deviation from the price data. The five channels are as follows: Upper

The Forex Smart System is a user-friendly and intuitive trading solution designed to empower traders in the complex world of forex trading. With a focus on simplicity and practicality, this system offers a streamlined approach that makes it accessible to traders of all experience levels. User-Friendly Interface: The Forex Smart system is designed with simplicity in mind, making it accessible to traders of all experience levels. Its intuitive interface ensures that users can focus on trading rath
Support Resistance Tracking Indicator The Support Resistance Tracking Indicator is a technical analysis tool that helps traders identify and track support and resistance levels. It is a valuable tool for traders of all levels, from beginners to experienced professionals. How it works The Support Resistance Tracking Indicator uses a variety of methods to identify support and resistance levels. These methods include: Historical price action: The indicator looks for price levels where the market

Auto Channel Trend The Auto Channel Trend Indicator is a technical analysis tool that automatically draws trend channels on any chart. It uses a simple algorithm to identify the trend direction and then draws two parallel lines that represent the support and resistance levels of the channel. Features: Automatic trend channel drawing Support and resistance levels Trend direction identification Customizable parameters How to use: Add the indicator to your chart. Adjust the parameters to your likin

To get access to MT5 version please click here . Also you can check this link . This is the exact conversion from TradingView: "UT Bot" by "Yo_adriiiiaan". This is a light-load processing indicator. This is a non-repaint indicator. Buffers are available for processing in EAs. All input fields are available. You can message in private chat for further changes you need. Thanks for downloading
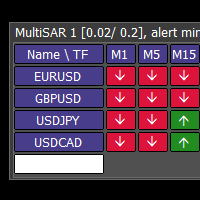
This tool monitors Parabolic SAR indicators on all time frames in the selected markets. Displays a table with signals to open a BUY trade (green) or SELL trade (red). You can easily add or delete market names / symbols. If the conditions for opening a trade on multiple time frames are met, you can be notified by e-mail or phone message (according to the settings in MT4 menu Tools - Options…) You can also set the conditions for sending notifications. The list of symbols/ markets you have entered
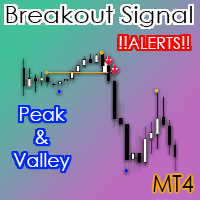
The valley and peak indicator strategy used in forex is a technical analysis approach that aims to identify potential trend reversals in the market. The strategy is based on identifying peaks and valleys in the price chart, which are points where the price reaches a high or low and then reverses direction. The valley and peak indicator is a tool that helps traders identify these patterns and generate buy and sell signals based on them. Here are the key steps involved in using the valley and pea
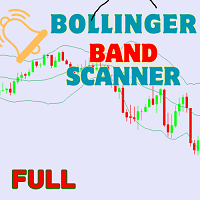
Welcome to the world of advanced trading with the Bollinger Bands Scanner! Maximize your trading potential with our powerful MT4 indicator designed for seamless analysis and real-time insights. Key Features: Effortless Bollinger Bands Scanning: Unlock the full potential of the Bollinger Bands Scanner by effortlessly scanning multiple assets. Receive instant alerts when specific Bollinger Bands conditions are met, ensuring you stay ahead of market movements. Comprehensive Dashboard Insights: Gai
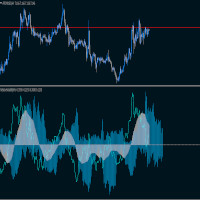
The indicator shows the deviation of the moving average relative to the volatility leading half of its period.
The red histogram shows the moving average relative to the anchor point.
The blue histogram shows volatility relative to the leading half
of the moving average.
The blue line simulates the price relative to the moving average.
The indicator is perfect for both grid trading and trend trading.
The signal does not change when the timeframe changes
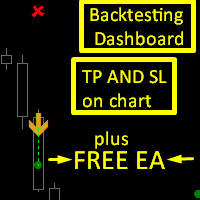
Ambitious Donchian EA can be downloaded from comment section but it need the ambitious donchian indicator to work.
Ambitious Donchian is a Donchian Channel and XO histogram based indicator that gives buy and sell signals in form of up and down arrows with tp and sl as objects on chart.
features :
1. Tp and Sl for each signal , the tp and sl can be selected as based on points or ATR value from indicator settings.
2.backtesting dashboard : the dashboard shows the following according to your i

This is the finest structure marking you will ever find in any market. indicator is coded considering the actual structure any trader would use. indicator is coded based on actual candle breaks and not coded based on any pivot or predefined values or specific number of candles high and low. please check out the screenshot. if you want me to fine tune it according to your needs then i am open for it.

The Flip Flop indicator tracks market trends, ignoring sharp fluctuations and market noise. The indicator can work both for entry points and as a filter.
The Flip Flop indicator displays information in a visual way. Helps in finding entry points during analysis. Suitable for trading on small time frames because it ignores sudden price spikes or corrections in price movements by reducing market noise around the average price.

Trend Channel is a Forex trend arrow indicator for identifying potential entry points. I like it, first of all, because it has a simple operating mechanism, adaptation to all time periods and trading tactics. Created based on a regression channel with filters. We display the signals of the Trend Channel indicator on the price function chart using a mathematical approach.
How it works: when the price breaks through the overbought/oversold zone (channel levels), a buy or sell signal is generate

The Wave Wold MT4 Forex indicator is designed to search for Wolf waves and display them in the current window of the trading terminal. An excellent indicator for traders who use Wolf waves in trading. Its application in trading strategies will significantly increase their efficiency and profitability.
INFORMATION ABOUT THE INDICATOR Unlike other Wolf wave indicators, the Wave Wold MT4 forex indicator has a number of features that significantly increase its effectiveness:
The first is the

The "Angel Algo" indicator, designed for the TradingView platform, is a powerful technical analysis tool that assists traders in identifying dynamic support and resistance levels in real-time. It provides valuable insights into potential breakout points and market regimes.
At its core, the "Angel Algo" indicator utilizes a rolling window of price data to calculate maximum and minimum price levels. It then dynamically identifies support and resistance levels by examining specific conditions re

Trend analysis is perhaps the most important area of technical analysis and is the key to determining the overall direction of an instrument's movement. The Quest Trend indicator determines the prevailing trend. They help analyze the market on a selected time interval. Trends are based on the principle of higher highs, higher lows (for an uptrend) and lower highs, lower lows (for a downtrend). They can have different time periods and they can be related to each other like fractals. For example,

Supreme Arrow is an arrow indicator for mt4 that is based on rsi and demarker indicators strategy. the strategy is suitable for trending markets , but also works in ranging markets especially if it is used for scalping
Recommended time-frame : any Recommended add-ons : 200 SMA The Supreme Arrow indicator doesn't repaint or back-paint and the signal is no delayed

With this tool you can create some useful data in a CSV file.
You can:
- Determine time frame - the number of candles to be loaded - Name the file whatever you want - Select additional data sets to be loaded
The following data is written to a CSV file.
- Time when the candle was created. - Open price - Close price - High price - Low price
The following selection is also available to you:
- Volume - RSI (you can also select the period) - Moving Avarage (you determine the period and m
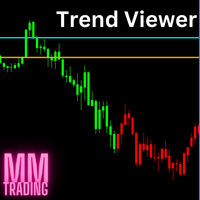
This indicator changes the color of the chart when prices are more bullish or bearish. It is recommended to use this indicator on small timeframes and only during peak trading hours. And don't forget your stop limit. This is not an oracle and not a holy grail.
In the settings, you can change the color of the candles and also their sentiment. To do this, use the Set 1 and Set 2 settings and test.
This is a multi-timeframe indicator that collects data from multiple time frames. It tries to identify the trend and predict a pullback. You have to understand that trends emerge suddenly and with that the pullback turns into a new trend. This is not a holy grail, always remember your stoploss. Use this indicator as a complement to your existing strategy.
The lines that are displayed on the chart can be changed so that they are only displayed in the indicator window and are therefore not dist
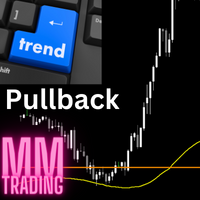
This indicator is not an ordinary moving avarage, even if it behaves similarly. I really like to use this to identify pullbacks. I only use this strategy once a day for one instrument, not more often. It is best if the price is further away from the line in the morning and when the pullback occurs, then you can create an entry setup using this indicator. Use additional indicators or use this as a supplement to your existing strategy.
This is not a holy grail. A pullback can quickly become a t
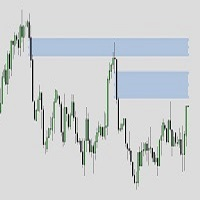
ICT Fair value gapes / Balanced price ranges it marks the fvgs i.e., bisi and sibi both filled and unfilled based on your requirements. it can work on mtf while your on any other time frame i.e., seeing on 5 min. you can watch from filled (BPRs) to unfilled (imbalances) of monthly/weekly/daily/H4/H1 to your likings It can be using multiple times using unique ID with buttons option to on and off the required TF or keeping them all.
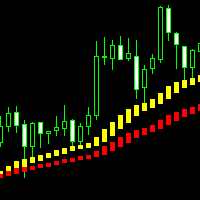
这是 一款可以直观识别波段趋势的分析指标,手工交易最佳选择,不重绘不漂移。 适应任何新手和量化交易的朋友。 参数设置(您购买指标后若不知道如何使用,请私信我): 快线: g_period_88 20
慢线: g_period_88 40
===========交易信号 ===========
快线:黄/蓝线;慢线:红/绿线 多头方向:快线上穿慢线,快线在慢线上方 空头方向:快线下穿慢线,快线在慢线下方
做多信号: 当快线上穿慢线形成一轮多头方向时,首轮多单进场条件为出现两根以上连续阴线,第3根以上K线出现一根阳线,且收盘价格在慢线上方,慢线为红线,即可成交第一单多单,同时如果满足价格回踩触碰到快线,出现一条阳线,且收盘价格在慢线上方,慢线为红线时,也可成交第一单多单;当第一轮多单结束后,此轮多头方向的多单只能满足价格回踩触碰到快线后,出现一条阳线收盘价格在慢线上方,慢线为红线时,才可继续做多进场,即不管快线是黄线或蓝线,只要阳线收盘价格在慢线上方,慢线为红线时就可以做多进场;当快线在慢线上方,阳线收盘价格在慢线上方,但慢线为绿线时,则不进场
做空信号: 当快线下穿
Learn how to purchase a trading robot from the MetaTrader Market, the store of application for the MetaTrader platform.
The MQL5.community Payment System supports transactions via PayPal, bank cards and popular payment systems. We strongly recommend that you test the trading robot before buying, for a better customer experience.
You are missing trading opportunities:
- Free trading apps
- Over 8,000 signals for copying
- Economic news for exploring financial markets
Registration
Log in
If you do not have an account, please register
Allow the use of cookies to log in to the MQL5.com website.
Please enable the necessary setting in your browser, otherwise you will not be able to log in.