RSI Lesson - Trend Follow/Confirming Applications
The signal of overbought and oversold based on 30 and 70 are weak but
can be enhanced but a divergence setup. Even this can extend further.
Perhaps we should look at other approaches of using the RSI, namely the
opposite.
Instead of monitoring the RSI as a range trading tool,
why not look at it as a trend following tool. If the market shows
abundant examples of trend continuing after a show of OB/OS signal maybe
we should examine the trend following applications.
There are 2
advanced signals that they don't teach in the basics of RSI. I first
encountered these techniques in the "Technical Analysis for the Trading
Professional" by Constance Brown. She credits much of her knowledge to
Andrew Cardwell who is a modern day guru of this technical indicator.
We
had previously mentioned that when you think about when the RSI is
above 70, showing overbought conditions, it is also showing bullish
momentum, so in the right context, it it a bullish signal. (The right
context meaning basically that it is not always going to be a bullish
signal.) However, if you witness multiple failures, and then a quick
attempt, it is sometimes considered a "pop". The RSI pop is something we
can investigate closer, but the point is that the overbought condition
sometimes suggest only a temporary pause, but signals further intent.
There are another 2 signals that help confirm the trend.
1)
A healthy bullish trend should be confirmed by the 14-period RSI
staying above the 40 level. Vice versa, a healthy bearish trend should
keep the RSI below 60.
2) After a bullish trend is established, a
positive reversal signal occurs when the RSI makes a lower low, but the
corresponding price low does not. This suggests another swing and we
can use a swing projection.
Beyond Frustrated With Ichimoku!
This video discusses the mentality of traders after losing trades and also about understanding the structure of the market.
Forum on trading, automated trading systems and testing trading strategies
Something Interesting in Financial Video September 2014
Sergey Golubev, 2014.09.22 12:09
Introduction to the
Central Bank Gold Agreement
This video explores the Central Bank Gold Agreement, and its role in current
international monetary policy.
Forum on trading, automated trading systems and testing trading strategies
Something Interesting in Financial Video August 2013
Sergey Golubev, 2013.08.05 09:52
61. Why Markets Move Ahead of Interest Rate AnnouncementsA lesson on how markets and traders anticipate interest rate changes for stock, futures and forex traders.
In our last lesson we looked at how The Fed is expected to react at different points in the business cycle, and what the expected market movement will be as a result. In today's lesson we are going to look at how the Fed goes about signaling to the market changes in their thinking on the direction of monetary policy, so we can begin to understand why markets react not only to Fed interest rate announcements but just as importantly to events which change the markets anticipation of how the Fed may react.
While we have simplified the situation in order to better understand the basics of how The Fed uses monetary policy, as you can probably tell by now, forecasting economic conditions and using monetary policy to try and manage those conditions is a very difficult process. The members of the FOMC are constantly analyzing economic data from across the country to try and gauge where the economy is in the business cycle and what if any monetary policy action is needed.
As we have touched on in previous lessons, the FOMC has 8 regularly scheduled meetings throughout the year where they meet to discuss current economic conditions and expectations of future conditions. It is at these meetings that decisions on what changes if any in monetary policy need to be made.
As we've learned in previous lessons, what the FOMC decides to do with their target for Fed Funds Rate at this meeting has wide ramifications for the economy and therefore the markets. With this in mind the results of these meetings are closely followed by market participants. It is important to understand however that the market not only looks for whether or not the FOMC takes action on the Fed Funds Rate and by how much, but also for any clues in the Fed's Statement as to what their bias may be for future rate decisions.
This is a very key point to understand because the markets are always trying to anticipate what is going to happen and therefore they move up and down depending on what people think will happen to rates going forward. Anything that comes out from this meeting or any thing else that is in line with what the market expects should have little or no effect on the market. Conversely anything that comes out which changes the markets forecasts on what if any Fed action will be, can cause drastic moves in the markets as participants react to this new information and markets adjust accordingly.
Forum on trading, automated trading systems and testing trading strategies
Something Interesting in Financial Video February 2014
Sergey Golubev, 2014.02.10 11:15
06: DURABLE GOODS
This is the 6th video in a series on economic reports created for all markets, or for those who simply have an interest in economics. In this lesson we cover the Durable Goods report.
============
Previous parts:
- 01: NON FARM PAYROLL (Part 1) - ECONOMIC REPORTS FOR ALL MARKETS
- 02: NON FARM PAYROLL (Part 2)- ECONOMIC REPORTS FOR ALL MARKETS
- 03: TWO MORE UNEMPLOYMENT REPORTS
- 04: PRODUCER PRICE INDEX
- 05: ISM MANUFACTURING
============
Durable Goods OrdersDurable Goods Orders (DGO) is an indicator of orders placed for relatively long lasting goods. Durable goods are expected to last more than three years, e.g.: cars, furniture, appliances, etc.
This indicator is important for the market because it gives an idea of the consumers' confidence in the current economic situation. Since durable goods are expensive, the increase in the number of orders for them shows the willingness of consumers to spend their money on them. Thus, the growth of this indicator is a positive factor for economic development and leads to growth of the national currency.
- Release Frequency: monthly.
- Release Schedule: 08:30 EST, the fourth week.
- Source: U.S. Census Bureau of the Department of Commerce.
============
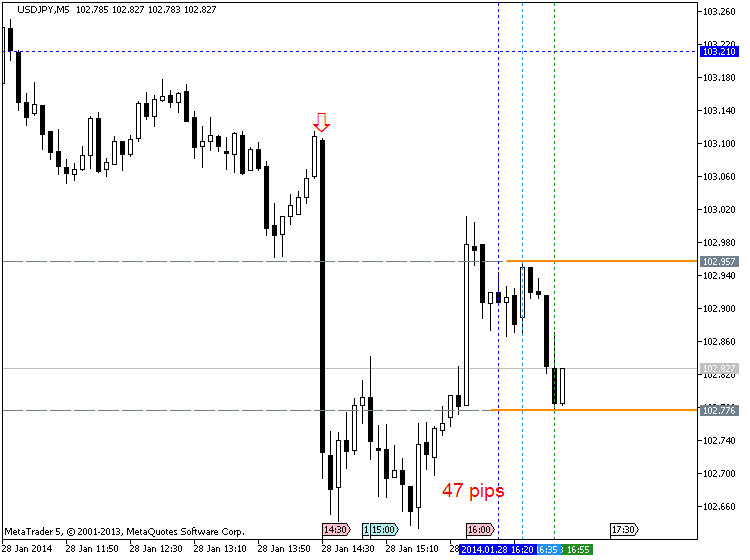
USDJPY M5 : 47 pips price movement by USD - Durable Goods Orders news event

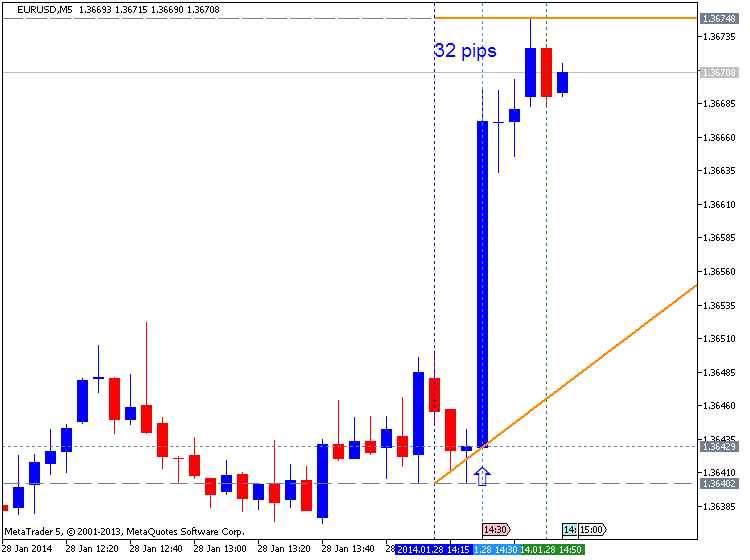
EURUSD M5 : 32 pips price movement by USD - Durable Goods Orders news event :

Forum on trading, automated trading systems and testing trading strategies
Something Interesting in Forex Video May 2013
Sergey Golubev, 2013.05.11 07:32
This is 40 minute webinar about the following: Gold, Crude, Russell with price action trading. John Paul explained how to use price action when trading news events.
Forum on trading, automated trading systems and testing trading strategies
Something Interesting in Financial Video November 2013
Sergey Golubev, 2013.11.07 08:41
Candlestick Charting - Bullish Engulfing Pattern
Bullish Harami Candlestick Chart Pattern - Description & Charting Example
The bullish harami suggests a reversal after a downtrend. Video explanation with candlestick chart examples, "blended candle" analysis, and trading details.
Next Week Trading Video: A rapid rebound in equities and drop in volatility measures should draw suspicion
- "Over the past weeks, fear has subsided and
risk appetite has recovered lost ground. However, opportunity and the
fear of missing out (FOMO) in a rebound shouldn't cloud our appreciation
of the market's broader condition."
- "In fundamentals, the curb on Fed
rate hikes has distracted from ineffective accommodative policy
globally. A lull in data has taken the general slowdown in global growth
off the top headlines."
- "And, a rebound in capital market benchmarks
papers over genuine concerns of liquidity, debt and exposure."
- "Since we
so frequently cover the fundamentals, this weekend Strategy Video focus
more on the technical side of the 'short-term cheer, long-term concern'
contrast."
- "Where we have certainly seen a rebound in the SPX
and drop from the VIX volatility index - indicative of improved
sentiment - in the short-term, the general conditions with which this is
occurring suggest it is mounted on unstable foundation."
- Free trading apps
- Over 8,000 signals for copying
- Economic news for exploring financial markets
You agree to website policy and terms of use
Please upload forex video you consider as interesting one. No direct advertising and no offtopic please.
The comments without video will be deleted.