Forum on trading, automated trading systems and testing trading strategies
Something Interesting in Financial Video May 2015
Sergey Golubev, 2015.04.29 11:36
Introduction to Forex Price Action Trading
- What is price action trading?
- The basics of reading charts
- Support and resistance
- Basic set-ups and stop placement
- Two examples of trades from the forex market
What is Price Action?
Price action is a particular methodology employed by traders, based on the observation and interpretation of price action, usually through the use of candlestick or bar charts. The price action style of trading is usually characterized by clean charts, without indicators, with the explanation that indicators are themselves interpretations of the historical movements of price, which don't contain any information or predictive power that isn't available from the charts themselves. Nonetheless, some traders include basic indicators, such as exponential moving averages or average true range to augment their charts or to provide confluence. The attitude of the price action trader is that the interpretation of price movements can provide an edge, a possibility of being more right than wrong in their predictions about the future behavior of price.
The basics of reading candles and charts
Since candlestick and bar charts are the fundamental interface of the price action trader, the most basic unit is the candle or bar itself. Candles sum up the price action over a set period of time: on a 5 minute chart, each candle represents 5 minutes of price behavior, whereas on a daily chart, only one candle is produced per day. The body of the candle constitutes the range between the open price and close price, whereas the wicks or shadows of the candle indicate the high and low over that period of trading. Various color schemes are used to determine whether the price movement represented by the candle is bullish (increasing in price) or bearish (decreasing in price); bullish candles are usually white, blue, or green, whereas bearish candles are usually black or red.
- Longer candle bodies demonstrate strong momentum and decisive market behavior in the movement from open to close; longer shadows, however, demonstrate increased volatility, since some prices were reached during the time period but ultimately excluded from the range between open and close.
- Smaller candles can indicate the market's indecision, disinterest, or a balance between bullish and bearish forces.
Support and resistance lines are typically horizontal, but when they are diagonal along a trend they are known as trend lines. The basic idea behind using support and resistance effectively in a trading range is to buy at the support level and sell at resistance in an uptrend, or to sell at resistance and buy at support in a downtrend; so, we're not necessarily hoping for a break-out through the established levels, because a break-out means that the market isn't behaving predictably enough to allow for safe bets on its future performance. Instead, the most conservative or reliable trades are those that occur as the market fluctuates between identifiable support and resistance levels, allowing you, in an uptrend, to buy when a retracement of bearish leg has brought prices down to a support level, and then sell when price returns to the resistance level, or, in a downtrend, to sell when price is maxed out at a reliable resistance level. The reason we are looking to buy in an uptrend and sell in a downtrend is that price action trading is all about playing the odds, so trading with the trend rather than against it is usually a better idea since a trend is statistically more likely to continue than to reverse.
Basic Set-ups and Stop Placement
Most price action traders place buy or sell stop orders with a
pre-determined stop loss level, and a take profit or target level. The
buy or sell stop sets the level that price much reach for the order to
be filled; the stop loss level sets the margin of loss that a trader
will accept before closing the position; the take profit level sets the
level at which to automatically close a successful position. The buy or sell stop, or entry level, is typically set at a significant
support or resistance level so that it will only be filled when price
has broken definitively in the desired direction; by setting strategic
entry levels in their orders, traders can ensure that they enter trades
with the momentum of the market.
Forum on trading, automated trading systems and testing trading strategies
Something Interesting in Financial Video May 2014
Sergey Golubev, 2014.05.22 10:30
Strategy Video: Strategy For Low and Extreme Volatility Conditions
- The VIX Volatility Index slipped below 12% for only the third time in the past 7 years
- Activity levels in the FX and other financial markets are equally extreme
- While these exceptional conditions will eventually reverse, we should think of more timely strategies
Volatility readings slid to extreme lows this past session - implying a correction in activity levels and markets may soon be at hand. From the equities-based VIX, a slide between 12 percent draws us to levels only seen two other times in the past seven years. Readings in FX and other financial assets have sported similar elevations. Our natural inclination is to project a reversal to match the magnitude of our current extremes. However, that eventual systemic change may take time and numerous false starts. There are more immediate opportunities for oscillations in activity levels. We look at this situation from a short, medium and long-term perspective while also highlighting the different trade options through the scale in today's Strategy Video.
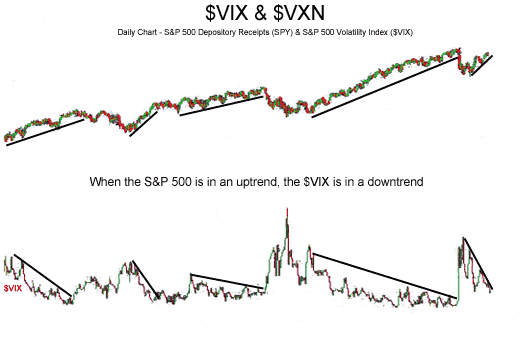
The $VIX is the 30-day annualized implied volatility of the S&P 500 Index Options. In addition, the $VXN is the 30-day annualized implied volatility of the Nasdaq 100 Index Options. When markets crash or move downward quickly, put options become popular. Traders bid up the price of these put options, which manifests itself as an increase in the implied volatility level; thus an increase in the $VIX and $VXN index. The basic relationship between stock and index prices and the $VIX and $VXN is presented next:
- When prices fall, the $VIX and $VXN Indexes rise.
- In contrast, when prices rise, the $VIX and $VXN Indexes fall.
This basic relationship is summed up by a famous traders' saying: "When the VIX is high it's time to buy; when the VIX is low it's time to go."
The following chart of the S&P 500 exchange traded fund (SPY), top half
of chart, shows the inverse relationship between it and the $VIX Volatility
Index, bottom half of chart:
Notice how an uptrend in the price of the S&P 500 is accompanied by a downtrend in the level of the $VIX.
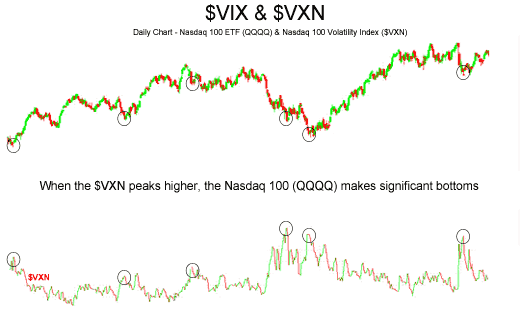
The next chart of the Nasdaq 100 exchange traded fund (QQQQ) shows how great
buying opportunities are when the $VXN spikes higher:
When the $VIX or $VXN spike (usually they both spike during the same periods) buy. If history repeats itself, which it has done often, buying $VIX and $VXN spikes has proven quite profitable. Nevertheless, the Mutual Fund mantra applies: "Past performance is not indicative of future performance".
The trend of the $VIX and $VXN Indexes can add another helpful level of analysis to price and volume indicators. A technical indicator that might be of interest is the Volatility indicatorForum on trading, automated trading systems and testing trading strategies
Something Interesting in Financial Video October 2013
Sergey Golubev, 2013.09.30 11:19
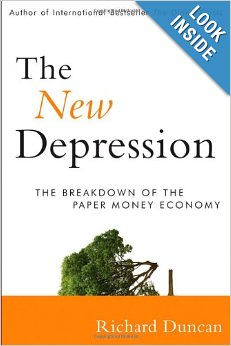
Interview With Richard Duncan, Author of The New Depression
==========
Richard Duncan's web site: http://www.richardduncaneconomics.com
Richard Duncan is author of the following book :
The New Depression: The Breakdown of the Pap
When the United States stopped backing dollars with gold in 1968, the nature of money changed. All previous constraints on money and credit creation were removed and a new economic paradigm took shape. Economic growth ceased to be driven by capital accumulation and investment as it had been since before the Industrial Revolution. Instead, credit creation and consumption began to drive the economic dynamic. In The New Depression: The Breakdown of the Paper Money Economy, Richard Duncan introduces an analytical framework, The Quantity Theory of Credit, that explains all aspects of the calamity now unfolding: its causes, the rationale for the government's policy response to the crisis, what is likely to happen next, and how those developments will affect asset prices and investment portfolios.
In his previous book, The Dollar Crisis (2003), Duncan explained why a severe global economic crisis was inevitable given the flaws in the post-Bretton Woods international monetary system, and now he's back to explain what's next. The economic system that emerged following the abandonment of sound money requires credit growth to survive. Yet the private sector can bear no additional debt and the government's creditworthiness is deteriorating rapidly. Should total credit begin to contract significantly, this New Depression will become a New Great Depression, with disastrous economic and geopolitical consequences. That outcome is not inevitable, and this book describes what must be done to prevent it.
- Presents a fascinating look inside the financial crisis and how the New Depression is poised to become a New Great Depression
- Introduces a new theoretical construct, The Quantity Theory of Credit, that is the key to understanding not only the developments that led to the crisis, but also to understanding how events will play out in the years ahead
- Offers unique insights from the man who predicted the global economic breakdown
Alarming but essential reading, The New Depression explains why the global economy is teetering on the brink of falling into a deep and protracted depression, and how we can restore stability.

=========
Here's a summary of the points discussed:
1. The book starts with a discussion of fractional reserve banking,
observing the connection between debt and money and how debt and
inflation go together.
2. Richard views the current monetary system as flawed and in trouble,
but does not view a return to a gold standard of any kind as possible.
Rather, he thinks the best hope is for governments to attempt to borrow
at very low rates and invest not in consumption but in growth -- invest
in projects that will offer a high economic return. He cites investing
in a new energy grid as an example.
3. Richard does not view China dumping US Treasuries, or the world
decoupling from the dollar as a viable threat. This seems to be part of
why he believes there are a few more years left where low interest rates
are achievable.
4. In terms of investments, Richard favors real estate that can be turned into rental income. He finds public stocks to be a bit too close to the derivatives crisis, and does not think gold is immune to a severe decline if growth cannot be obtained.
Here is a very usefull video from a professional trader in 4 parts about it:
Anton Kreil
Professional Traders Vs Retail Traders 101 - Part 1
Forum on trading, automated trading systems and testing trading strategies
Forex Strategy easy and simple
shemoalaa80, 2015.06.06 22:29
Forex Strategy easy and simple
FPS Frame 1 hour
Couples the four major pairs in addition to the
Australian and Canadian
know the full strategy in the following video
Forum on trading, automated trading systems and testing trading strategies
Sergey Golubev, 2015.06.07 18:21
EUR/USD forecast for the week of June 8, 2015, Technical Analysis (based on fxempire article)
The EUR/USD pair initially rallied during the course of the week, but then pullback in order to form a massive shooting star like candle. However, we broke the top of the hammer from the previous week, and did stay above there. Because of that we feel that there is bullish pressure underneath, and that this market will continue to go higher. We have no interest in selling from a longer-term perspective, but recognize that short-term buyers will probably continue to come back into this market again and again. If we can get above the 1.15 level, we are long-term buyers.
Forum on trading, automated trading systems and testing trading strategies
Something Interesting in Financial Video January 2014
Sergey Golubev, 2013.12.31 08:44
Ichimoku - Advanced Ichimoku Strategies Additional Criteria
Forum on trading, automated trading systems and testing trading strategies
shemoalaa80, 2015.06.12 12:45
My way of trading simple for beginners Ideal for professionals
show the following video and know more about it
Forum on trading, automated trading systems and testing trading strategies
Sergey Golubev, 2015.06.14 11:02
Key Technical Levels Remain for USD-pairs as Week Ends (based on dailyfx article)
- EURUSD break through $1.1200 could mean $1.1050 next week.
- USDJPY needs to clear out ¥123.90.
"It's a much quieter day on the economic calendar, with only one event due over the next few hours that qualifies as a 'medium' or 'high' ranked event to close out the week. Instead, attention will be focused on two developing themes as the week draws to a close: the rebound in US economic data; and the negotiations surrounding Greece."
- Free trading apps
- Over 8,000 signals for copying
- Economic news for exploring financial markets
You agree to website policy and terms of use
Please upload forex video you consider as interesting one. No direct advertising and no offtopic please.
The comments without video will be deleted.