You are missing trading opportunities:
- Free trading apps
- Over 8,000 signals for copying
- Economic news for exploring financial markets
Registration
Log in
You agree to website policy and terms of use
If you do not have an account, please register
Enter the periods into the neural network.
Comparison of years
Then seasons.
Days
Hour candles (considering the change of summer/winter time)
And then you'll see a pattern in some instrument.
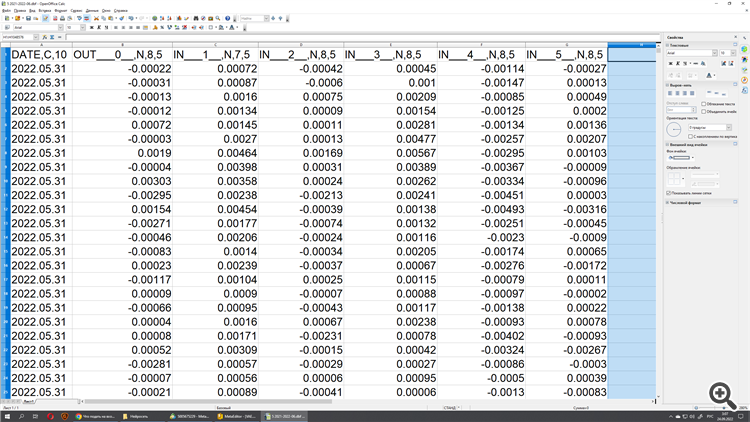
Please clarify, I have an export file like this.

How to arrange the days of the week? Separate column of the cycle?
1
2
3
4
5
1
2
3...
Or is the joke the whole post?))
This is how much forward per month we get if we train a neural network of structure 100-100-100, 3 layers of 100 neurons, for a period of one year.

And , as always, there is only one problem: it is random. Therest of the months (training every month) are either low profit, or feverish flat, or - to the bottom.
There is no something stable (a specific periodicity of training, or some knowledge that a working neural network will last another month/week).
And it would seem to be so simple: to internalise the meaning of statistics inherent in the phrase: "Garbage in - rubbish out". No, we chew and chew and fantasise, but we should just read books.
Now take MT5 optimiser and do the same thing and make sure that the result will be the same
I will tell my opinion, if anything to compare, it is the parameters of the trend waves, their size, duration, possibly speed of movement. Current parameters to the previous ones. For people on the market, significant movements and some price levels make sense.
The rest is noise. Especially the difference of candlestick prices, averaging and sliding window. And also, to retrain the system it is enough to use 10-20 coefficients for the whole available symbol history. How many weights are there in the neural network? It doesn't find patterns, it just learns all the material, and tweaking the sliders doesn't solve this problem.
Opinion is not unsubstantiated, but without claiming anything. Perhaps someone might like the idea
And it would seem to be so simple: to internalise the meaning of statistics inherent in the phrase: "Garbage in - rubbish out". No, we chew, chew, fantasise, but we should just read books.
A graph with a price is rubbish?
Please clarify, I have an export file like this
How to arrange the days of the week? Separate column of the cycle?
1
2
3
4
5
1
2
3...
Or is the joke the whole post?))
Nah, not a joke, but a challenge.
Here are the seasonal charts. Unfortunately the current year ruins the multi-year cycles.
// but if you analyse 50 years and find years close in condition, you may find cycles of repetition (6-12 years).
On days of the week - the task is to study separately PN, VT, etc. For example, advisors like happy manday use the nuances of the PN.
I saw a comparison on H1 candlesticks. For example, they show that the night hour from 00 to 01 makes no sense in Sell positions on many instruments. But these are night hours, there is a spread there.
There is also a case when at 18:00 on M5 reverse trades on BO give a winrate of more than 80% on the vast majority of instruments, but binary traders at this time cut rates and there is no profitability. And once the money was not bad.
That is, the search for vulnerabilities begins with the study of periods.
How it should be entered into a neural network I do not imagine, because I have not worked, but it is realistic to write an indicator in general.