You are missing trading opportunities:
- Free trading apps
- Over 8,000 signals for copying
- Economic news for exploring financial markets
Registration
Log in
You agree to website policy and terms of use
If you do not have an account, please register
Make predictions only on the basis of current quotes, quotes change and the forecast changes, the period is over, start a new forecast and so on to infinity...
Price movements are legitimate. You can see it in history with the unaided eye.
And the fact that not everyone can see the perspective, it is nature's way of working correctly. Not everyone is allowed to. Otherwise the market will collapse. Where will we play?
So you can determine the direction of the beam from a single point?
And I write for readers, not just forum members.
Yes, and since we can calculate the width of the channel, we get a one-point channel.
Yes, and since few people here study channels, they only know the construction from finished products).
What kind of analysis is this?
I can't figure it out.
I'd like to look at the pictures more than anything else.
;)
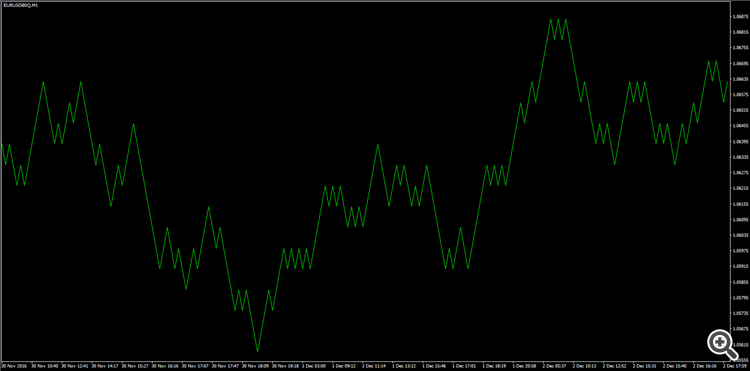
So what does a quantum graph look like?
On a large time interval, it naturally looks like a normal graph:
However, we realise it's not quite like that when we zoom in on it a little bit:

And let's enlarge it some more:And now we see that it's not quite like that at all. We can now clearly see the internal structure of the quantum chart.
We can see that the speed of price movement is constant, and only the direction of movement changes. All segments of the chart are oriented at the same angle. Ah yes, we are in a quantum world, where the speed of light is constant.
It looks very beautiful to me. It's personal, undistorted space-time of the stock price. Well, quantum time is a very special song and we'll certainly talk about it later.
hilarious
;)
Why doesn't the channel TC give a constant profit?
Simply because there are many channel systems. The variety is enormous. And you have to jump from one to the other in time. This is not easy to do with visual thinking. PBX to the rescue. But 1 in 99 peeps can program. 1 in 999 create a DC)) 7 out of 10 DCs can make money all the time. 1 in 100 banks go bankrupt or get taken over.
Sinusoid )))))))
Always has been and always will be.
So what does a quantum graph look like?
On a large time interval, it naturally looks like a normal graph:
However, we realise it's not quite like that when we zoom in on it a little bit:
And let's further enlarge:And now we see that it's not quite like that at all. We can now clearly see the internal structure of the quantum chart.
We can see that the speed of price movement is constant, and only the direction of movement changes. All segments of the chart are oriented at the same angle. Ah yes, we are in a quantum world where the speed of light is constant.
It looks very beautiful to me. It is the personal, undistorted space-time of the exchange price. Well, quantum time is a very special song and we will definitely talk about it later.
Never! I emphasise never there is a guarantee of this theory that the price will go that way. But there is a useful purpose to speculate.
Why doesn't the channel TC give a constant profit?
Simply because there are many channel systems. The variety is enormous. And you have to jump from one to the other in time. This is not easy to do with visual thinking. PBX to the rescue. But 1 in 99 peeps can program. 1 in 999 create a DC)) 7 out of 10 DCs can make money all the time. 1 in 100 banks go bankrupt or get taken over.
Sinusoid )))))))
Always has been and always will be.