You are missing trading opportunities:
- Free trading apps
- Over 8,000 signals for copying
- Economic news for exploring financial markets
Registration
Log in
You agree to website policy and terms of use
If you do not have an account, please register
Andrei, do you just want to get a picture or do you want to get a picture of MQL5?
I can easily visualise it, but there are more advanced tools for visualisation.
For example, here is your formula as it looks on this resource:
https://www.desmos.com/3d/887356da26.
oops, I made a mistake in the formula there
here is the correct formula:
https://www.desmos.com/3d/b06327c043
I'm not sure how to do it, but the surface formula is like this:
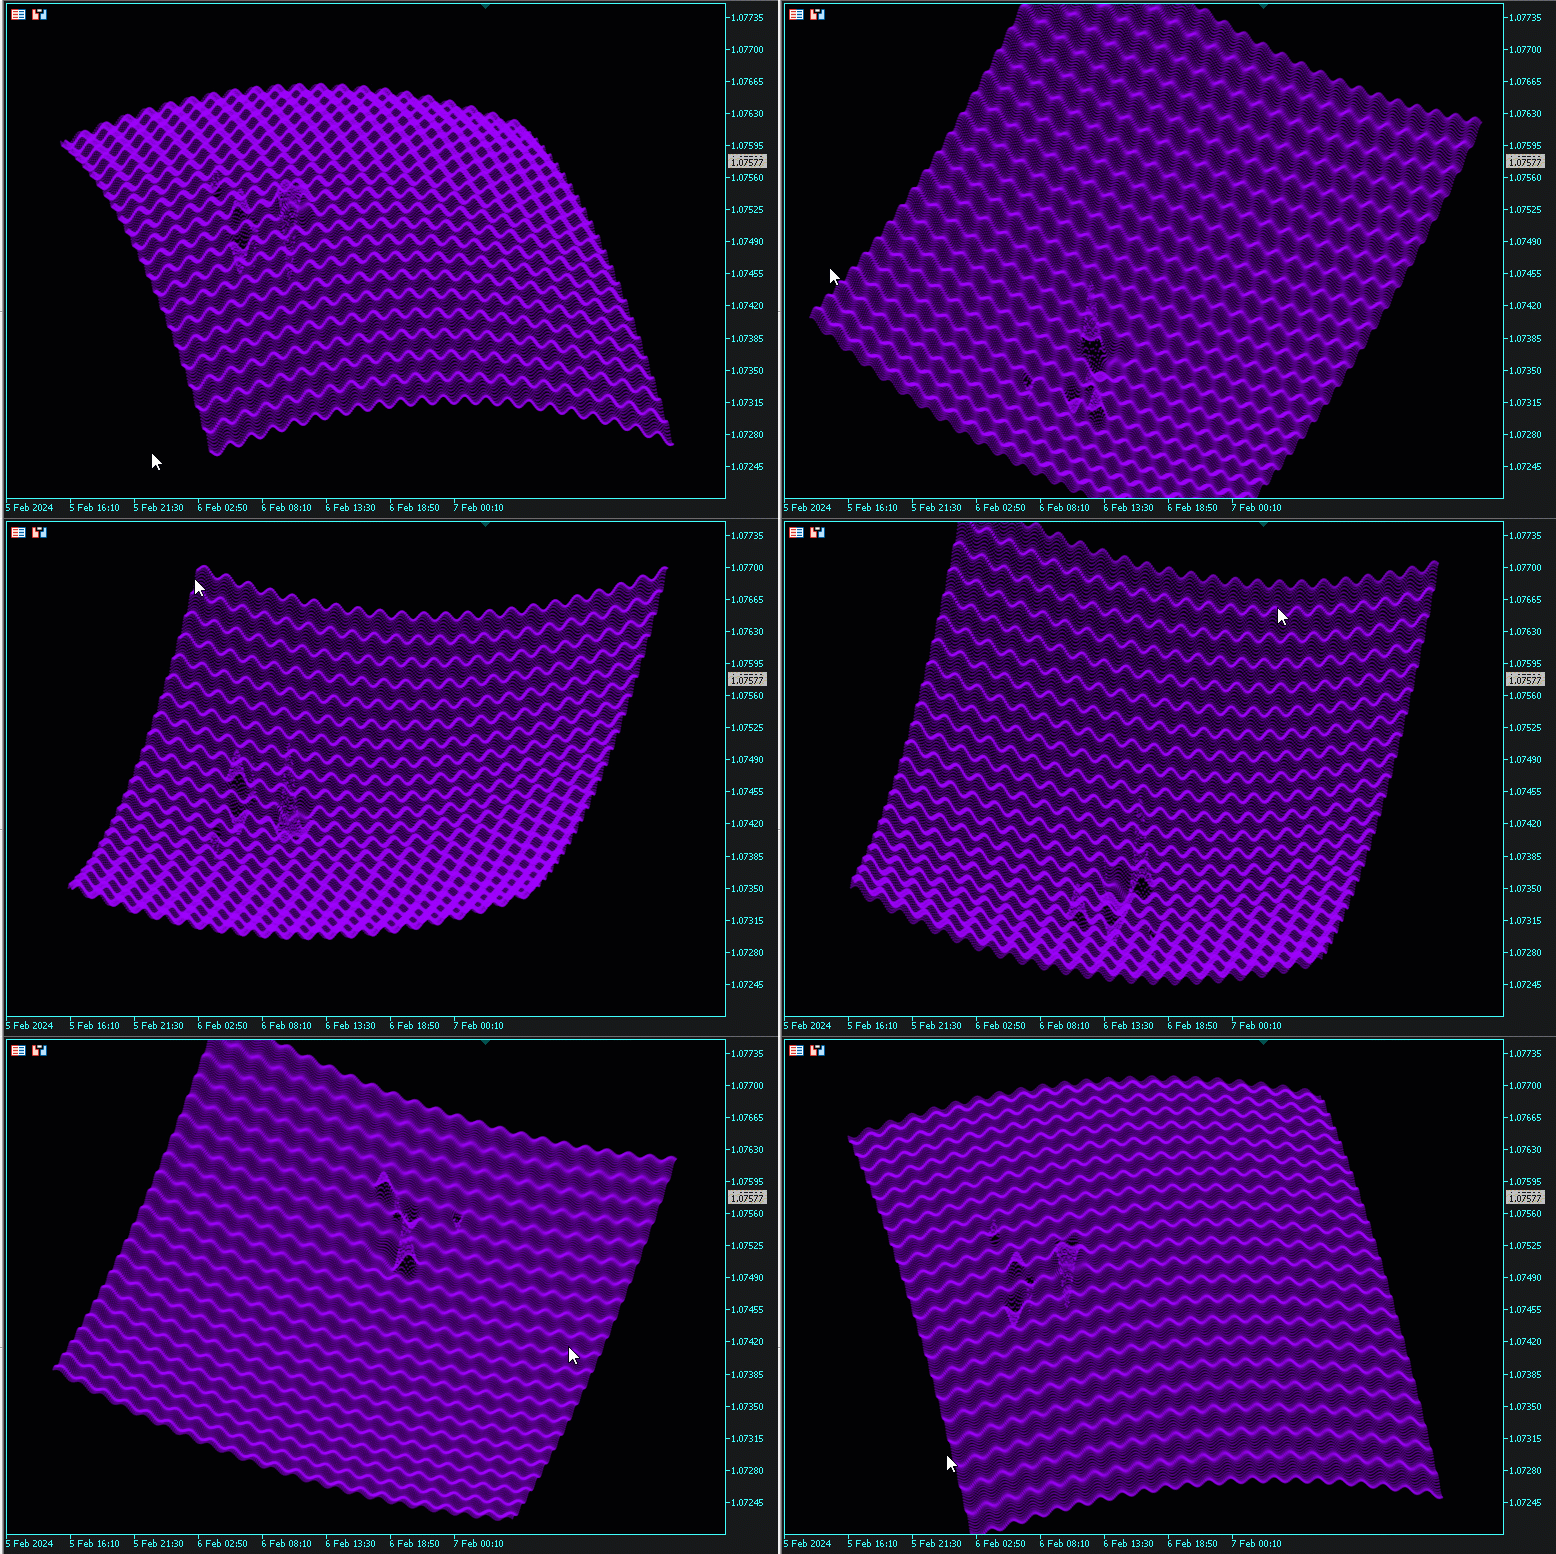
The picture is similar in MQL5
different scale:

frequency and size of points can be changed in input parameters
I have no lag even with a point matrix size of 500x500 (250 000 points).
My personal opinion is that drawing surfaces with points instead of lines and triangles has its advantages. Such as transparency and better performance. Also you can build clouds instead of surfaces.
can be drawn with a heat map depending on some coordinate.
Here's a question, I need to draw points on a surface when optimising a test function, I can't figure out how to do it.
It should be something like this:
as for the very question about the ability to draw on the surface, there is no problem either.
Add 5 lines of code and it's done:
As for the very question of being able to draw on the surface, there is no problem either.
Add 5 lines of code and you're done:
"Draw" - I meant different, programmatically build points on the surface, the points will have to "run" on the surface.
But, this ability to actually draw by hand is also a great feature.
"Draw" - I meant different, programmatically plotting points on the surface, the points would have to "run" on the surface.
It would be interesting to see the convergence paths on 3D.
It would be interesting to see the convergence paths on 3D.
It would be interesting to see the convergence paths on 3D.
"Draw" - I meant different, programmatically plotting points on the surface, the points would have to "run" on the surface.
But, this ability to actually draw by hand is also a great feature.