Sultonov differential indicator - page 16
You are missing trading opportunities:
- Free trading apps
- Over 8,000 signals for copying
- Economic news for exploring financial markets
Registration
Log in
You agree to website policy and terms of use
If you do not have an account, please register
Yes, Artem, I also, having just returned from work, discovered this unpleasant fact. It redraws its readings when you reset it. This is a result of the fact that, it includes historical data outside the calculation period, which is not correct. Please make it work only with the latest data sanctioned by the period specified in the settings and do not go beyond that towards history. Or, it remains to restart the indicator programmatically, which is not good. Let it read in that last range, which it has been prescribed. The cat, now the indicator shows the market conditions with period of 1000, but it was a mess before reinstallation, because it takes unnecessary data from the history, since the initial installation:https://www.mql5.com/ru/charts/7574577/eurusd-m1-e-global-trade
Yusuf, go to the stock exchange - there this data is given without any calculations and without any delay/overrides.
Above is the price, below is "your" indicator (delta between the lines)
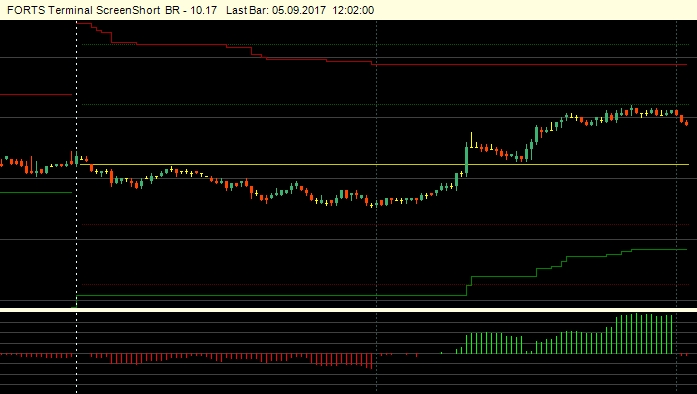
The only thing is, you can't call it by its name))You will get a sliding sum and, in the limit, an ATR over a long period
You just have to try it out and see the results. It's not difficult. And new ideas will emerge from the new results.
Your problem is that it is accumulating data from history. Now imagine if it only takes a certain number of bars to accumulate data, then with each new bar the amount of data will change, and the line will be completely redrawn with a different look.
Suppose we have data to accumulate in the amount of 10. Make a table with different values and then shift the beginning of calculation (on the left) one bar to the right, thus emulating the appearance of new bars - the beginning of calculation will also constantly shift to the right and, accordingly - with each new bar the accumulated data amount will change that will lead to changes in the appearance of the indicator line - its complete redrawing.
But after all calculations the indicator should have the same line at the output, regardless of the bar from which the calculation has been started.
As far as I understood from the previous one, the indicator simply gives cumulative sums of increments of different directions. The results can be improved by introducing a "forgetting" operator, which slowly reduces to zero the old irrelevant values.
Yusuf, go to the stock exchange - there this data is given without any calculations and without any delay/overrides.
Price at the top, "your" indicator at the bottom (delta between the lines)
The only thing I can't give my name to))That wasn't the question, it was about their algorithms.
As far as I understood from the previous one, the indicator simply gives cumulative sums of increments of different directions. You can improve the results by introducing a "forgetting" operator for the old history, which slowly reduces the old irrelevant values to zero.
I do not pretend to develop someone else's work, but I try not to miss my own, if possible. My developments on "Cauchy difference", "Geometric moving average", "Moving average with fading period calculation in proportion 1/N" (I do not remember the name exactly) placed in kodobase with others' priorities. Haven't I had enough? Why does it make everyone cringe?
You have missed the main point: instead of looking for a black cat (in semi-synthetic forex quotes) it is suggested that your analytical mind be used for its intended purpose - on a real exchange with a much larger and more diverse flow of information, apart from the price.
Personally, I am not offended by any of your ideas. Why do you think so? It's just a pity when such a mind goes to waste. This is all an IMHO opinion, of course.
And this is a continuation of the "banquet":
Oleg, the problem is not worth a damn. Is it difficult to assign in the code to take for calculations only the last N bars of history, than to bother with "forgetting"?
Yusuf, you don't see the problem, so it's not really there for you. But it is there. "Take only the last N bars of history" is not difficult, but that is not the problem.
If at each bar (which you have every minute) "take for calculations only the last N bars of history", each time the reference point will change, and therefore the indicator lines on each bar will show values relative to this new reference point. That is, the whole picture will change on every bar.
Try it and you will see.
You have not understood the main point: instead of looking for a black cat (in semi-synthetic forex quotes) it is suggested to apply your analytical mind to the real exchange with a much larger and more diverse information flow, apart from the price.
Personally I am not confused by your ideas. Why do you think so? It's just a pity when such an intelligence goes to waste. All this is IMHO, of course.
And this is a continuation of the "banquet":