[ARCHIVE]Any rookie question, so as not to clutter up the forum. Professionals, don't pass it by. Can't go anywhere without you - 5. - page 106
You are missing trading opportunities:
- Free trading apps
- Over 8,000 signals for copying
- Economic news for exploring financial markets
Registration
Log in
You agree to website policy and terms of use
If you do not have an account, please register
Good day to you all!
Could you please tell me how to draw a segment on a graph, with an example if possible.
See
P.S.
For example, you look at a past low trend on the chart and see that towards the edge of the chart it shifts even lower out of the window. You scroll down the chart to the future and watch as the chart shifts automatically upwards, freeing up space to view the candles of the underlying chart. And what was previously visible at the top of the chart window is now moved even higher, out of the chart window. This is the implementation of a logarithmic price scale on the chart. If it did not exist, you would have to scroll the chart not only right-left, but also up and down. That is why the time scale is linear and the price scale is logarithmic, in order to display the data in the chart window easily.
In the past, when computers were unavailable, traders used a millimeter chart and plotted prices on it for predicting trends and turning points. Therefore, there were two scales on paper - price and time. These are two linear scales. Can you imagine how big a sheet of millimetre paper would have to be to contain all the fifteen-minute candlesticks of the last year? Surely it would be as big as the wall of a room (if not bigger). So, when you are scrolling the chart on the screen, you can imagine this model: a candlestick chart of prices is drawn on the wall. There is also a rectangular (e.g. red) frame - it is your monitor. Moving along the chart is nothing more than moving this red rectangle along the trend. But then you would say that both scales in your monitor are linear. This is true, but only partially - notice that when scrolling the chart, the candle that was big (visually perceived as big) becomes smaller after a slight shift, although if we measure the distance between its extremums, the number of points remains the same.
Look, here are 2 screenshots of the same chart. The first screenshot is just a screenshot. The second is a screenshot of the same screen but after spinning the mouse wheel one click, the chart has shifted back a few candles. Take a piece of paper, attach it to the first screenshot and mark high and low prices of the candle marked in red. Then move the marked risks to the same candle in the second screenshot. You will understand what we're talking about and what a shift on a logarithmic scale is (what is the essence of the uneven use of scales here).
And why would you want to get into the nuances of logarithmic scales? What were you hoping to find in them?
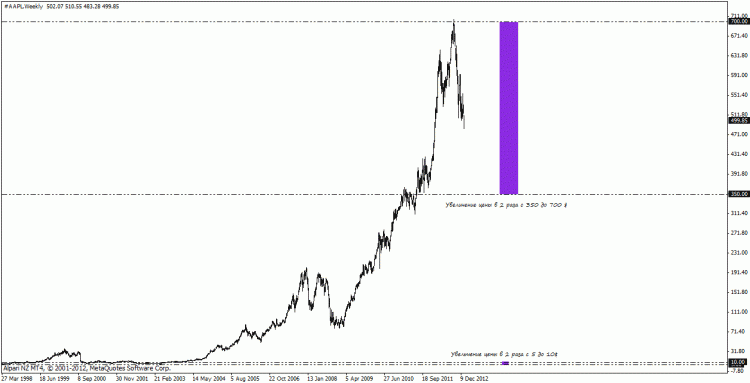
Thank you for your reply. The vertical distance on the logarithmic scale when the price changes from 2 to 4 is the same as when it changes from 20 to 40, because it reflects a doubling of the price value (from Kahn's book "Technical Analysis") I looked at the Apple chart in MetaTrader - the result is in the picture:
.
I need the logarithmic scale to analyse long term charts
Good day to you all!
Could you please tell me how to draw a line segment on a graph, with an example if possible.
(Well, it's like this)))
So there you go)))
it's a ray first, not a segment...i must have phrased my question wrong...i'm interested in how to draw a horizontal segment using program code
it's a ray first, not a line segment...i must have phrased my question wrong...i'm interested in how to draw a horizontal line segment using program code
label name of the line as you want
time x1 time 1 coordinates
time x2 time 2 coordinates
y 1, y 2 the price of those coefficients
https://www.mql4.com/files/MQl4BookRussian.chm here is the help from kovalev
it's a ray first, not a line...I must have phrased my question wrong...I'm interested in how to draw a horizontal line segment using program code
it is a line segment)))) If there was a tick in the checkbox, there would be a ray... As for the wording, the question and the answer. With an example ;-)
label any line name you want
time x1 time 1 coordinates
time x2 time 2 coordinates
y 1, y 2 price of those coordinates
https://www.mql4.com/files/MQl4BookRussian.chm here help from kovalev
beam
you get a ray.
delete the last two zeros in the code.
........ yes, if it's followed by a stopper like
then close it with this icon //
a ray is obtained.
Use ObjectSet() to set OBJPROP_RAY to false.