Rationale for the existence of support lines
As I was writing this post, from the same channel, the price reflected again:
where have you been https://forum.mql4.com/ru/34715
Channels with super accuracy on history can be found on SB as well. Why the hell would I want to engage in self-deception. So I built a channel and only watch the current price.
I too am puzzling over a similar question at the moment. I've tested it on the story more than once. Yes, there are beautiful moments. But in my opinion it's a coincidence. I just don't see any logical reasoning why price should bounce off it.
Although there are whole systems built on trading in the channel.
So it's just a coincidence that the first time I built two lines from scratch, it turned out that the future price was reflected from them 5 and 3 times with excellent accuracy?
And the upper line was drawn on a very shallow price movement.
Channels with super accuracy on history can be found on SB as well. Why the hell would I want to engage in self-deception. That's why I built a channel and only watch the current price.
The simplest method of drawing support lines that came to mind:
- We have the outermost 100 bottom tops.
- We start to go through all possible combinations of these nodes and build MNC lines.
- Each such line will have a different MNC value.
- Obviously the lowest (zero) OLS will be for lines based on two points, so we drop these variants.
- We want the line with the lowest Alpha = MPC / F(number of plotted points). Where F(x) = x^n or F(x) = e^x or F(x) = log(x) - we need to see.
- Free trading apps
- Over 8,000 signals for copying
- Economic news for exploring financial markets
You agree to website policy and terms of use
I don't believe in support lines. You can see them even where they don't exist - SB (random wandering). To see them is to build on history.
But "believe" is not an approach. That is why I decided to conduct a dumb experiment: build a channel and see how the future price will behave near the edges of this channel.
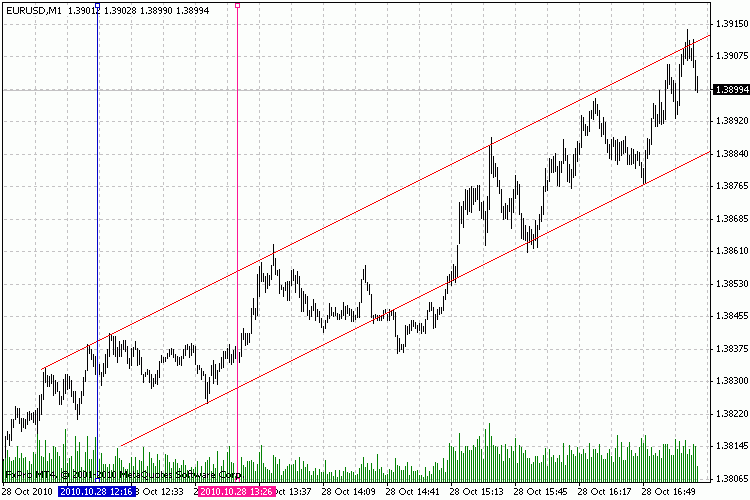
Here is the drawing picture:
The upper line was plotted at the point in time, which is marked with a blue vertical line. The bottom line was drawn with a pink line.
Man, I don't get it, what kind of bullshit is this?! Why is this bastard price bouncing off a channel that was stupidly built in the past!
Is it a coincidence or a pattern? Is it a coincidence that price has bounced 4 times from the upper boundary and 3 times from the parallel lower boundary with jewel-like precision?
Who has any thoughts on methods for analysing these kinds of coincidences?