I will write the indicator for free - page 101
You are missing trading opportunities:
- Free trading apps
- Over 8,000 signals for copying
- Economic news for exploring financial markets
Registration
Log in
You agree to website policy and terms of use
If you do not have an account, please register
Excel.
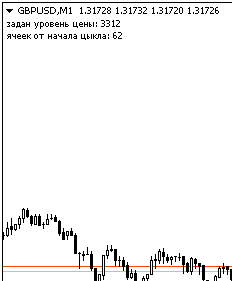
wrote a formula to determine the number of cells from the beginning of the cycle, need to check
set the price level in the settings
I have sent you the file in a messageright ?
Great! Can I get the source code for the test?
I can only email the compiled one to you, you can't delete it here
sent
Good day, dear programmers, I need an indicator to identify pivot points according to Larry Williams. The essence of the indicator:
The indicator should draw lines from the extremums from the highs to the lows and vice versa like ZigZag.
The short-term maximum (Kmax) - this is the maximum of the bar (high) on both sides of which the highs are lower (similar to a fractal, but 3 bars are involved here)
Short-term low (Kmin) - this is the minimum of the bar (low) on both sides of which the lows are higher.
Short-term high (Cmax) is a short-term high (Kmax) on both sides of which the short-term highs are lower.
A mid-term low (Cmin) is a short-term low(Kmin) on both sides of which the short-term lows are higher.
A long term maximum (Dmax) is a medium term maximum (Cmax) on both sides of which the medium term highs are lower.
Long-term low (Dmin) is the medium-term low (Cmin) on either side of which the medium-term lows are higher.
Important conditions: the market moves from maximum to minimum and vice versa, i.e., for example, there can't be two consecutive maximums and then a minimum. From high to low, from low to high, etc.
There is also the notion of an inside bar - it is a bar where highs (high) and lows (low) are situated inside the previous one and in such a situation such a pattern is considered an extremum if it is confirmed. To confirm the pattern in the example with a short-term high, the price should fall lower than the low of the bar we consider a short-term high. Everything with a short-term low is also in the mirror image. We ignore this pattern if the price in the example with the short-term high was higher than the (high) bar, which we consider as the short-term high.
The following parameters are required in the indicator: it is necessary that each extremum is highlighted with a different colour according to the hierarchy (Kmin,Kmax-Cmin,Cmax-Dmin,Dmax) and also the line width for these extrema should be set differently.
Good day, dear programmers, I need an indicator to identify pivot points according to Larry Williams. The essence of the indicator:
The indicator should draw lines on the extrema from the highs to the lows and vice versa like ZigZag.
The short-term maximum (Kmax) - this is the maximum of the bar (high) on both sides of which the highs are lower (similar to a fractal, but 3 bars are involved here)
Short-term low (Kmin) - this is the minimum of the bar (low) on both sides of which the lows are higher.
Short-term high (Cmax) is a short-term high (Kmax) on both sides of which the short-term highs are lower.
A mid-term low (Cmin) is a short-term low(Kmin) which both sides of the short-term lows are higher.
A long term maximum (Dmax) is a medium term maximum (Cmax) on both sides of which the medium term highs are lower.
Long-term low (Dmin) is the medium-term low (Cmin) on either side of which the medium-term lows are higher.
Important conditions: the market moves from maximum to minimum and vice versa, i.e., for example, there can't be two consecutive maximums and then a minimum. From high to low, from low to high, etc.
There is also the notion of an inside bar - it is a bar the highs (high) and lows (low) of which are within the previous one. In such a situation such a pattern is considered an extremum if it is confirmed. To confirm the pattern in the example with a short-term high, the price should fall lower than the low of the bar we consider a short-term high. Everything with a short-term low is also in the mirror image. We ignore this pattern if the price in the example with the short-term high was higher than the (high) bar, which we consider as the short-term high.
The indicator needs the following parameters: Each extremum should be highlighted in a different colour according to the hierarchy (Kmin, Kmax-Cmin, Cmax-Dmin, Dmax) and also the thickness of the lines for these extrema should be set differently.
Something you do not understand well. In the short extrema, yes, they alternate, but the pattern of highs and lows in the short and medium term is not correlated; there may be many highs at the top of the medium term and few lows at the bottom. If we show a channel, there will be a saw-tooth of short-term highs and lows evenly spaced, one higher than the other and there will be no medium-term highs and lows at the bottom. The adviser one does not write to the files, the other does.
I have an idea, I can't write it down.
What is this? What is "volume"? What is a "signal"?
What is it? What is "volume" What is "signal"?
Maybe I'm calling them wrong, it's a volume value
is the value of the signal.
The attached image shows this clearly in the graph