Join our fan page
- Views:
- 26202
- Rating:
- Published:
- 2012.01.11 13:47
- Updated:
- 2023.03.29 13:43
-
Need a robot or indicator based on this code? Order it on Freelance Go to Freelance
Daryl Guppy is a professional trader and author of "Trend Trading", "Trading Tactics" and "Better Stock Trading: Money and Risk Management". He leads seminars on trading in Australia, Asia, China and USA.
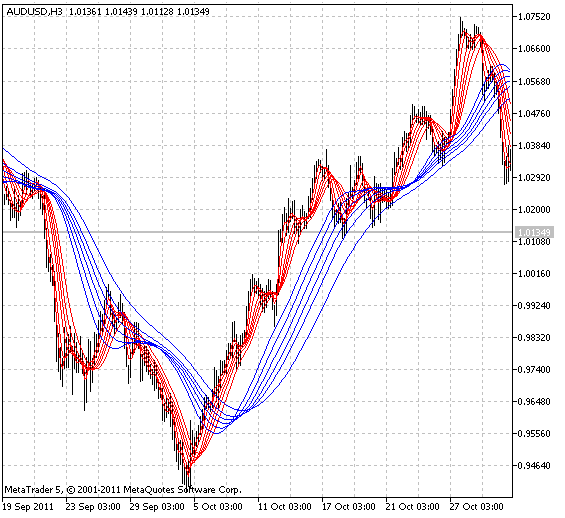
Guppy Multiple Moving Average (GMMA) is an indicator based on the relationships between groups of moving averages. Each group of moving averages in GMMA indicator provides insight into the behavior of two dominant market groups - traders and investors. This indicator allows a trader to understand market relationships shown on the chart and thus choose the most appropriate trading methods and tools. GMMA indicator is designed to understand the nature of the trend movement on a daily or intraday basis.
Implied traders activity is tracked by using a group of short-term moving averages. Traders always start a trend change. Their actions push prices upwards in anticipation of a trend change from downward to upward one. Their activity is displayed in a group of 3-, 5-, 8-, 10-, 12- and 15-period exponential moving averages.
The trend continues, only if other buyers also enter the market. Strong trends are supported by long-term investors. Investors require more time to recognize a trend change, but they always follow the traders. We track the implied investors activity, using a group of long-term moving averages. This group includes 30-, 35-, 40-, 45-, 50- and 60-period exponential moving averages.
GMMA indicator used in six trading situations:
- Standard trend breakouts;
- Joining the trend;
- Using price weakness;
- Rally and trend brekout;
- Choosing the best exit;
- Trading bubbles.
Smoothing algorithms can be selected out of ten possible versions:
- SMA - simple moving average;
- EMA - exponential moving average;
- SMMA - smoothed moving average;
- LWMA - linear weighted moving average;
- JJMA - JMA adaptive average;
- JurX - ultralinear smoothing;
- ParMA - parabolic smoothing;
- T3 - Tillson's multiple exponential smoothing;
- VIDYA - smoothing with the use of Tushar Chande's algorithm;
- AMA - smoothing with the use of Perry Kaufman's algorithm.
It should be noted that Phase1 and Phase2 parameters have completely different meaning for different smoothing algorithms. For JMA it is an external Phase variable changing from -100 to +100. For T3 it is a smoothing ratio multiplied by 100 for better visualization, for VIDYA it is a CMO oscillator period and for AMA it is a slow EMA period. In other algorithms these parameters do not affect smoothing. For AMA fast EMA period is a fixed value and is equal to 2 by default. The ratio of raising to the power is also equal to 2 for AMA.
The indicator uses SmoothAlgorithms.mqh library classes (must be copied to the terminal_data_folder\MQL5\Include). The use of the classes was thoroughly described in the article "Averaging Price Series for Intermediate Calculations Without Using Additional Buffers".

Indicator input parameters:
//+-----------------------------------+
//|  Indicator input parameters       |
//+-----------------------------------+
input Smooth_Method xMA_Method=MODE_EMA; // Averaging method
input int TrLength1=3;   // 1 trader averaging period
input int TrLength2=5;   // 2 trader averaging period
input int TrLength3=8;   // 3 trader averaging period
input int TrLength4=10;  // 4 trader averaging period
input int TrLength5=12;  // 5 trader averaging period
input int TrLength6=15;  // 6 trader averaging period

input int InvLength1=30; // 1 investor averaging period
input int InvLength2=35; // 2 investor averaging period
input int InvLength3=40; // 3 investor averaging period
input int InvLength4=45; // 4 investor averaging period
input int InvLength5=50; // 5 investor averaging period
input int InvLength6=60; // 6 investor averaging period

input int xPhase=100;                 // Smoothing parameter
input Applied_price_ IPC=PRICE_CLOSE; // Price constant
input int Shift=0;                    // Horizontal shift of the indicator in bars
Translated from Russian by MetaQuotes Ltd.
Original code: https://www.mql5.com/ru/code/692
 Parabolic_HTF_Signal
Parabolic_HTF_Signal shows a trend direction or a signal for performing a deal generated by Color_Parabolic indicator at the chosen bar as a graphic object with colored trend indication or deal direction and sends alerts or audio signals in case of a market entry moment.
 IncMomentumOnArray
CMomentumOnArray class is designed for calculation of Momentum values on indicator buffers. Test_MomentumOnArray indicator is provided as the example of the class use.
 IncADOnArray
CADOnArray class is designed for calculation of AD (Accumulation Distribution, A/D) values on indicator buffers. Test_ADOnArray indicator is provided as the example of the class use.
 XMA-XN
The fan of hundred XMA moving averages with the possibility to change the number of lines on a chart and select a smoothing method out of ten possible versions.