Join our fan page
- Views:
- 3653
- Rating:
- Published:
- 2012.01.11 13:47
- Updated:
- 2016.11.22 07:32
-
Need a robot or indicator based on this code? Order it on Freelance Go to Freelance
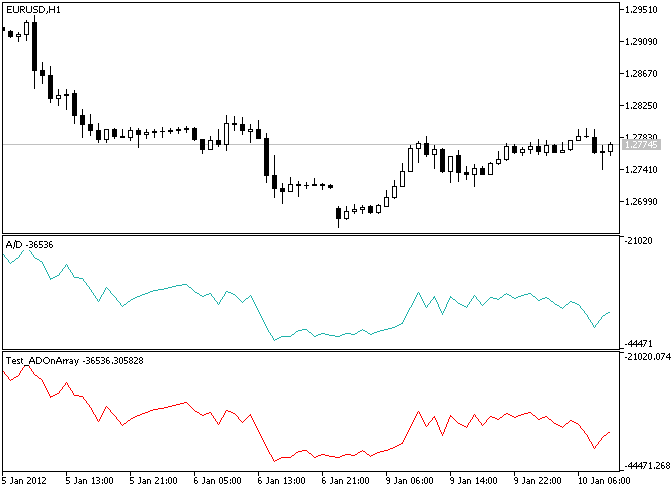
CADOnArray class is designed for calculation of AD (Accumulation Distribution, A/D) values on indicator buffers.
Usage:
Init() method with the optional parameter is called in the OnInit() function:
- int aPeriod - indicator period. In case the value is equal to 0 (by default), the indicator works the same way (is calculated by all chart bars) as the one built in the terminal. In case of any other positive value specified number of bars is used (Moving Average principle) for value calculation at each chart bar.
Solve() method with the following parameters is called in the OnCalculate() function:
- const int aRatesTotal is a rates_total variable from the OnCalculate() function parameters;
- const int aPrevCalc - prev_calculated variable from the OnCalculate() function;
- double aDataHigh[] - the buffer with the High data for the indicator calculation;
- double aDataLow[] - the buffer with the Low data for the indicator calculation;
- double aDataClose[] - the buffer with the Close data for the indicator calculation;
- double aDataVolume[] - the buffer with the Volume data for the indicator calculation;
- double aAD[] - the buffer with the calculated value.
Additional methods:
- int BarsRequired() - returns the minimum number of bars for the indicator calculation;
- string Name() - returns the line with the indicator name.
Test_ADOnArray.mq5 is a sample indicator showing CADOnArray class application. IncADOnArray file must be placed to MQL5\Include\IncOnArray of the terminal data folder (IncOnArray folder must be created).
Accumulation/Distribution (A/D) Technical Indicator is determined by the changes in price and volume. The volume acts as a weighting coefficient at the change of price - the higher the coefficient (the volume) is, the greater the contribution of the price change (for this period of time) will be in the value of the indicator.

Translated from Russian by MetaQuotes Ltd.
Original code: https://www.mql5.com/ru/code/669
 GMMA
GMMA
Guppy Multiple Moving Average (GMMA) is an indicator based on the relationships between groups of moving averages providing insight into the behavior of two dominant market groups - traders and investors.
 Parabolic_HTF_Signal
Parabolic_HTF_Signal shows a trend direction or a signal for performing a deal generated by Color_Parabolic indicator at the chosen bar as a graphic object with colored trend indication or deal direction and sends alerts or audio signals in case of a market entry moment.
