Join our fan page
- Views:
- 552
- Rating:
- Published:
- 2025.04.17 08:43
-
 You are missing trading opportunities:
- Free trading apps
- Over 8,000 signals for copying
- Economic news for exploring financial markets
Registration Log inYou agree to website policy and terms of use
If you do not have an account, please register -
 Need a robot or indicator based on this code? Order it on Freelance
Go to Freelance
Need a robot or indicator based on this code? Order it on Freelance
Go to Freelance
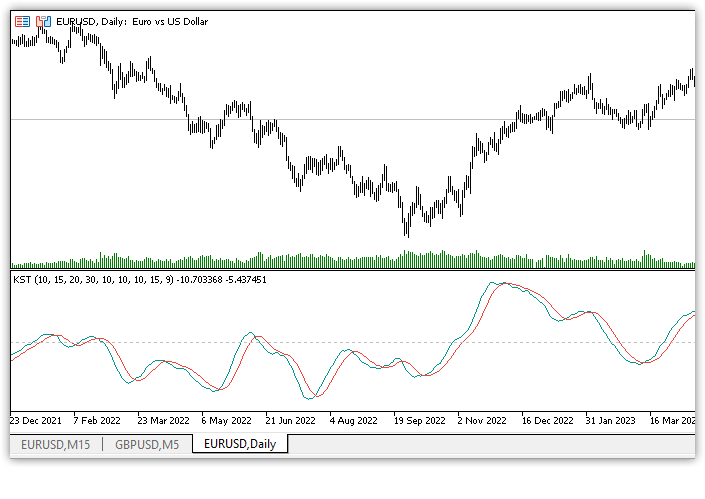
The Know Sure Thing (KST) indicator is an oscillator based on momentum represented by the Rate of Change (ROC). It is four different-period ROCs smoothed with simple moving averages (SMAs). From these four ROC series, a final value is calculated, oscillating between positive and negative values above and below the zero line. The indicator's signal line is the SMA of the calculated KST line. Essentially, the Know Sure Thing indicator measures the momentum of four separate price cycles.
The KST indicator was developed by Martin Pring and introduced in 1992 in Stocks & Commodities Magazine.
Calculation .
The default calculation periods for ROC, smoothing and signal line are: 10,15,20,30,10,10,10,10,10,15,9.
ROCMA1 = SMA(ROC(10), 10)
ROCMA1 = SMA(ROC(15), 10)
ROCMA1 = SMA(ROC(20), 10)
ROCMA1 = SMA(ROC(30), 15)
KST    = ROCMA1 + (ROCMA2 * 2) + (ROCMA3 * 3) + (ROCMA4 * 4)
Signal = SMA(KST, 9)
KST takes the rate of price change for four different time periods, smooths them and summarises the results.
The general rule is that when KST is positive, momentum is rising, and when KST is negative, momentum is falling. This can mean bullish and bearish markets respectively.
It should be noted that the calculation and smoothing periods used in the indicator parameters are chosen at the trader's discretion. Pring recommended such parameter values for daily, weekly and monthly charts:
D1: (10, 15, 20, 30, 10, 10, 10, 15, 9)
W1: (10, 13, 15, 20, 10, 13, 15, 20, 9)
MN: ( 9, 12, 18, 24,  6,  6,  6,  9, 9)
Divergences
Divergence occurs when the price movement is not confirmed by the indicator values. This can be a sign that the current momentum is not supporting the price and a market reversal is probably near.
A bullish KST divergence is when prices are falling and KST is rising. Bearish divergence is the opposite, when prices are rising and KST is falling.
Overbought/oversold
Relative to other oscillators that have a given data scale, KST is not tied to any ranges. Therefore, determining the true overbought and oversold levels requires some research and experimentation on historical data of the chart period in question. In most cases, overbought and oversold conditions of KST are good for confirming a trend, but not for reversing it. Overbought can be seen as a sign of strength in a bull market, while oversold can be a sign of strength in a bear market.
Crossovers
There are two different types of crossovers when analysing KST:
- zero line crossover,
- crossing the signal line and the main line.
Zero line crossovers are usually high lagged and unreliable and are more likely to indicate a continuation of the current trend, while signal line crossovers can signify a major change in momentum.
If the KST line is negative while crossing the signal line from bottom to top, the upside momentum is increasing.
If the KST line is positive while crossing the signal line from top to bottom, the downside momentum increases.
The Know Sure Thing (KST) indicator is similar to many other technical analysis indicators in that it has both strengths and weaknesses and should not be used as a stand-alone signal generation system. Since the indicator uses a series of moving averages, it has an inherent delay. This can cause simple signals, such as crossing the zero line, to be unreliable. However, the indicator can be considered useful when using overbought and oversold conditions, but not as a way to determine reversals, but as a confirmation of the trend direction. Crossing with the signal line with confirming signals from other indicators shows effectiveness in predicting price movements.
Translated from Russian by MetaQuotes Ltd.
Original code: https://www.mql5.com/ru/code/49265
 Correlation Coefficient
Correlation Coefficient" indicator
Chaikin Money Flow
Chaykin Money Flow (CMF)" indicator
Net Volume
The "Net Volume" indicator shows the volume taking into account the pressure of sellers and buyers
SMI Ergodic Oscillator
Ergodic oscillator Stochastic Momentum Index (SMI)