Join our fan page
- Views:
- 458
- Rating:
- Published:
- 2025.04.17 08:43
-
 You are missing trading opportunities:
- Free trading apps
- Over 8,000 signals for copying
- Economic news for exploring financial markets
Registration Log inYou agree to website policy and terms of use
If you do not have an account, please register -
 Need a robot or indicator based on this code? Order it on Freelance
Go to Freelance
Need a robot or indicator based on this code? Order it on Freelance
Go to Freelance
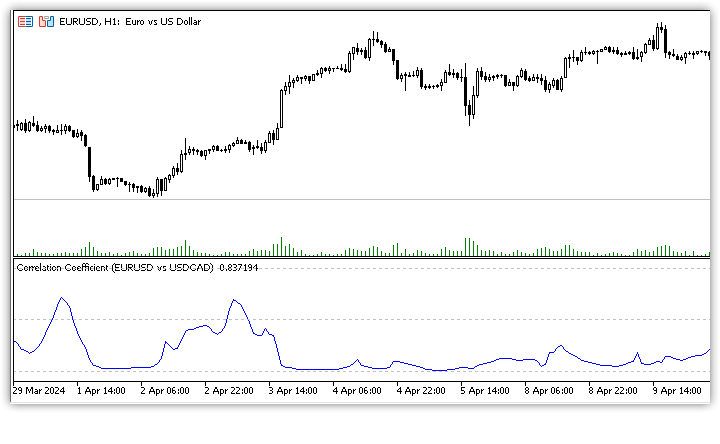
The correlation coefficient (CC) is used in statistics to measure the correlation between two sets of data. In the world of trading, data sets can be any financial instrument. Simply put, the correlation between two financial instruments is the degree to which they are related. Correlation is based on a scale of 1 to -1. The closer the correlation coefficient is to 1, the higher the positive correlation between the two instruments, which will move up and down at the same time. The closer the correlation is to -1, the stronger the instruments move in opposite directions. A value of 0 indicates no correlation.
The indicator values fluctuate between positive and negative correlation, which indicates how synchronously the prices of two instruments move. A correlation coefficient of +1 is a perfect positive correlation and prices are moving in perfect synchronisation. A correlation coefficient of -1 represents a perfect negative correlation, where prices move in exactly opposite directions. Both of these extremes are rare, and the correlation coefficient often fluctuates somewhere between the maximum values. A correlation coefficient of 0 is the midpoint indicating that there is no correlation between two instruments.
The correlation coefficient between EURUSD and USDCAD:
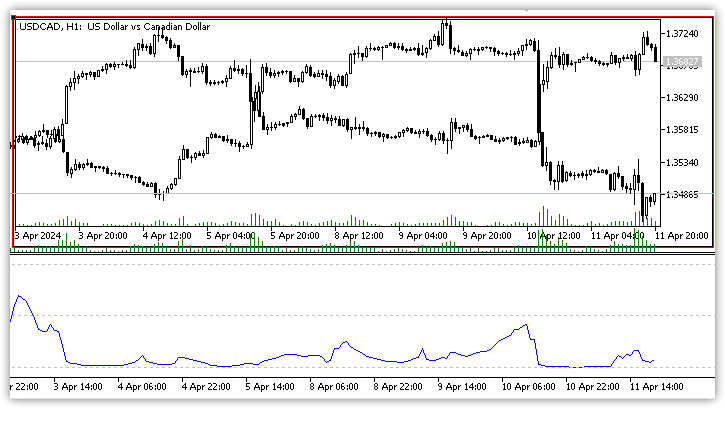
USDCAD chart overlaid on the EURUSD chart and their correlation coefficient:
Unlike many technical analysis indicators, the correlation coefficient is ideal for long-term investing. If an investor is going to build a truly diversified portfolio, the correlation coefficient can be very useful. It can help determine how much the assets in the portfolio differ from each other. In other words, by having instruments with low correlation, unnecessary duplicated risk can be avoided.
The indicator has three customisable parameters:
- Symbol - indicates the symbol name of the second instrument. The first symbol is the symbol on which the indicator is launched;
- Source - source of prices. It defines at what prices the correlation of two instruments will be calculated;
- Length - calculation period. It indicates the number of bars for which the correlation coefficient will be calculated.
As mentioned earlier, the correlation coefficient can be a useful tool when compiling a diverse portfolio. However, one thing to always keep in mind is that the correlation between two instruments can and does change from time to time. This indicator will help a trader to be aware of such changes and modify their investments accordingly.
Translated from Russian by MetaQuotes Ltd.
Original code: https://www.mql5.com/ru/code/49182
 Chaikin Money Flow
Chaykin Money Flow (CMF)" indicator
ColorXMA_Ishimoku_StDev - indicator for MetaTrader 5
The XMA_Ishimoku indicator with additional trend strength indication using colored dots based on the standard deviation algorithm. The original code in the attached link had plotting problems.
Know Sure Thing
Know Sure Thing (KST) oscillator indicator based on the rate of price change (ROC)
Net Volume
The "Net Volume" indicator shows the volume taking into account the pressure of sellers and buyers