Join our fan page
- Views:
- 3670
- Rating:
- Published:
-
Need a robot or indicator based on this code? Order it on Freelance Go to Freelance
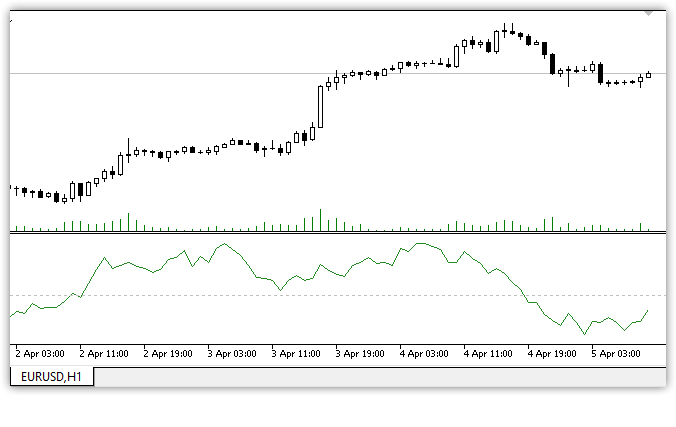
Chaikin's Cash Flow (CMF) is a technical analysis indicator used to measure the volume of cash flow over a given period of time. Cash Flow Volume (a concept also created by Mark Chaikin) is an indicator used to measure the buying and selling pressure of securities over a single period. CMF then summarises the cash flow volume over a user-specified period of analysis. Any retrospective analysis period can be used, but the most popular settings are 20 or 21 days. The Chaykin Cash Flow value ranges between 1 and -1. CMF can be used as a way to further evaluate changes in buyer and seller pressure and can help anticipate future changes and therefore trading opportunities.
The calculation of the Chaykin Cash Flow (CMF) consists of three separate steps.
- a cash flow multiplier is sought:
Money Flow Multiplier = ((Close - Low) - (High - Close)) / (High - Low)
- cash flow volume is calculated:
Money Flow Multiplier * Volume
- CMF is calculated :
CMF(Period) = Sum(Period) of Money Flow Volume / Sum(Period) of Volume

Buyer and seller pressure can be determined by where a period closes relative to its high/low. If the period closes in the upper half of the bar range, then buyer pressure is higher, and if the period closes in the lower half of the bar range, then seller pressure is higher. This is the cash flow multiplier (step 1 in the above calculation). Based on the cash flow multiplier , the amount of cash flow (2) and therefore ultimately (3) the ChaykinCash Flow (CMF) is determined. The value of the Chaykin Cash Flow ranges from 1 to -1.
The basic interpretation is: When the CMF is closer to 1, there is stronger buyer pressure. When the CMF is closer to -1, there is stronger selling pressure.
Trend Confirmation
Buyer and seller pressure can be a good way to confirm an ongoing trend. This can give the trader an additional level of confidence that the current trend is likely to continue. During a bullish trend, persistent buying pressure (Chaykin Money Flow values above 0) may indicate that prices will continue to rise. During a bearish trend, persistent selling pressure (Chaykin Money Flow values below 0) may indicate that prices will continue to fall.
Intersections
When the Chaykin Money Flow crosses the zero line, it may indicate an impending trend reversal. When the indicator line crosses the zero line from the bottom to the top, the price is likely to rise further. When the indicator line crosses the zero line from the top to the bottom, the price is likely to fall further. It should be noted that, like most indicators, the CMF may have short-term crossovers that result in false signals. The best way to avoid such signals is to analyse the behaviour of a particular security and adjust the thresholds accordingly. For example, two separate lines such as 0.05 and -0.05 can be used instead of crossing the zero line.
Disadvantages
The Chaikin Cash Flow does have some flaws in its calculations , in that the cash flow multiplier, which plays a role in determining the amount of cash flow, and thus the indicator values, does not take into account changes in the trading range between periods. In case of any gap, it will not be detected and, therefore, the indicator lines and prices will not be synchronised here.
Bottom line
Chaikin's Money Flow is a good indicator that allows you to analyse the pressure of purchases and sales for a given period of observation. The indicator does not have to be used separately as a standalone indicator that generates signals. CMF works well in combination with additional indicators, especially with those indicators that were also created by Chaikin: Accumulation/Distribution (ADL) and Chaikin Oscillator.
Translated from Russian by MetaQuotes Ltd.
Original code: https://www.mql5.com/ru/code/49029
 ColorXMA_Ishimoku_StDev - indicator for MetaTrader 5
The XMA_Ishimoku indicator with additional trend strength indication using colored dots based on the standard deviation algorithm. The original code in the attached link had plotting problems.
 Volume Oscillator
A volume oscillator is a useful technical analysis indicator that predicts the strength or weakness of price trends
 Correlation Coefficient
Correlation Coefficient" indicator
 Know Sure Thing
Know Sure Thing (KST) oscillator indicator based on the rate of price change (ROC)