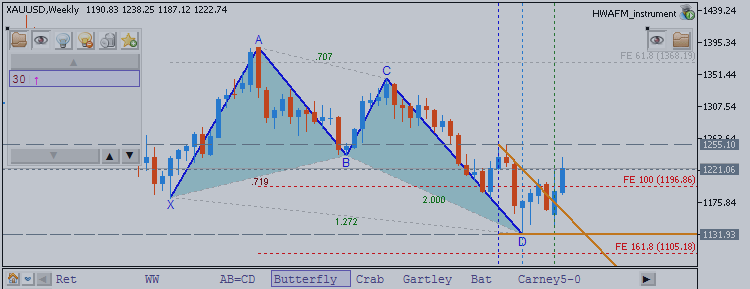
chart patterns
A chart pattern is a pattern within a chart when prices are graphed. Chart pattern studies play an important role in stock and commodity markets trading during technical analysis. When data is plotted, there is usually a pattern which naturally occurs and repeats over a period. Chart patterns are used as either reversal or continuation signals.
Chart patterns put all buying and selling into perspective by consolidating the forces of supply and demand into a concise picture. As a complete pictorial record of all trading, chart patterns provide a framework to analyze the battle raging between bulls and bears. More importantly, chart patterns and technical analysis can help determine who is winning the battle, allowing traders and investors to position themselves accordingly.
