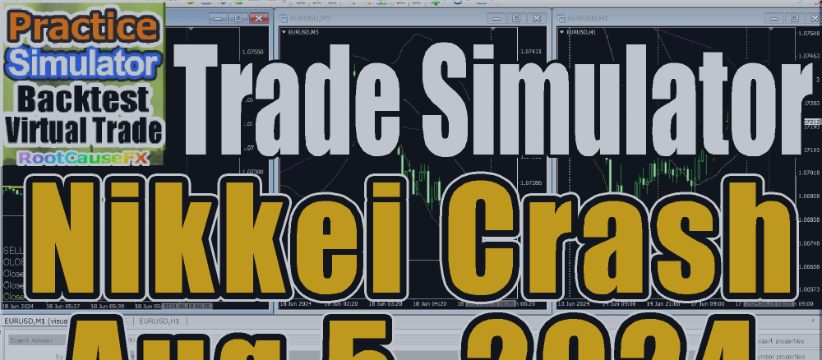
Navigating Market Turbulence: A Close Look at Black Monday 2024 through PracticeSimulator
On August 5, 2024, financial markets across the globe experienced a significant downturn, now referred to as "Black Monday." The Nikkei 225 index, along with other major market indices such as the S&P 500, GOLD, and EU50, recorded steep declines, sending shockwaves through the investment community. This article delves into the sequence of events that led to this market crash and explores how advanced tools like the PracticeSimulator can help investors understand and analyze such volatile market conditions.
The Market Crash Timeline: The tumult began on July 31, when the Nikkei 225 was at 39,000 points at 3 PM JST. By 5 PM, it had dropped to 38,500, indicating the onset of instability. The following days saw a rapid acceleration in the decline:
- August 1st: By mid-morning, the Nikkei had fallen to 37,700 and closed at 37,500 by the end of the trading day.
- August 2nd: A significant overnight drop was recorded, with the index at 36,500 at 3:30 AM, plummeting to 34,700 by 9:30 PM.
- August 3rd: The market briefly rebounded to 34,200 in the early hours but fell sharply during the day, reaching a low of 33,500 by morning and ultimately plummeting to 30,500 by mid-afternoon.
The rapid decline was influenced by a mix of local and global factors:
- U.S. Employment Statistics: Lower than expected job growth in the U.S. heightened fears of a global economic slowdown.
- Bank of Japan's Monetary Policy: Speculation about shifts in Japan's monetary policy created uncertainty, affecting investor sentiment.
- Corporate Earnings and Global Economic Indicators: Mixed earnings reports and other negative economic indicators contributed to the bearish outlook.
Understanding the Crash with PracticeSimulator: PracticeSimulator, a cutting-edge financial simulation tool, offers investors a unique platform to analyze and understand the dynamics of stock markets through historical data and real-time simulations. By using PracticeSimulator, users can:
- Visualize Market Movements: See how different indices reacted to various economic triggers.
- Test Strategies: Apply different trading strategies to see how they might have mitigated losses or capitalized on market movements during the crash.
- Learn from History: Analyze past market behavior in detail to better prepare for future volatility.
How PracticeSimulator Enhances Market Analysis: PracticeSimulator integrates a wide range of data inputs and advanced algorithms to offer detailed insights into market mechanics. Users can simulate trading scenarios using actual historical data, which provides a hands-on experience of managing investments during market crises.
- Scenario Testing: Users can recreate the market conditions of Black Monday to test how different approaches would have performed.
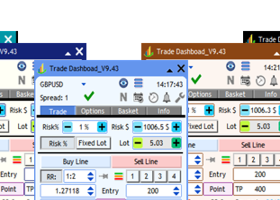
- Interactive Learning: The tool's interactive interface allows users to manipulate variables and instantly see the effects of their decisions on different financial instruments.
- Comprehensive Analysis Tools: From technical indicators to macroeconomic data overlays, PracticeSimulator provides a comprehensive suite of tools to analyze market trends and potential investment risks.
Conclusion: Black Monday 2024 serves as a stark reminder of the unpredictability of financial markets. Tools like PracticeSimulator are invaluable for both novice and experienced investors, providing deep insights and fostering a better understanding of market dynamics. By using such advanced technologies, investors can navigate the complex world of finance with greater confidence, turning potential crises into opportunities for learning and growth.
Try a demo: “Want to see what PracticeSimulator can do for you? Try a free demo and see how it can change your trading decisions!
https://www.mql5.com/en/market/product/98348

