
Forex and Cryptocurrency Forecast for July 29 – August 02, 2024


EUR/USD: Europe is Not Doing Very Well, the US is Not Doing Very Badly
● The main events in the currency market will unfold in the upcoming week, with meetings scheduled for Wednesday, 31 July, when the Bank of Japan and the Federal Reserve's FOMC (Federal Open Market Committee) will convene, followed by the Bank of England's meeting on Thursday, 01 August. Even if interest rates and other monetary policy parameters remain unchanged in all three cases, investors will closely listen to the statements made by regulators at the subsequent press conferences, trying to predict their next steps. Therefore, in anticipation of these events, we have focused more on the cryptocurrency market in this review, while still covering Forex.
● In early July, one of our review headlines read: "The US is Not Doing Very Well, Europe is Not Doing Very Badly." This time, we have reversed the positions of the US and Europe, prompted by the macroeconomic statistics released last week.
Vladimir Lenin, the leader of the Communists who led the 1917 revolution in Russia, stated in one of his works that "politics is the concentrated expression of economics." In our view, the reverse is also true: not only does politics depend on economics, but economics also depends on politics. This is exemplified by the scales, with the current monetary policy of the Federal Reserve on one side, and the concerning prospects of Donald Trump’s return to the White House on the other.
The restrictive tariffs that Trump aims to implement in the trade war with Beijing will create new problems for the Chinese economy, which is already struggling. This, in turn, will negatively impact Europe, particularly Germany, which accounts for half of the EU's exports to China. Within just three months, Germany's business activity indicators have shifted from slowing growth to abandoning optimism about economic prospects. The recent Business Activity Index (PPI) values for Germany, released on Wednesday, 24 July, were all in the red zone, falling below both previous figures and forecasts. Both the manufacturing PPI and the composite PPI are below 50 points, indicating regression. These German indices have dragged down overall European metrics, which have also turned worryingly red. While the US economy is merely slowing down slightly, the recovery of the Eurozone risks being reversed.
● The preliminary data on business activity in the United States, released on the same day, 24 July, showed that the PPI in the manufacturing sector decreased from 51.6 to 49.5 points, disappointing the market, which had expected a rise to 51.7. However, the same index in the services sector increased to 56.0, surpassing both the previous value of 55.3 and the forecast of 54.4.
The Composite Purchasing Managers' Index (PMI) rose to its highest level since April 2022. The real surprise, however, came from the US GDP data released on Thursday, 25 July. According to the Bureau of Economic Analysis' initial estimate, the Gross Domestic Product in Q2 2024 grew by 2.8% on an annualised basis. This followed a 1.4% growth in Q1, exceeded the market expectations of 2.0%, and confirmed the belief that the US economy will not fall into recession. Further details in the report showed that the core Personal Consumption Expenditures (PCE) price index increased by 2.9% on a quarterly basis, which was lower than the 3.7% growth recorded in the previous quarter, though slightly above the forecast of 2.7%.
● The unrest that began on 17 July in the stock market (detailed in the cryptocurrency review) increased demand for the dollar as a safe-haven currency, strengthening it by more than 100 points. However, for the last three days of the trading week, EUR/USD moved within a narrow range of 1.0825-1.0870 in anticipation of next week's events, with the final note sounding at the 1.0855 mark.
As of the evening of 26 July, analysts' forecasts for the near future are as follows: 40% predict a rise in the pair, while 60% expect a decline. In technical analysis, 65% of trend indicators on the D1 chart remain in favour of the euro, while 35% support the dollar. Among oscillators, there is considerable confusion: 25% are in green, 35% are neutral-grey, and 40% are red, with a quarter of them signalling oversold conditions. The nearest support levels for the pair are at 1.0825, followed by 1.0790-1.0805, 1.0725, 1.0665-1.0680, 1.0600-1.0620, 1.0565, 1.0495-1.0515, and 1.0450, 1.0370. Resistance zones are located at 1.0870, 1.0890-1.0910, 1.0945, 1.0980-1.1010, 1.1050, and 1.1100-1.1140.
● The upcoming week, as mentioned, promises to be very eventful, interesting, and volatile. On Monday, 29 July, retail sales volumes will be released, followed by preliminary data on GDP and consumer inflation (CPI) in Germany on 30 July. On the same day, GDP data for the Eurozone as a whole will also be published.
The key day will be Wednesday, 31 July. On this day, consumer inflation (CPI) data for the Eurozone will be released, followed by the FOMC meeting of the Federal Reserve. It is expected that the regulator will again leave the key interest rate unchanged at 5.50%. Therefore, market participants will be particularly interested in the FOMC's Economic Projections Summary and the subsequent press conference of the Fed leadership. The following day, Thursday, 01 August, final data on business activity (PPI) in various sectors of the US economy will be published.
Additionally, throughout the week (30, 31 July, 01 and 02 August), there will be a significant influx of labour market statistics from the United States, including key indicators such as the unemployment rate and the number of new non-farm jobs created (NFP).

USD/JPY: "The Most Intriguing Pair in Forex"
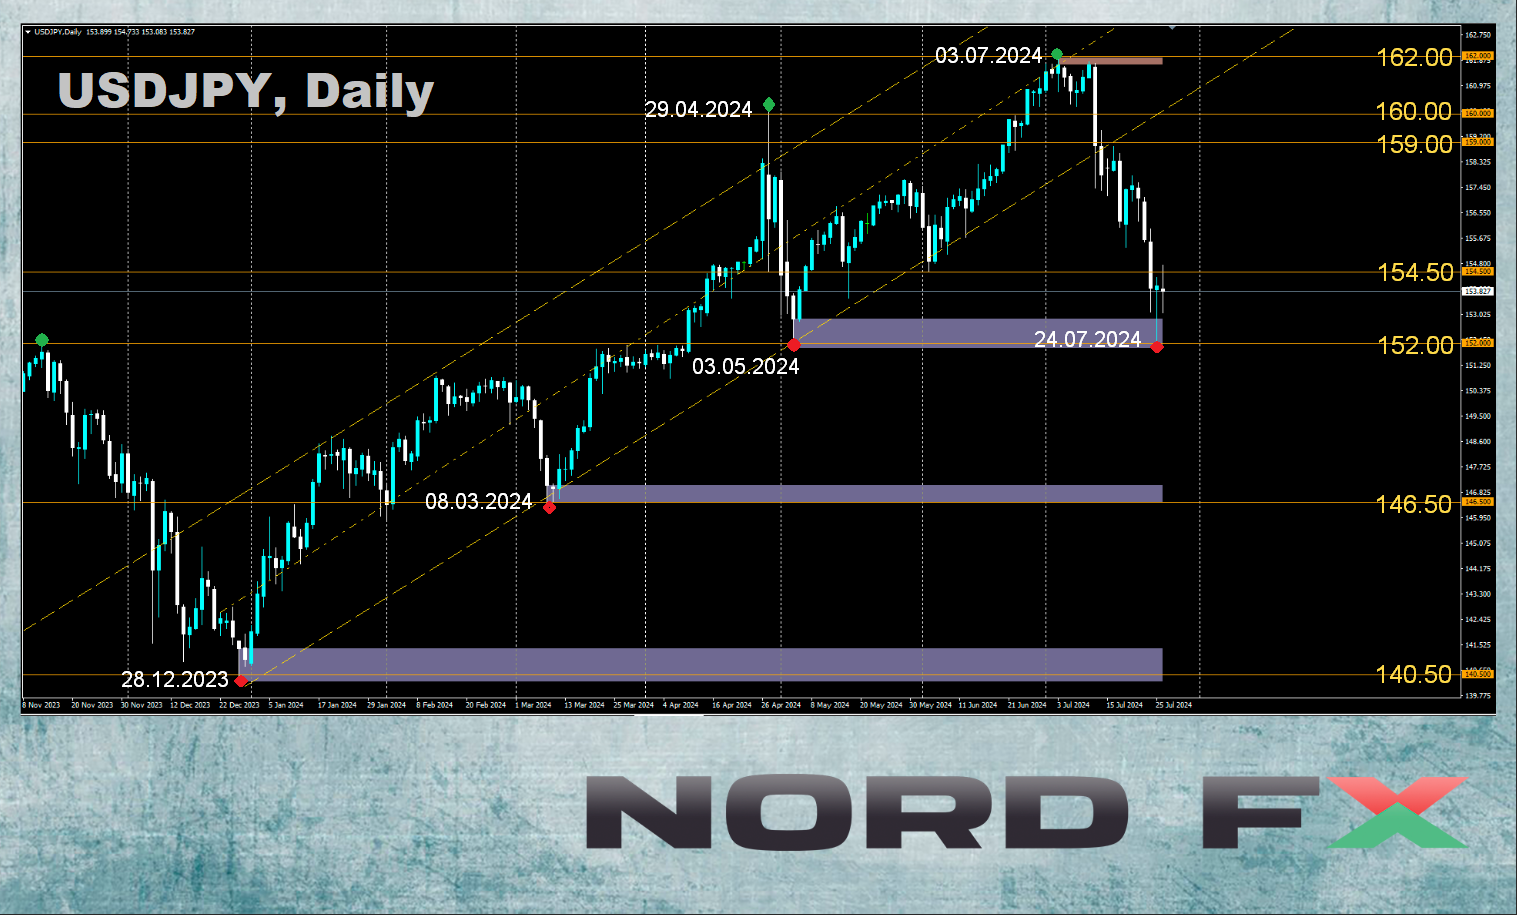
● While the dollar has recently been strengthening against the euro and the pound, the situation with the Japanese yen has been quite the opposite. This wasn't just a retreat of the US currency, but rather a panicked flight. On Friday, 19 July, strategists from ING, a major Dutch banking group, described the USD/JPY pair as a "bundle of surprises," retreating to the 155/156 range. A week later, they referred to it as "the most intriguing pair in Forex." This time, the minimum was recorded at 151.93, in the key zone of 151.80-152.00, which coincides with the highs of October 2022 and 2023.
● The yen began its resurgence like a Phoenix on 11 and 12 July when the Bank of Japan (BoJ), to support the national currency, purchased an estimated ¥6.0 trillion. On 17 July, USD/JPY came under pressure again due to another currency intervention. Analysts, examining BoJ's accounts, estimated the size of this intervention at approximately ¥3.5 trillion.
Then came a new surge. It is worth noting that on 03 July, USD/JPY reached a high of 161.94, a level not seen in 38 years. Now, in just three weeks, it plummeted by 1,000 (!) points, triggering widespread liquidation of positions across all markets, affecting everything from the yuan to various asset classes, including Japanese stocks, gold, and cryptocurrencies.
On Thursday, 25 July, the yen's exchange rate against the dollar rose to its highest level in over two months. This time, the cause seems to be not the currency interventions of the Japanese central bank but the expectation that the interest rate gap between Japan and the US will narrow on 31 July. Swap markets are currently pricing in a 75% probability of a BoJ rate hike on Wednesday, compared to 44% earlier in the week. Moreover, economists at ING believe the BoJ might raise the rate by an unprecedented 15 basis points (bps) for Japan.
They note that "Tokyo's consumer price data showed that core inflation fell to 2.2% year-on-year in July (from 2.3% in June), but the BoJ's preferred measure, core inflation excluding fresh food, rose to 2.2% in July from 2.1% in June." Based on this, ING suggests a 50% chance that inflationary pressure in the services sector will continue to rise, which could lead the BoJ to increase the rate by 15 bps at the upcoming meeting and simultaneously reduce its bond purchase program.
● If something like this occurs, macro strategists at State Street Global Markets believe that the resurgence of the Japanese currency could lead to a significant adjustment in global trading strategies in the foreign exchange market, particularly in carry trades. Carry trades involve borrowing in low-yielding currencies, such as the yen, to invest in higher-yielding currencies.
● USD/JPY ended the past trading week at 153.75. According to analysts at State Street Global Markets, "the yen rally may continue ahead of the Bank of Japan meeting next week." As for the median forecast by experts for the near term, it is as follows: 20% expect the pair to move south, further strengthening the yen, 30% predict a rebound north, and the remaining 50% have taken a neutral stance. Among oscillators on the D1 chart, 90% favour the Japanese currency, with 20% indicating the pair is in the oversold zone, and the remaining 10% are neutral. Trend indicators show 85% favouring the strengthening of the yen, while 15% support the dollar. The nearest support level is around 151.80-152.00, followed by 149.20-149.50 and 146.50-147.25. The nearest resistance is located in the 154.70-155.20 range, followed by 157.20-157.40, 158.25, 158.75-159.00, 160.20, 160.85, 161.80-162.00, and 162.50.
● Apart from the Bank of Japan meeting on Wednesday, 31 July, no other significant events, including the release of important macroeconomic statistics concerning the state of the Japanese economy, are scheduled for the coming days.

CRYPTOCURRENCIES: Politics Engages with the Digital Market
● As early as the mid-19th century, French writer Charles de Montalembert warned, "You may not be interested in politics, but politics is interested in you." This sentiment is vividly illustrated by recent developments in the market for risk assets, including cryptocurrencies.
The past week was disappointing for investors, although the troubles began earlier, on Wednesday, 17 July. On that day, the shares of some of the world's largest semiconductor manufacturers plummeted, causing the stock market to reach its worst condition in several months. This reaction was due to the tensions in US-China trade relations and comments from former (and possibly future) President Donald Trump regarding Taiwan. Shares of several semiconductor companies sharply declined under the weight of geopolitical tension, with some losing over 8% and a giant like Nvidia dropping by 6%. As a result, the S&P 500 Index fell by 1.39%, marking its largest drop since late April, and the tech-heavy Nasdaq fell by 2.77%, its worst performance since the end of 2022.
However, the troubles for the stock market did not end there. Exactly one week later, on Wednesday, 24 July, the US stock market closed with even greater losses. The S&P 500 and Nasdaq indices dropped by 3.6% and 2.3%, respectively, after Tesla's Q2 results revealed a profit decline of more than 40% compared to the previous year. Tesla's shares fell by more than 12% in just one day. Alongside Tesla, shares of Alphabet, Visa, Microsoft, Nvidia, and other technology companies also declined. The seven largest IT giants lost $770 billion in market capitalization in one day. This turmoil occurred amidst ongoing issues with Microsoft's global Windows system outage, which affected many sectors.
● Naturally, such market dynamics impacted the riskiest of assets—cryptocurrencies. It's worth noting that the prices of both bitcoin and ethereum appeared quite strong at the start of the past week. However, they eventually succumbed to the pressure and also declined. In addition to global geopolitical factors, cryptocurrencies had their own specific reasons for this downturn.
● The market was shocked when US President Joe Biden announced on Sunday, 22 July, that he would not seek re-election. This decision sparked a debate about how it might impact the digital assets market. Many analysts and influencers argue that only a victory by Donald Trump could provide a strong bullish impulse to the industry. This view is shared by experts at JPMorgan. Analyst Josh Gilbert stated, "The longer we see Trump leading in the election odds, the more valuable crypto assets will become after his victory." He further explained, "It's hard to imagine Kamala Harris or another Democratic candidate overthrowing Trump's lead in the polls just three months before the end of this election race.".
● Trump's Republican ally, Senator Cynthia Lummis, suggested backing the dollar with bitcoin to improve the country's financial system. A similar approach was proposed by Markus Thielen, founder of 10x Research. He believes that Trump could announce at the upcoming Bitcoin-2024 conference that he plans to make bitcoin a strategic reserve asset for the US government. Currently, the government holds only 212,800 BTC, worth approximately $15 billion, compared to its gold reserves of around $600 billion. If the government were to double its bitcoin holdings, it would have an impact on the price nearly equivalent to the net inflow effect on spot BTC-ETFs since the beginning of the year.
● Bloomberg reports that bitcoin miners and crypto companies, previously hindered from going public in the US, could benefit under a second Donald Trump presidency. The agency cites the opinion of Christian Catalini, founder of the Crypto-economics Lab at the Massachusetts Institute of Technology. He believes that "almost everyone in America will benefit if they choose to operate under new rules after they are implemented."
In June, Trump met with miners and expressed his desire for all remaining bitcoin to be "made in the USA." Following Joe Biden's poor performance in debates and an unsuccessful assassination attempt on Trump, the price of bitcoin rose by 10%, while shares of the two largest public miners, Marathon Digital and Riot Platforms, increased by 30%. Cipher Mining's stock prices gained nearly 50%. For the first time since the crypto market crash in 2022, companies in the sector are planning initial public offerings (IPOs). Stablecoin issuer USDC, Circle, filed for an IPO in January with a valuation of $33 billion. Crypto miner Northern Data, which is actively expanding its AI computing division, is considering listing in the US, with a potential valuation of $16 billion. Kraken, the second-largest exchange in the country, is also preparing to go public.
● However, all of this is speculative and dependent on future developments. Josh Gilbert, while optimistic about Trump's influence on the cryptocurrency market, cautions that "a lot can happen between now and the election, so nothing is certain." Gary Black, Managing Partner of The Future Fund, echoed this sentiment, warning his 433,000 followers on X that a Trump victory is far from assured. "Those who think Trump/Vance will secure an easy win are getting ahead of themselves," Black wrote.
Arthur Hayes, the former CEO of the crypto exchange BitMEX, also expressed skepticism. He believes that voters who support cryptocurrency may lose influence over politicians once the presidential election is over in November 2024. If a regulatory framework for digital assets is not established before the election, the elected president and their administration may shift their focus to other pressing issues. Geopolitical concerns could overshadow discussions about cryptocurrencies, with the president's attention potentially diverted to international conflicts, particularly involving Iran and Russia. Hayes argues, "The capital needed to support laws promoting cryptocurrency development could be redirected towards addressing more urgent foreign policy issues. Therefore, regulatory clarity should be sought now, before the political landscape changes post-election."
BITCOIN: Bullish Flag or Bearish Den?
● Experts at JPMorgan note that the current bitcoin price significantly exceeds its mining cost (~$43,000) and appears overvalued compared to its "fair" price adjusted for volatility (~$53,000). According to JPMorgan, the substantial upward deviation from this fair price "limits the potential for long-term growth." However, they have forecasted positive market dynamics in August, attributed to the diminishing negative impact of the sale of coins confiscated by German authorities and the distribution of coins to clients of Gemini and Mt.Gox.
● At the beginning of the year, Nigel Green, CEO of deVere Group, predicted that bitcoin would soon rise to $60,000, and his forecast proved accurate. Now, he believes that the demand for the leading cryptocurrency will continue to grow, potentially reaching $100,000 by the end of the year. "Bitcoin is likely the best asset in terms of growth potential by the end of the year," the financier writes. "Many are expecting it to reach $100,000 by year-end. Is this possible? Quite possibly, because the supply of bitcoin is limited. This means that if demand for BTC increases, so will the price. Bitcoin is not the same as the US dollar, where the Federal Reserve can simply print more."
Green also mentioned that the potential election of Donald Trump as US President could positively impact bitcoin's price.
● Analyst and trader known by the nickname RLinda identifies the bullish flag pattern as a key indicator of potential upward movement for BTC. This formation, observed on both daily and weekly charts, is characterized by a sharp upward move followed by a phase of consolidation. RLinda anticipates that a breakout from this consolidation will continue the previous uptrend, potentially targeting around $90,000.
Support and resistance levels play a crucial role in this analysis. Key support levels at $59,300 and $63,800 have shown strong buying interest and stability. The high trading volumes at these levels reinforce the expectation that they will hold during any potential pullbacks. Critical resistance levels are noted at $67,250 and $71,754. Breaking through these resistance points is necessary for BTC to advance towards higher targets. The all-time high (ATH) at $73,743 is particularly significant; a successful breakout above this level could trigger further bullish momentum.
● Peter Brandt, the head of Factor LLC, has entered into a debate with RLinda. The legendary trader expresses skepticism that bitcoin will surpass $71,000 and set a new price record. "I try to be as honest as possible in identifying patterns. The current stagnation in the bitcoin market should not be called a flag (it has lasted too long); it represents a descending channel. Anything that lasts longer than 4-6 weeks is not a flag," Brandt wrote.
According to some analysts, the flag pattern observed on the BTC/USD chart suggests an impending bullish rally. However, the descending channel that Brandt refers to indicates a potential decline in the coin's price. This pattern is characterized by lower highs and lows, established after BTC reached its all-time high in March. Based on the chart published by Brandt, he believes that bitcoin's price will not break the resistance line, which lies around $71,000. In this scenario, a bearish trend could begin, with the digital gold potentially dropping to $51,000. The descending channel is slightly widening, suggesting that price volatility may increase over time.
● On Thursday, 25 July, the BTC/USD pair dropped to the support zone of $63,200-63,800 and encountered additional support from the 200-day moving average (DMA200). Following this, it reversed direction and started to move upwards. As of the evening of Friday, 26 July, it has nearly recovered its weekly losses and is trading at around $67,500. The total market capitalization of the crypto market has remained relatively stable at $2.42 trillion, compared to $2.43 trillion a week ago. The Bitcoin Fear & Greed Index has risen from 60 to 68 points over the past seven days, remaining in the Greed zone.
ETHEREUM: ETH-ETF – Disappointment Instead of Hope
● On 23 July, the long-awaited spot ETFs for Ethereum were launched in the US, providing investors with access to the altcoin through traditional brokerage platforms. On the first day of trading, the turnover reached $1.1 billion, which was 24.4% of the turnover of BTC-ETFs, aligning with optimistic forecasts. However, trading volume isn't the only metric to consider. The net inflow of investments into ETH was significantly lower than that into bitcoin, with $107 million compared to $655 million, respectively, showing a sixfold difference.
● The situation worsened as the initial enthusiasm for Ethereum ETFs quickly faded, causing ETH/USD prices to decline sharply, despite the trading volume surpassing $1.0 billion again. The decline was triggered by a significant outflow of funds from a single issuer, Grayscale's Ethereum Trust ETF (ETHE). According to SoSoValue, Grayscale's ETHE lost $484 million on the first trading day and nearly $327 million on the second day, totalling $811 million. In contrast, most other spot ETH-ETFs, including ETHA from BlackRock, ETHW from Bitwise, and FETH from Fidelity, showed growth in inflows. However, these inflows were insufficient to offset the losses from Grayscale's ETHE.
This situation mirrors the experience with Grayscale's GBTC fund in the early weeks following the launch of the bitcoin ETF. Both Grayscale funds were converted from trust to spot ETFs. If the outflow rate from ETHE matches that of GBTC, it could negatively impact all newly established ETH-ETFs.
Moreover, macroeconomic factors contributing to the (hopefully temporary) stock market downturn, the ongoing situation with Mt.Gox, and the lack of staking in ETFs, which deprives the altcoin of the advantage of passive income, also play a role. Additionally, Ethereum's practical applications are increasingly being outperformed by competitors such as Tron and Solana. Experts also remind us of the upcoming US elections, where statements and actions by key political figures could create new opportunities and threats for the market.
● Analysts at cryptocurrency market maker Wintermute believe that demand for Ethereum will fall short of expectations, predicting investments in these derivatives will range between $3.2 billion and $4.0 billion in the first 12 months after trading begins. As a result, they expect Ethereum's price to rise to a maximum of $4,300 in 2024.
In contrast, researchers from ASXN offer a more optimistic forecast. They predict that the monthly capital inflow into Ethereum ETFs will range from $800 million to $1.2 billion, implying a total investment of at least $6-7 billion in these funds by the end of the year, significantly exceeding Wintermute's estimate.
Adding to the positive outlook, experts from QCP Capital noted that following the launch of similar BTC-ETFs, bitcoin's price initially fell to $38,000 but then surged to new all-time highs within two months, posting a 90% increase. (However, it is worth noting that the BTC halving may have played a significant role at that time.) The dynamics of Ethereum will become clearer in the near future. Currently, ETH/USD recorded a weekly low of $3,089 and, as of the evening of Friday, 26 July, is trading around $3,200.
NordFX Analytical Group
Disclaimer: These materials are not an investment recommendation or a guide for working on financial markets and are for informational purposes only. Trading on financial markets is risky and can lead to a complete loss of deposited funds.
#eurusd #gbpusd #usdjpy #forex #forex_forecast #nordfx #cryptocurrencies #bitcoin


