

This is a detailed post explaining how to use the 3LZZ Semafor Scanner Dashboard.
Dash uses 3LZZ Indicator in the background to find semafors.
It will give priority to the level 3 semafors because they specify a strong signal.
It's available here:
https://www.mql5.com/en/market/product/41459/
All extras are attached with this blog post. You can also get them here:
https://abiroid.com/product/semafor-3lzz-scanner-dashboard/
Please note: Number of settings has reached over 60. So, I won’t be adding new features to it.
I’ll definitely provide support and bug fixes for this scanner. But I will be unable to add more settings.
Because a lot of people are using it combined with their own EAs.
Understanding Semafors:
https://abiroid.com/explained/understanding-semafors-3lzz
Free Simple Semafor Scanner:
https://www.mql5.com/en/market/product/76688
To use 3LZZ.tpl file, in Dashboard properties: “Use Template For New Window”: 3LZZ
To use this template just specify “3LZZ” in Dashboard Property: “Use Template For New Window” (without the quotes)
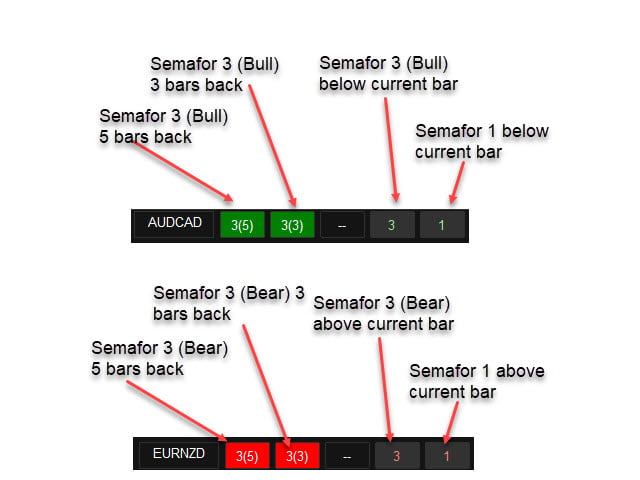
Green font 1 or 2 or 3: Bearish Semafor 1 or 2 or 3 on current bar
Red font 1 or 2 or 3: Bearish Semafor 1 or 2 or 3 on current bar
Orange 1/1 or 2/2 or 3/3: Both Bullish and Bearish semafors on current bar (very rarely occurs)
Green Block 3(4): Bullish Semafor 3 occured 4 bars back
Red Block 3(2): Bearish Semafor 3 occured 2 bars back
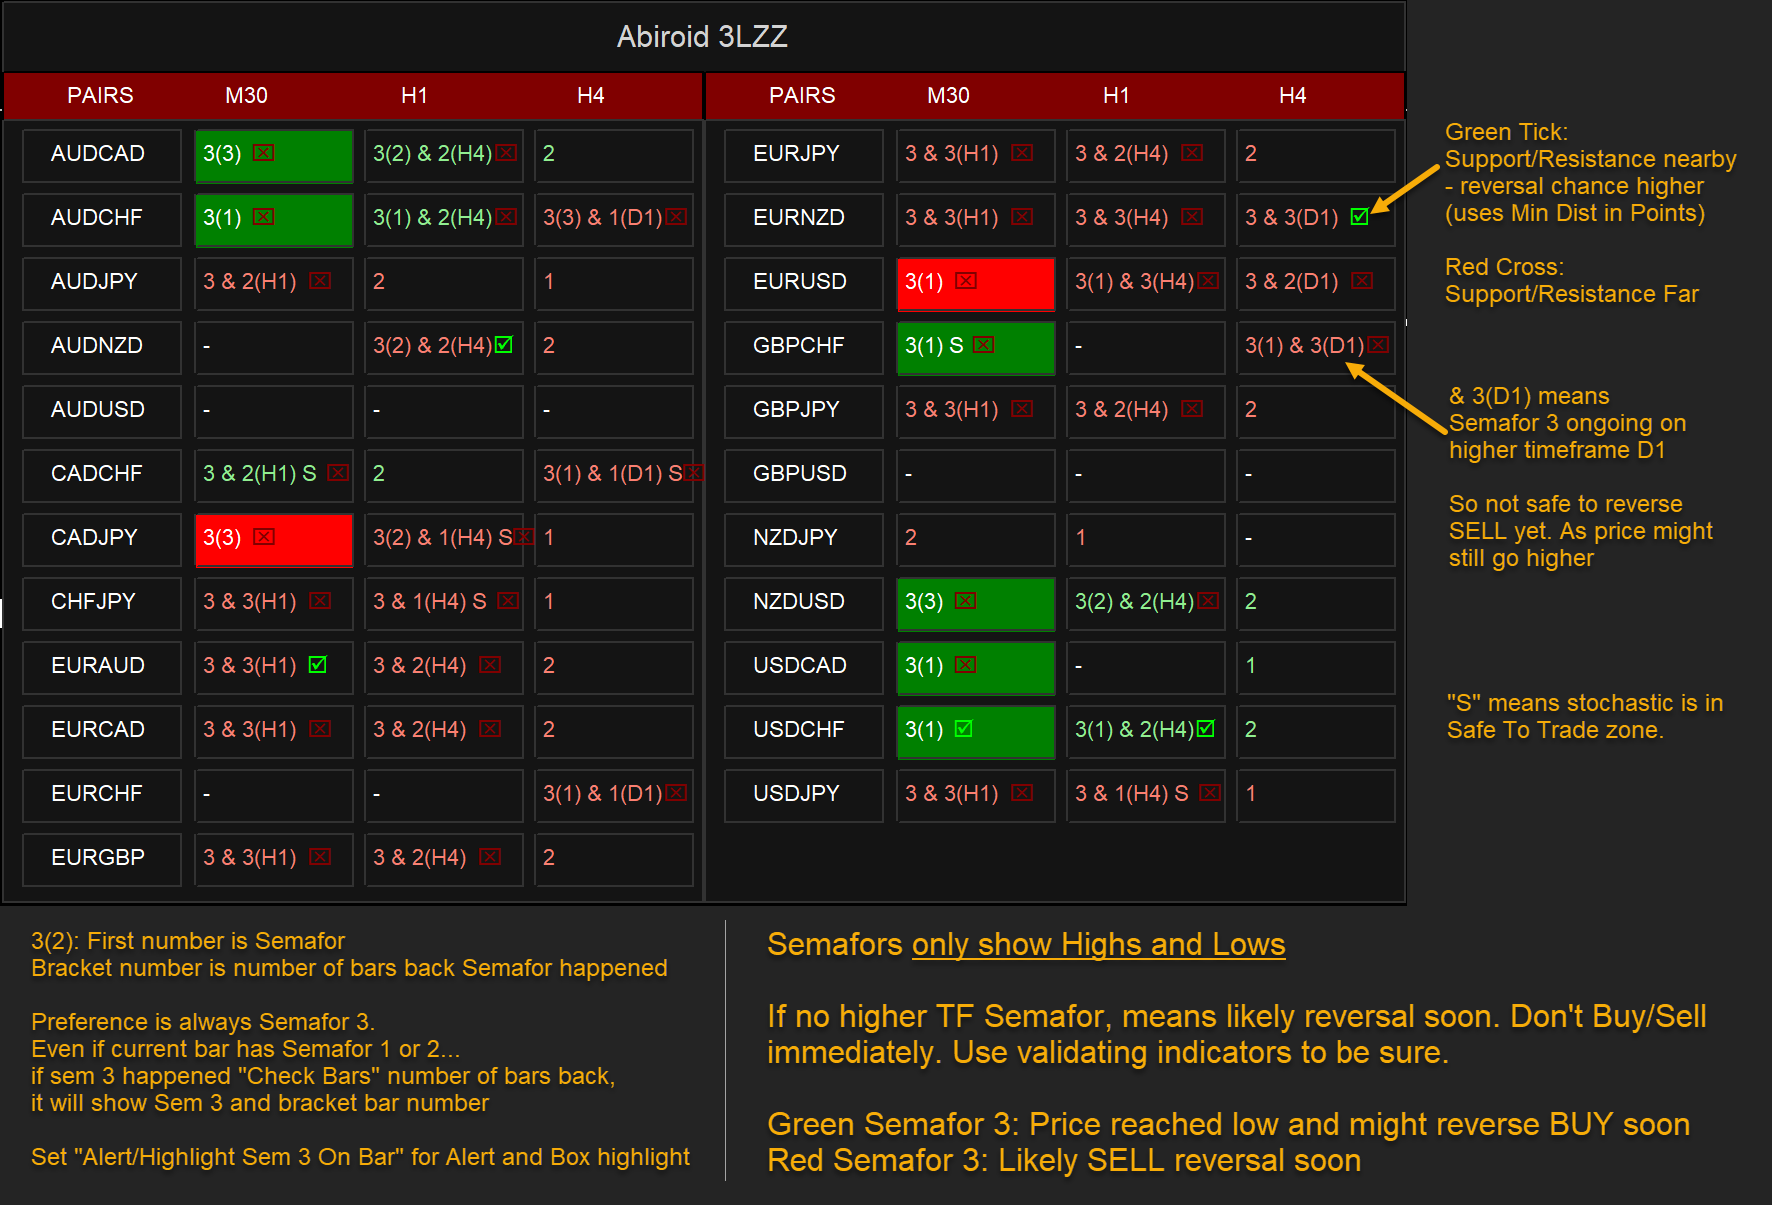
Support/Resistance:
Green tick means price is close to a support (in case of a buy) and close to a resistance (in case of a sell) and will reverse soon.
Red cross means price is still far from support/resistance so be careful as price might not reverse
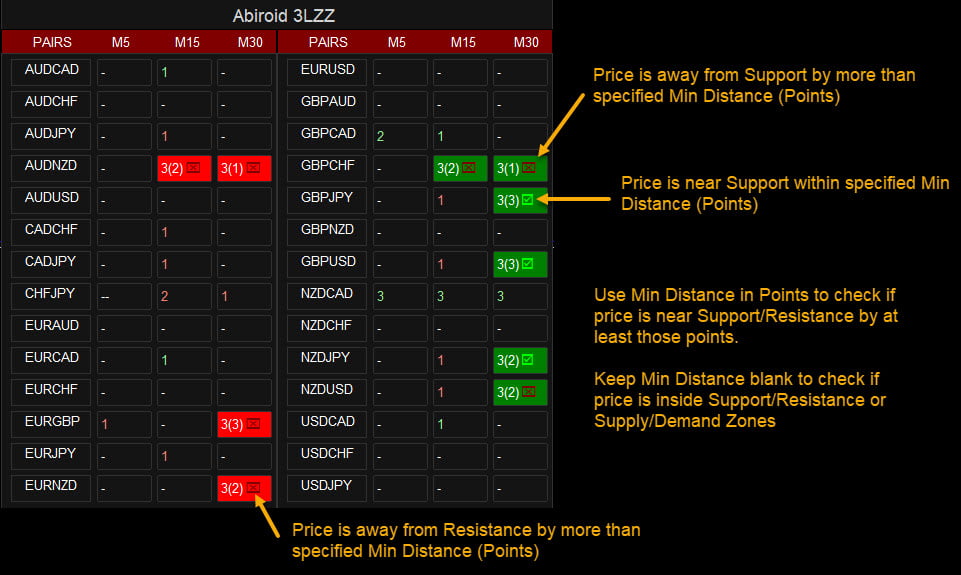
Keep “Min Distance from SR” blank to find if price is inside the zone.
To check if price is near from Support (for BUY) and resistance (for SELL) by at least Min Distance (Points) near, specify comma-separated values based on timeframes.
Suppose TFs are: M30,H1,H4
And Min Distance from SR is: 40,80,160
Then for M30 it will check if price is at least within 40 points near Support (for BUY) and Resistance (for SELL)
Stochastic:
Letter S: Means Stochastic Crossed Overbought or Oversold in Stochastic Timeframe
e.g.: If you keep Main TF: M15,M30,H1 and Stoch HigherTimeframes M30,H1,H4. So, for M15, stoch check will be done for M30.
Other symbols:
– Single Dash: No semafors
– – Double Dash: Semafor 3 in previous bars but hidden because higher timeframe has a current bar semafor
(See screenshots for examples)
Popup alerts or email alerts or push notifications. Can be specified in Indicator Properties.
Alert Semafor On Bar 3(x): Show alert for semafor on (x) previous bar
Keep Alert On Semafor 1,2,3 to true/false to get alerts when Semafor occurs on current bar. Please don’t trade right after semafor on current bar.
As it will shift as price breaks news highs/lows. Wait for reversal validation.
Settings:
– Specify your Own Pairs using a comma-separated list. Or you can select a pairs list from our drop-down for forex pairs like “Forex Core 7”, “Forex Core 14”, only AUD pairs, only JPY pairs, etc.
– Specify your own preferred time frames in a comma-separated list.
– Settings for showing alerts: Popup, email, sound alerts, etc.
– x_axis, y_axis: to position Scanner Dashboard
– fontSize: to resize the whole panel and it’s fonts. For best experience use fontSize between 5 and 8.
– ColumnsNum: Number of Dashboard Columns
– OnButtonClick Open New Window: On clicking any dash buttons open that Pair-TimeFrame in a new window with your specified template (next setting)
– Use Template for New Window: Template name without “.tpl”. Eg: Create a file Template1.tpl in templates folder and here specify: “Template1”.
(only works if previous property set to true). Does not work if on button click is set to open in current window because otherwise you might lose your current window indicators or existing dashboard settings.
– Check Previous Bars for Semafor 3: Specify number of previous bars to check Semafor 3 for.
– Skip If Semafor On Higher Timeframe: If true: If a semafor is still forming on a higher Timeframe then hide any previous semafors on the just lower timeframe. And just show double dash “–“
Because if higherTF semafor is still ongoing then price might still move. So it’s best to wait for bar to finish.
MA Alerts Filter option:
If true, then show Alerts for Semafors: Only BUY if price is above MA. Only SELL alerts if price is below MA.
Other alerts will get skipped.
How the Stochastic Check works:
If stochastic check is true, only show Alerts if Stochastic is in correct zone.
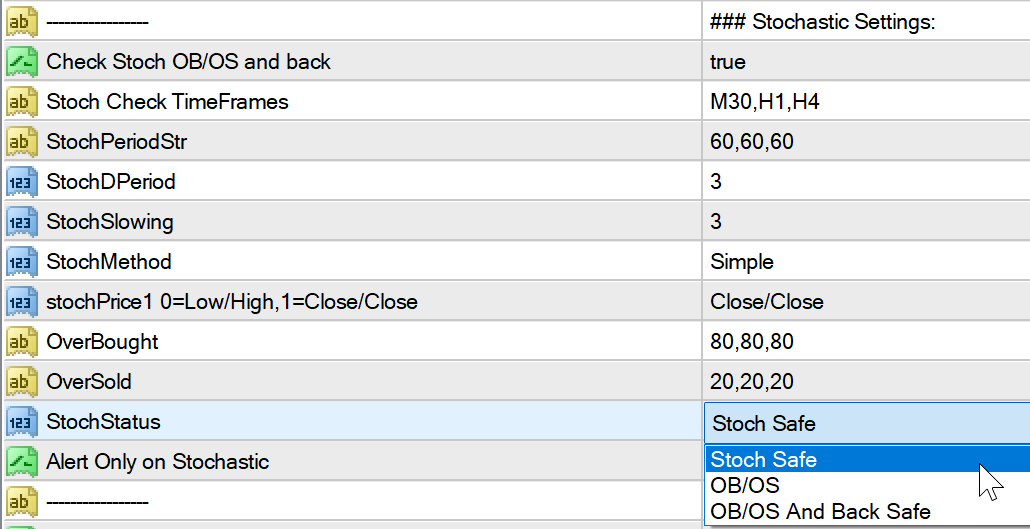
There are 3 options for zones:
- OB/OS: Stochastic should be Overbought for SELL signals and Oversold for BUY Signals.
- OB/OS and back: Stochastic should have gone OB and back in safe zone for SELL and Oversold (previous bar) and back (current bar) for BUY
- Safe Zone: Stochastic should be between safe zone – between OB and OS levels
Set different Stochastic values for higher timeframes.
E.g: Your main timeframes are M15,M30 and Stochastic TFs are M30,H1. Periods are 14,60. Overbought/Sold are 80,70 and 20,30.
Then for main M15, it will check HTF Stochastic for M30 with Period14 OB/OS: 80/20
And for main M30, it will check HTF Stochastic for H1 with Period60 OB/OS: 70/30
For BUY: Stochastic for Higher TF should cross below OverSold and close back above
For SELL: Stochastic for Higher TF should cross above Overbought and close back below
Stochastic check only affects alerts. The Semafor 3 will still be visible on dashboard. If Stoch OB/OS and back, it will show “S” on dashboard.
Note: With Stochastic “OB/OS and back” check, you will get an alert and see S only when candle at “Shift” has gone OB/OS and back.
So only for a single candle’s close.
How to Trade:
S/R or Pivot Strategy:
Best way to use this indicator is with Support and Resistance or Pivot points. Or any indicators which might validate the reversal.
Support/Resistance or Pivot levels will also help you set the SL/TP.
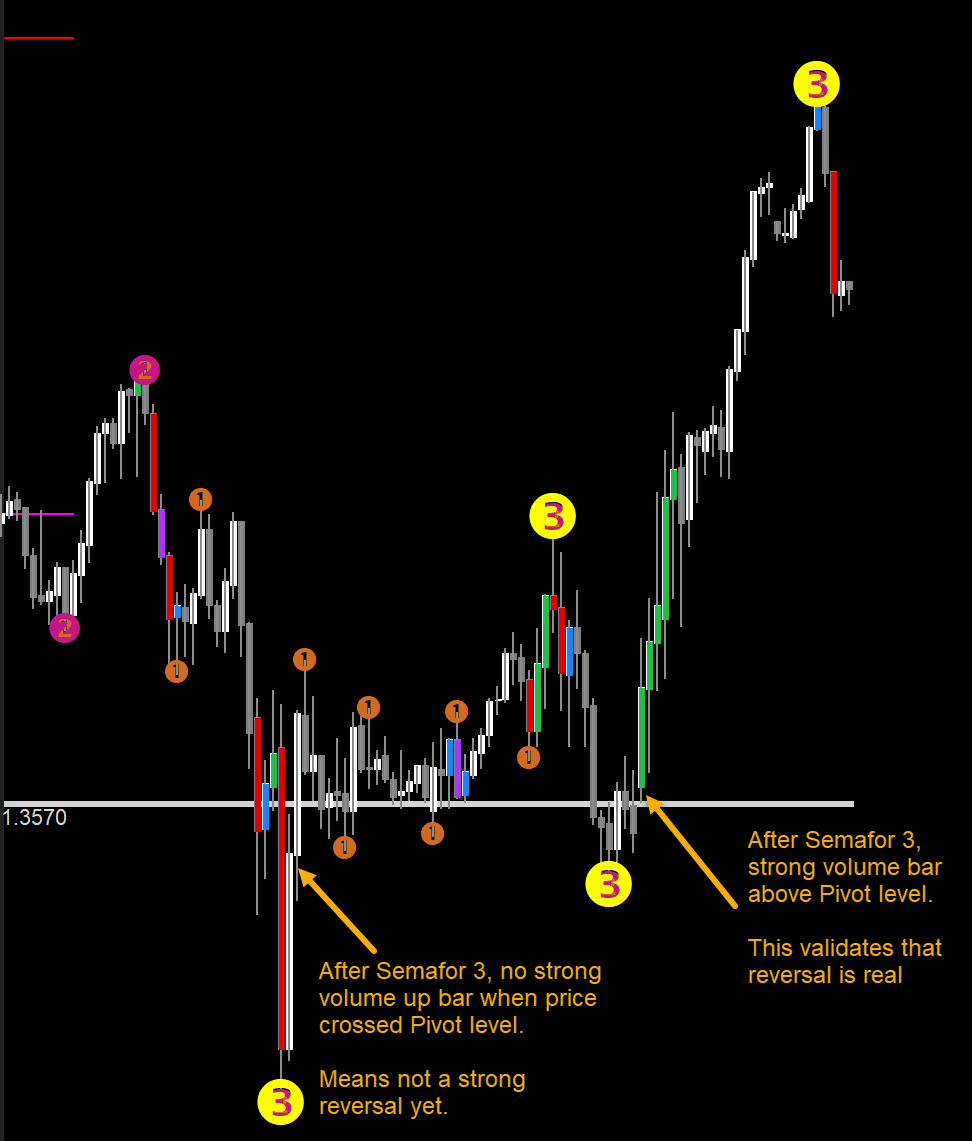
Wait for a Semafor 3 near a Pivot level. Then wait for a strong volume bar indicating reversal.
Price will use Pivot levels as magnet levels and range near those levels. So be careful to use a strong reversal indicator to validate.
And make sure it’s not a weak reversal.
Strong Pivot reversal:
Halftrend Strategy:
Another great strategy is to use Halftrend.
Once a Semafor signal has happened, wait for next few bars for a halftrend arrow in same direction.
Only use the signal if price has NOT gone too far yet. When halftrend occurs.
This halftrend scanner already uses Semafor 3 filter:
https://www.mql5.com/en/market/product/69230
Important Note:
– Please don’t use too many Timeframes and too many Pairs because Scanner will need to scan each and every one and might get slower the more pairs you select.
– Scanner scans every bar only once for 3LZZ. But it refreshes every new bar. So for example, if your lowest timeframe on dashboard is M5, set the current chart timeframe to M5 too. So it will refersh every 5 minutes.
– Best is to trade trending markets. Don’t trade when market is sideways. Ranging markets will show unreliable signals.
– If you want price to be above the dashboard, then right click on chart -> Go to Properties (F8) -> Common Tab -> Check “Chart on Foreground”.


