

✔️ Identify ranges and the next probable direction
✔️ Get the earliest signals and the strength of Trends
✔️ Get clear exits signals before reversal
✔️ Spot the Fibo levels the price will test
Get our full method with BladeSCALPER and PowerZONES
📌 What is it about ?
TrendDECODER is a concentrate of multiple innovations to make Trend following simple and easy.
Please see in the 🛠️ Calculation & Precisions section at the end of this page to know more how they work.
👉 GreyBox - identify when the market gets out of the Trend with a new sequence of transition. Check if the market is in Range, Continuation or Reversal (Up or Down) and wait for the closing of the box to get the Trend signal.
👉 Signals & Blue/Orange Clouds - once the GreyBox has delivered its message, get the new direction of the Trend and see the probable zones of pull backs during the current direction.
👉 Projective TrendLine - see before it happens the direction and the possible angle of the Trend with its probable range.
👉 RealTime TrendLine vs the Projective TrendLine - adjust immediately if the market accelerates North or South.
👉 RealTime TrendLine Crossing - detect at the earliest the moment the Trend gets out of track, to get out of the train.
👉 FiboLevels - spot immediately which price levels the market will test.
📌 For which asset?
TrendDECODER is universal: it works fine on all assets and all time-frames;
☝️ always work on a multi-timeframe environment to minimize risk;
📌Why we made these innovations?
Because the trend indicators that we know, lag a lot and do not clearly identify ranges!
We need much more powerful tools than Supertrend or a couple of moving averages crossings to get this done.
📌 How to trade with TrendDECODER?
🔹 Strategy #1: Trend Following : DecoderSignals & Blue/Orange Clouds
The GreyBOX has given the next probable movement and the Signal of a Trend in on.
The RealTime TrendLine guides us on the pace of this movement and the Blue/ Orange/Cloud figures the support/resistance of this movement.
It will be wise not to jump immediately in the Trend as the signal appears as the price will very probably make a pullback in direction of the cloud first.

🔹 Strategy #1: Checklist
📍 Set a Multi Time Frame environment
📍 Main Time Frame and the Upper Time Frame are moving in the same direction (Up or Down)
📍 Main Time Frame: appearance of the « TrendUp Signal » or the « TrendDown Signal »
📍 Entry:
☝️ buying « at Market » immediately on a « Trend Signal » is quite risky as many times the price will pull back near the Clouds
👉 a good option is to buy 1/2 the position at market on signal
👉 and 1/2 after the first pull back
📍 First Stop Loss: place your SL under the lower border of the GreyBox for an expected TrendUp or the higher border for an expected TrendDown
📍 BreakEven: when the price reaches your Risk/Reward ratio of 1 = Distance StopLoss vs Entry = Distance Current Price vs Entry
📍 Trailing Stop: just under the lowest border of the Blue Cloud (TrendUp) or the highest border of the Orange Cloud (TrendDown)
📍 TakeProfits: in a TrendUP, place your take profits just under the FibosLevels in order not to get exited (and above in a TrendDOWN)
📍 Exits:
👉 Early option : Crossing of the RealTime TrendLine
👉 Late option : Crossing of the Blue/Orange cloud
🔹 Strategy #2: Early Trend following : RealTime TrendLine Crossing
With this simple tool, get a very early signal of a probable inversion of the current Trend, way before the Decoder Signal is shown, once confirmed by the GreyBOX.

🔹 Strategy #2: Checklist
📍 Set a Multi Time Frame environment
📍 Main Time Frame and the Upper Time Frame are moving in the same direction (Up or Down)
📍 Entry (Main Time Frame): wait for the Close crossing over the ReaTime TrendLine in an expected TrendUp (under for a TrendDown )
📍 First Stop Loss (Main Time Frame):
👉 place your SL under the lower low of the GreyBOX (for an expected TrendUp) or the higher high (for an expected TrendDown)
📍 BreakEven: move your SL to Entry price when the price reaches your Risk/Reward ratio of 1 = Distance StopLoss vs Entry = Distance Current Price vs Entry
📍 Trailing Stop: just under the lowest border of the Blue Cloud (TrendUp) or the highest border of the Orange Cloud (TrendDown)
📍 TakeProfits: in a TrendUP, place your take profits just under the FibosLevels in order not to get exited (and above in a TrendDOWN)
📍 Exits:
👉 Early option : Crossing of the RealTime TrendLine
👉 Late option : Crossing of the Blue/Orange cloud
🎛️ Configuration
Well, basically you do not have to do anything !
But you can make TrendDECODER perfectly yours with a few switches in the configuration panel to make appear or disappear each one of the elements composing TrendDECODER.
🛠️ Calculation & Precisions
🔹 Blue/Orange Clouds
The Blue/Orange Clouds are a proprietary synthesis of Price Action and Volume Exchange in real time.
🔹 Projective TrendLine
As soon as a new high or a new low has been reached during the last move, TrendDECODER traces a possible angle of the future movement based on the pace of the last one in the same direction.
The distance between the Projective TrendLine and the Last Lowest (resp. Highest) gives you a possible bottom (resp. top) of the price range.
🔹 RealTime TrendLine
As soon as the Decoder GreyBox has delivered its information i.e Range/Continuation/ReversalUp/ReversalDown and that a New High (resp. New Low) has been reached, the RealTime TrendLine starts to show the pace and the angle of the new movement based on a linear regression adanced concept.
The angles of the Projective and the RealTime TrendLine can be identical, telling you that the market moves smoothly in a global consensus. It can be a smart Trailing Stop Loss.
Or these angles can be very different and it will call your maximum attention. You might want to switch to a superior timeframe to get the bigger picture.
🔹 FiboLevels
Once a new Trend is signaled, the levels of Fibonnaci are automatically placed.
They are calculated on the last Highest and Lowest of the former movement.
Get our full method with BladeSCALPER and PowerZONES
Discover also TrendDECODER Scanner
✔️ Get at once TrendDECODER signals on multiple assets and multiple time frames
✔️ Identify the best time frame to enter the Trend
✔️ Maximize your profits and your winrate
📌 What is it about?
This screener is a complementary tool of our best-reviewed TrendDECODER.
It allows you to:
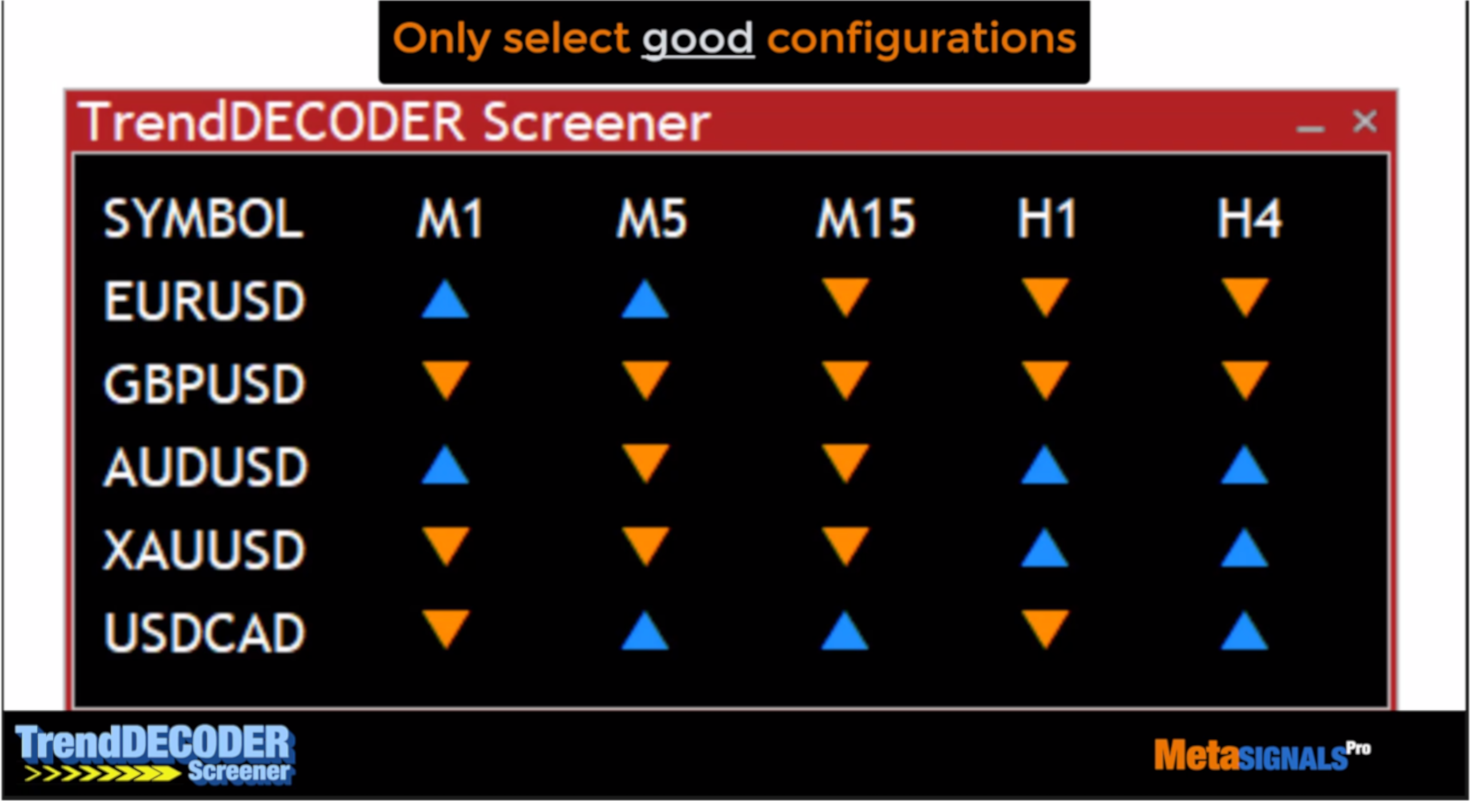
- get the current TrendUP and TrendDOWN signals of your favorite assets on all the relevant timeframes for your trading
- see immediately the most favorable timeframe configuration for a profitable Trendfollowing or Swing trade.
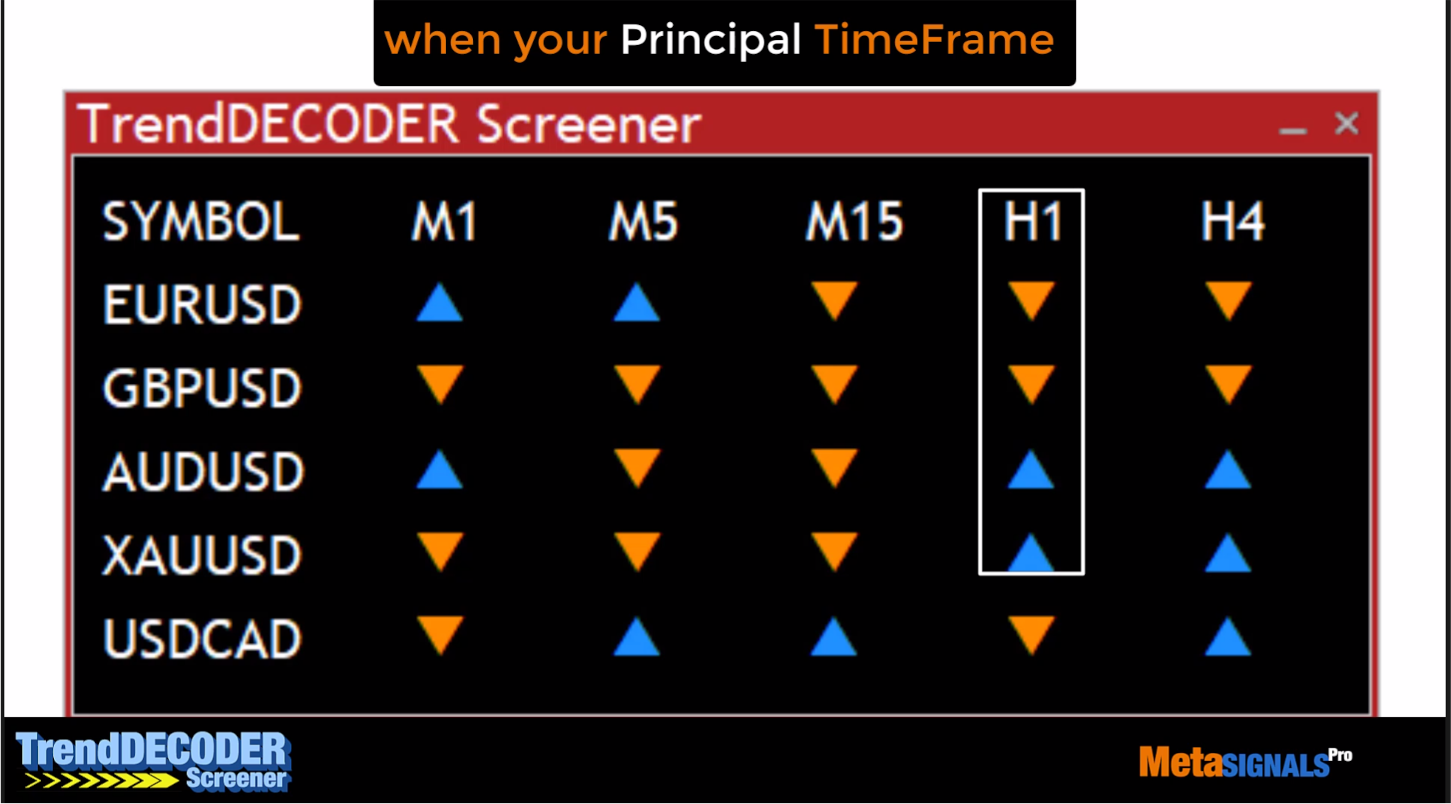
📌 What are these most favorable TimeFrame configurations?
- First, be sure you have a multi-timeframe chart setup: Lower / Main / Upper time unit
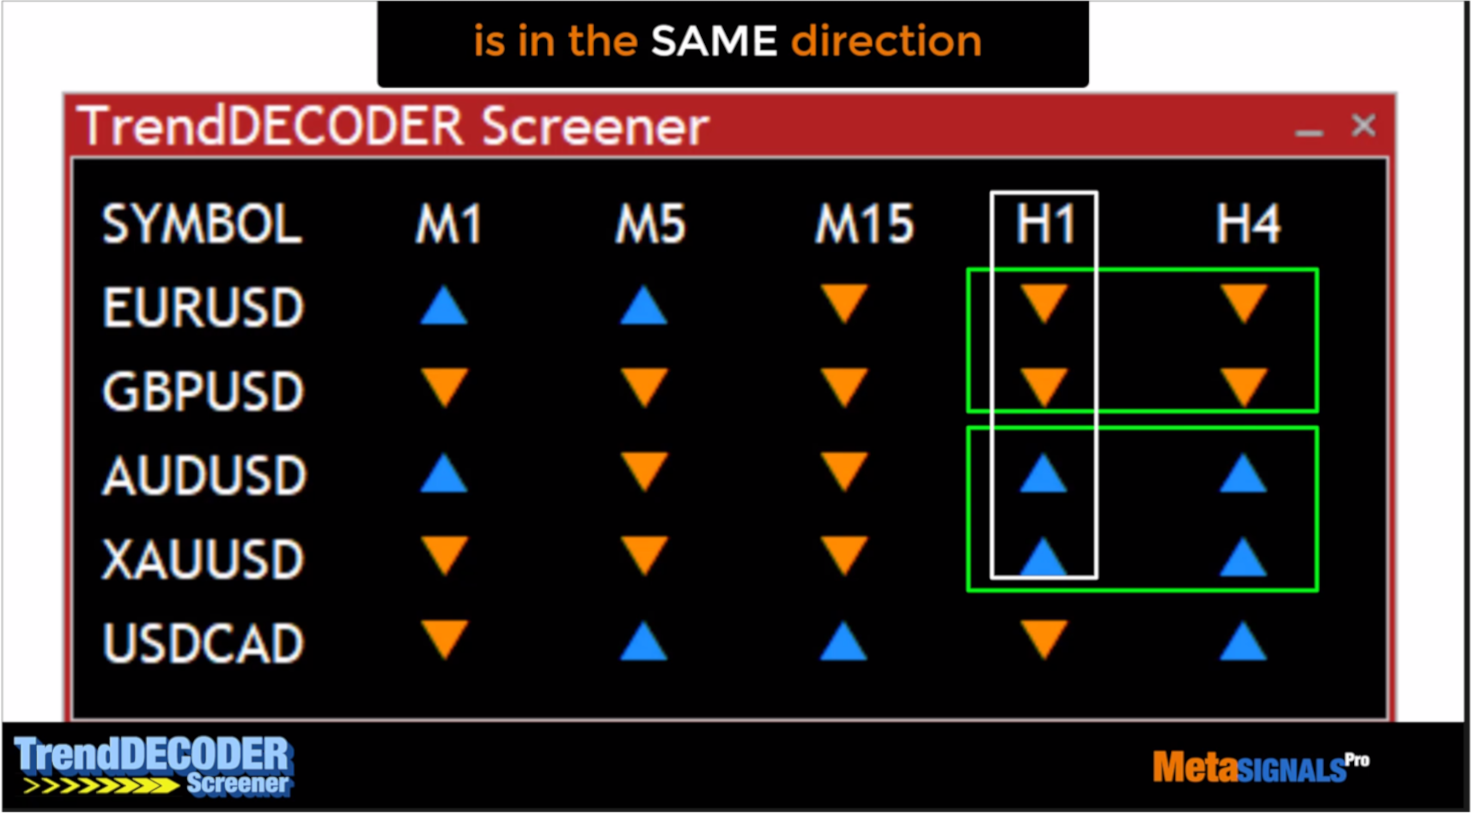
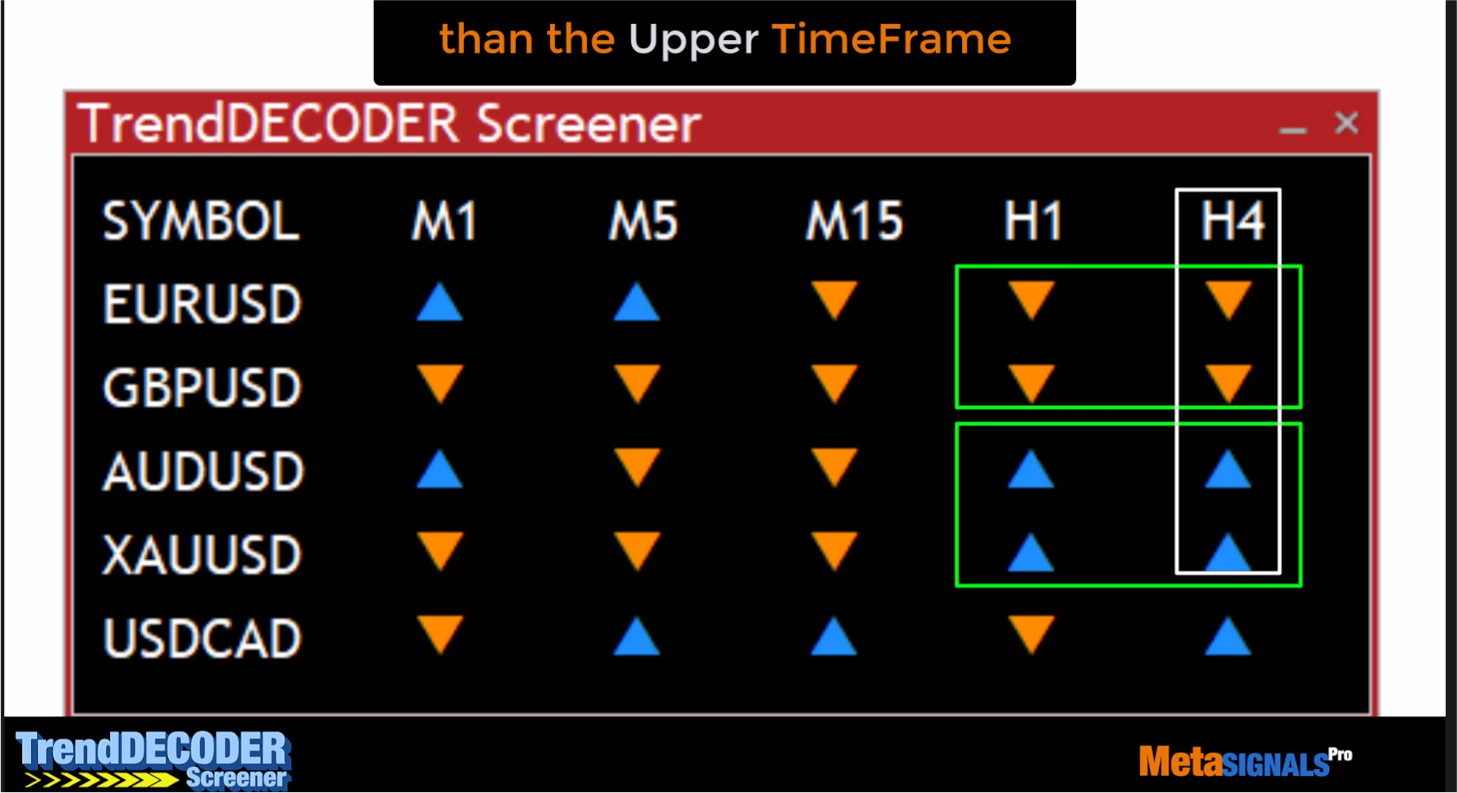
- Second, select the asset where your Main TimeFrame move in the same direction as the Upper TimeFrame.
📌 For which assets?
This is exactly the point. You will choose and focus on the assets that are relevant to you.
Special Tip: TrendDECODER Screener can also be a very synthetic way to check if correlated assets currently diverge or behave in a normal way (like Gold and Dollar for example).
📌 Concretely, how does it work and with which strategies?
Pretty simple:
- just plug the Screener on your current chart
- go in the configuration panel
- select your favorite Forex pairs or assets
- and the Timeframes you are trading on
Your TrendDECODER Screener is now visible on your current chart in the form of a dashboard.
- then click on a triangle of the dashboard, TrendDECODER Screener opens directly a new chart with a simplified version of TrendDECODER on it
- in seconds you can produce the 2 or 3 charts you need to consider entering the market.
Of course, TrendDECODER is available to time precisely:
- your Entries
- your Take Profit thanks to the FiboLevels
- your exits, thanks to the RealTime TrendLine crossings
Please check why and how our innovative global method will help you maximize your profits and minimize your risk. Meta METHOD
- see how the strategic levels of PowerZONES with its embedded RiskReward ratio can dramatically improve your trading safety
- and see how BladeSCALPER and its detection of double bottoms and double tops can confirm and maximize your probability of winning trades combined with TrendDECODER


")
