

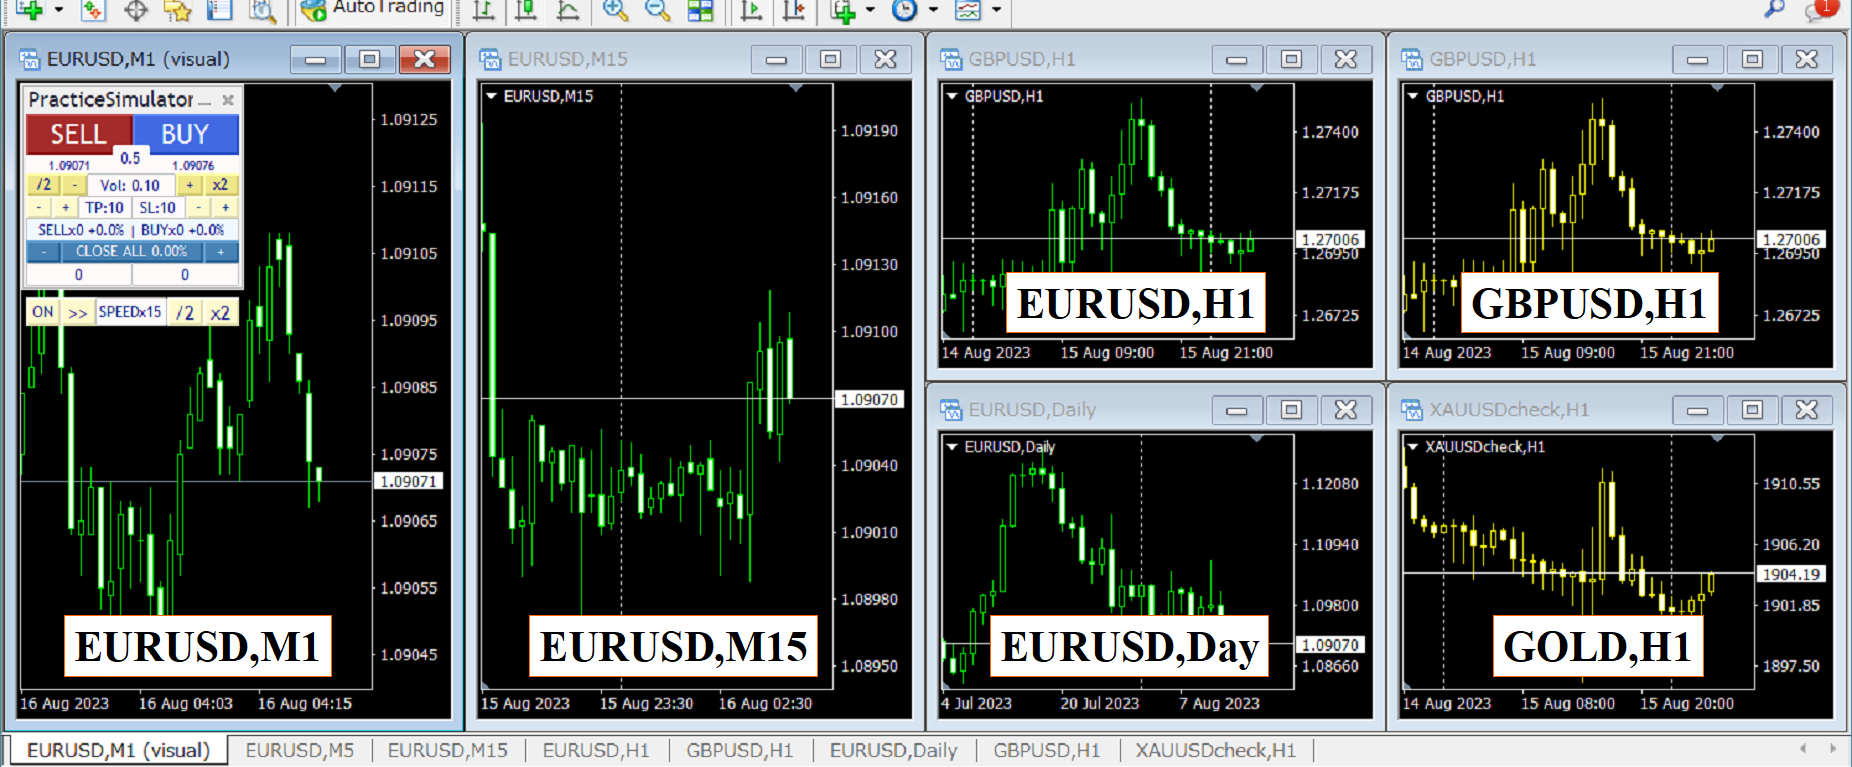
"Practice Simulator Sync" is an add-on that synchronizes with "Practice Simulator" to display chart time and position information. It works not only for the same currency pair but also synchronizes across different timeframes and currency pairs.
Products Link:
Practice Simulator: The core module for trade practice
Download Page | Setup & User Guide
Practice Simulator Sync: Optional module for chart synchronization.
Download Page | Setup & User Guide
Demonstration Images :
Important:
To create a synchronised chart, historical data from the same period as the main chart is required. This applies to different timeframes and currency pairs as well.
Two synchronisation modes are available
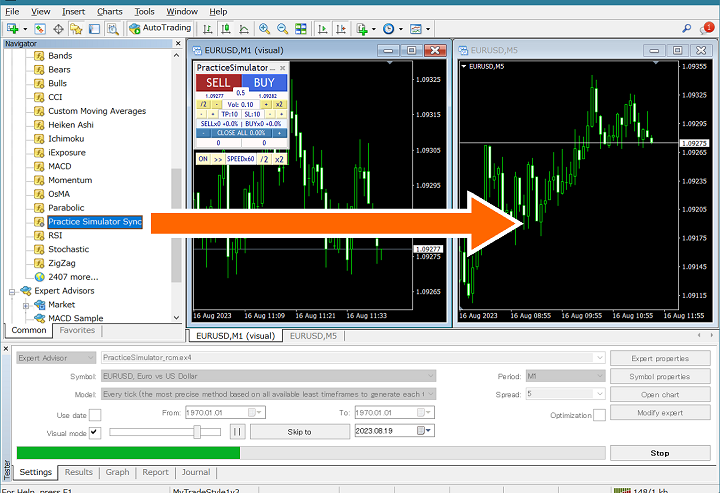
1.Simple synchronisation mode:
Creating a synchronised chart is simple. Just insert this tool into the chart you want to synchronise. The chart time is synchronised with the main chart, and any period beyond the synchronisation point is hidden.
As a result, when using chart shift or sub-windows, future periods beyond the synchronisation point may sometimes be visible.
2.Active synchronisation mode:
Use offline charts to generate synchronised charts. This process is slightly more complex but can replicate price movements similar to an online chart.
Parameters
Zoom Sync: Synchronised expansion/contraction
Chart shift: Margins on the right side of the chart when chart shift is off
Sync Period: synchronous cycle (millisecond)
margin of top/bottom: Percentage of blank space tooand below
Smooth rendering: Smoothly moves TP/SL lines (false if slow)
Procedure for creating synchronised charts
1. Create a simple synchronisation chart
Open the chart you want to synchronise and add Practice Simulator Sync.
2. Create an active synchronised chart
Create a simple synchronisation chart with the desired currency pair and timeframe. An offline chart starting with "_" will be generated—open it to proceed.
Example: EURUSD15 => _EURUSD15
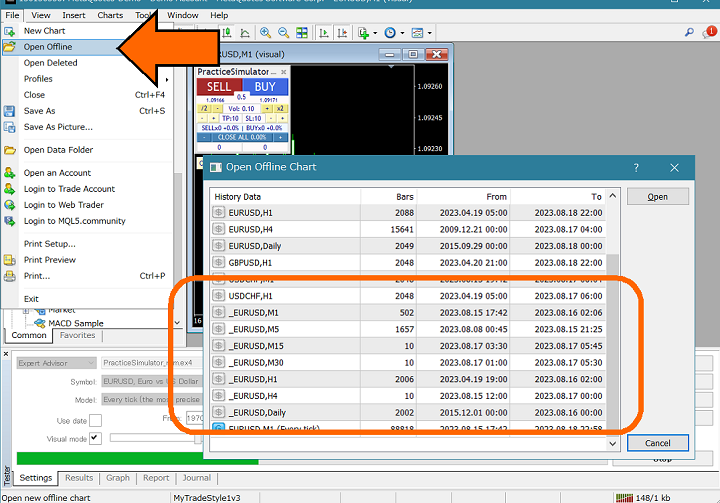
Add Practice Simulator Sync to the chart.
If there is no offline chart starting with "_", create a new simple synchronised chart with the desired currency pair and timeframe.


