GBPCAD Ready for a Bullish Move - TRADING WITH WEIS WAVE WITH SPEED INDEX

Setup 1Hour Chart
Indicators: Weis Pip Wave, Weis Wave with Alert (+Speed Index) and No Demand No Supply ( https://www.mql5.com/en/users/takisd/seller)
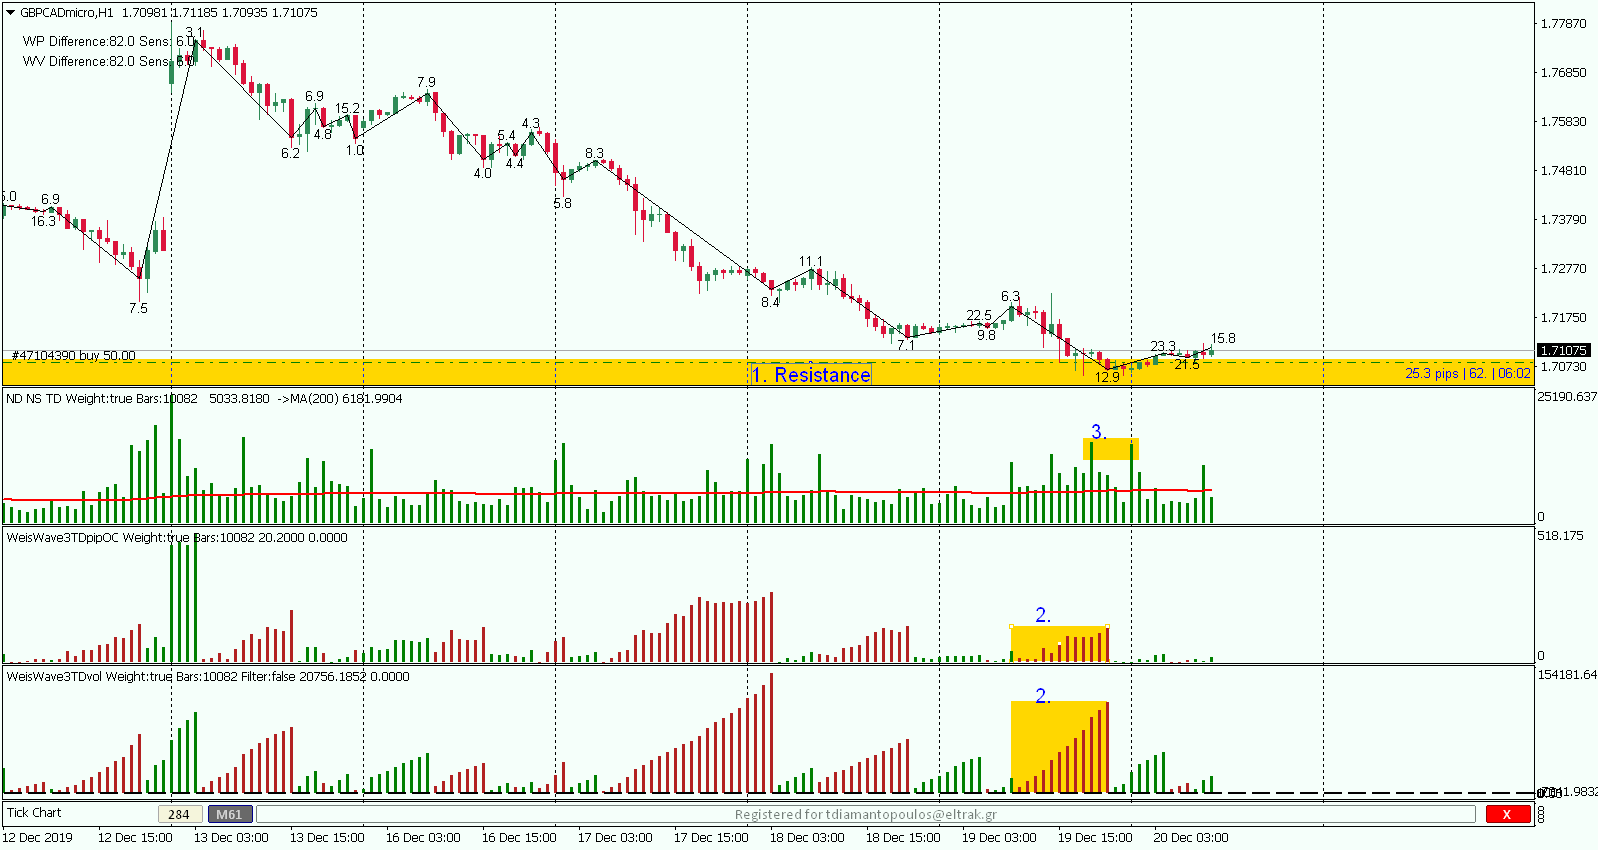
This is Why the Forecast notes for a Bullish Move.
1. Hit Resistance
2. High Down Volume Wave without the respective pip move. There were buyers on the way down. Abnormal SI at the bottom 23.3, 21.5.
3. High volume bars at the bottom
There are still some sellers there but I believe buyers will win. Let's see it happen!!!
to be continued...
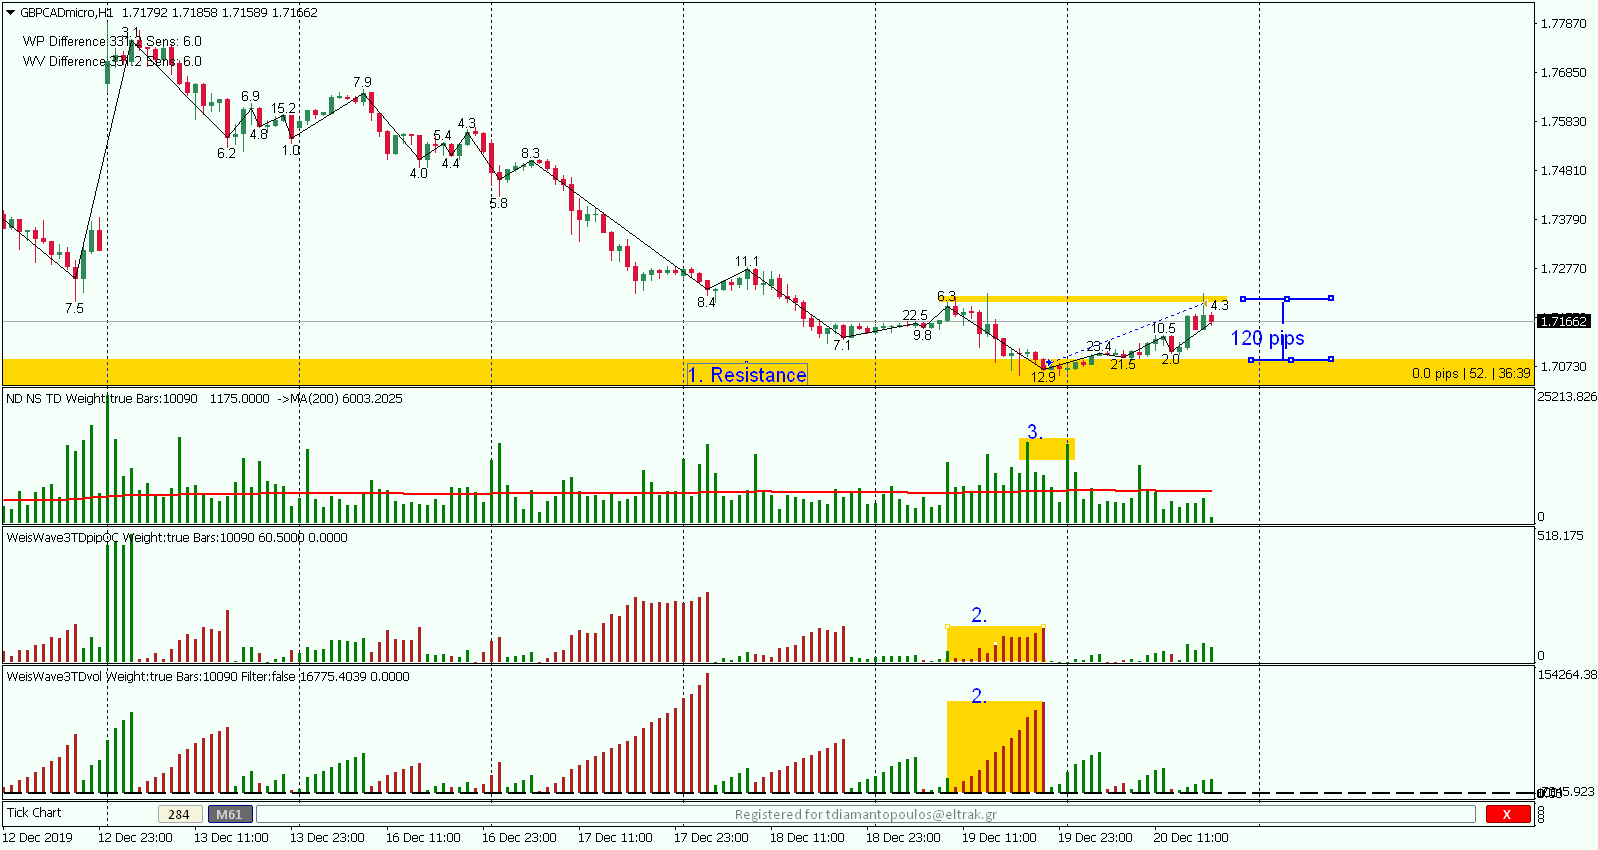
Update: 20/12/2019 18:24 EET (see chart below)
What did I tell you, time for a bullish move. The move was 120pips for me, my order is visible on chart!
Am I a magician? NO!
Am I a fortune teller? NO!
I am just a regular guy but able to read the charts using these tools. It takes time and patience but once you get it, you can forecast much more accurately what is going to happen.