

Introduction
The 60 Seconds Strategy With BinaryM Indicator consist of detail ScreenShot on how to Keep tracks of the Price ticks for the use of Binary Option Trading.
Installation
https://www.mql5.com/en/market/product/28030
Click Here to Download the file
- or if you need help with Installation, message me here https://www.mql5.com/en/users/yesmrsamuel/messages
- or read this https://www.mql5.com/en/blogs/post/723097
Chart Preparation
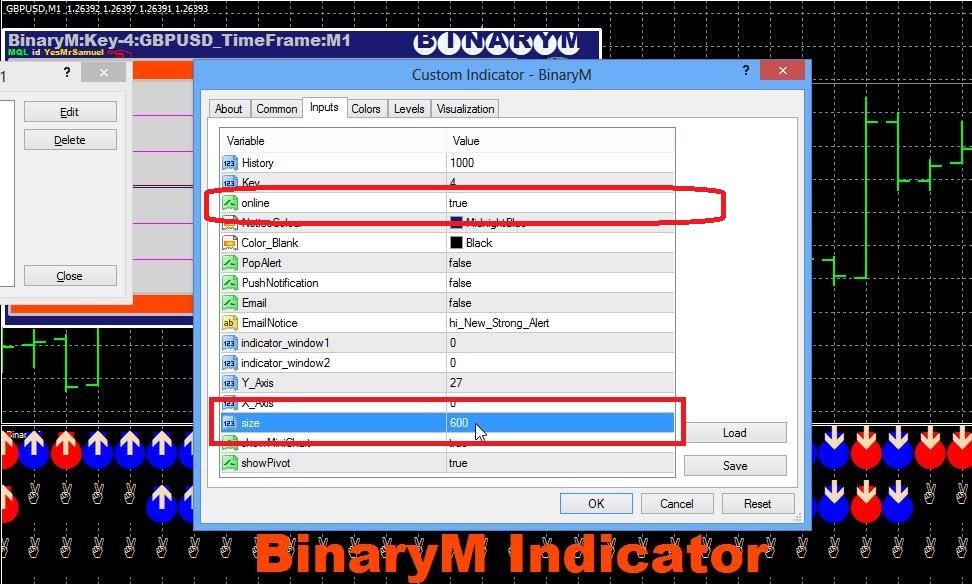
- Make sure the MiniChart is Widely shown on your computer Screen if Not Adjust the "size" from input parameter with BinaryM Indicator on your MetaTrader.
- Also Make sure "Online" is true.
Best Session for this strategy is London Session and New York Session
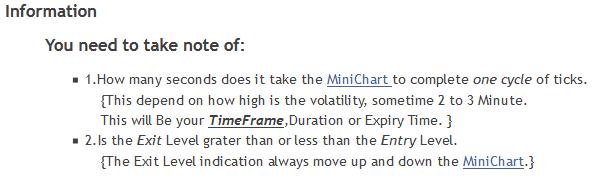
Information
You need to take note of:
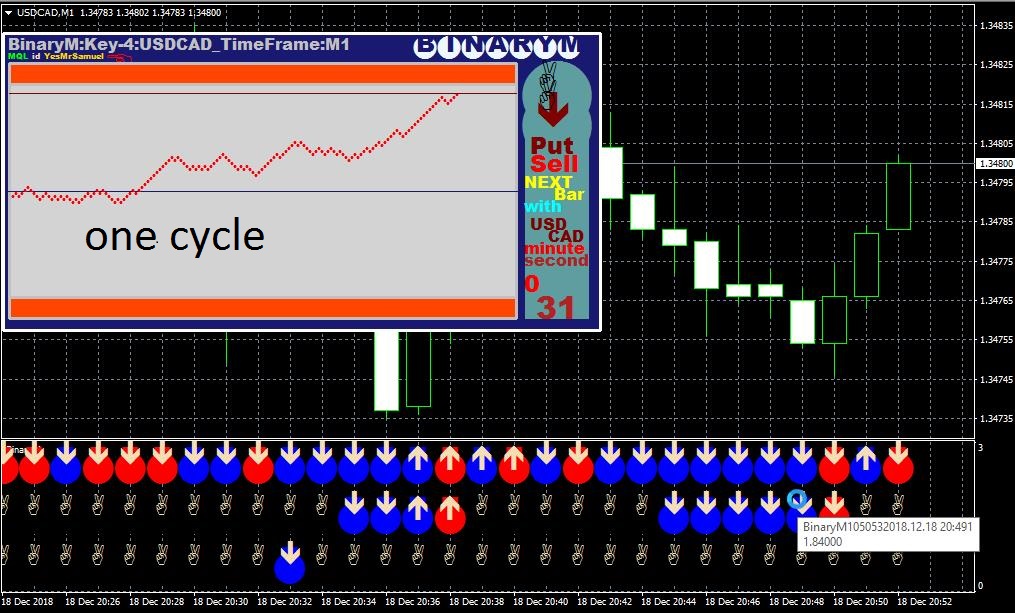
- 1.How many seconds does it take the MiniChart to complete one cycle of ticks.
{This depend on how high is the volatility, sometime 2 to 3 Minute.
This will Be your TimeFrame,Duration or Expiry Time. }- 2.Is the Exit Level grater than or less than the Entry Level.
{The Exit Level indication always move up and down the MiniChart.}

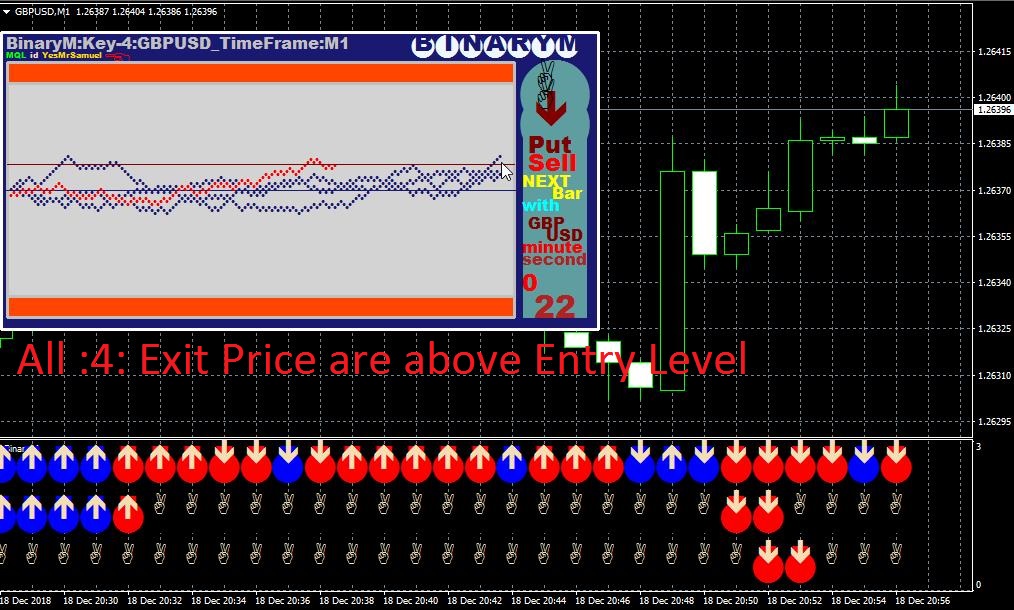
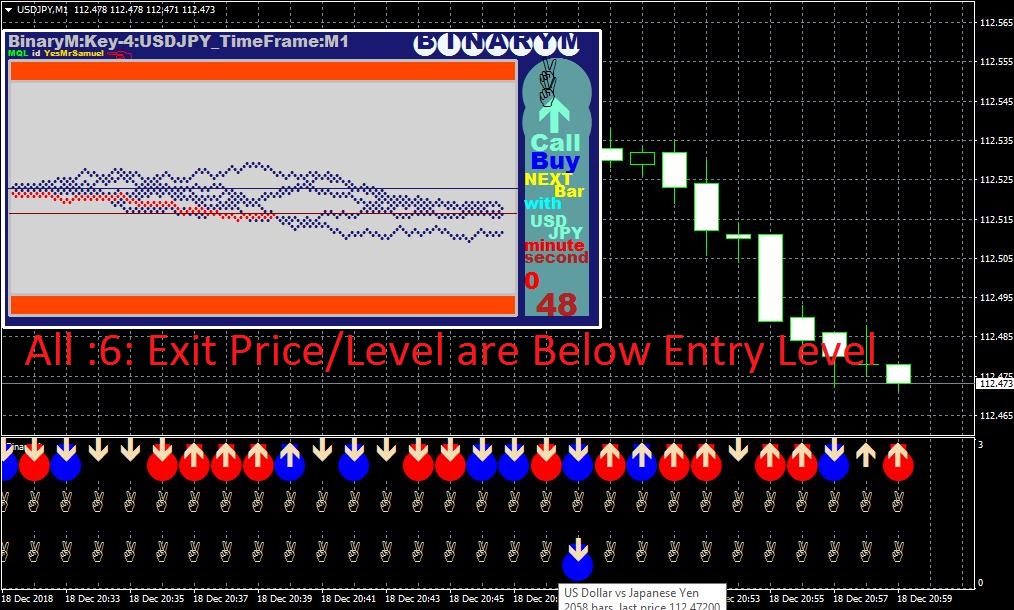
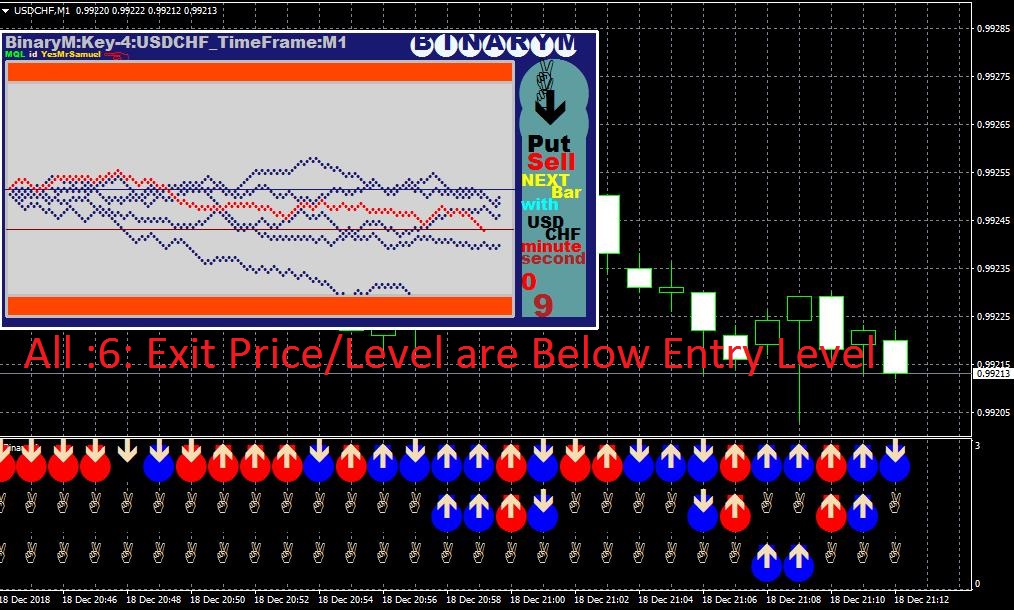
Call and Put Instructions
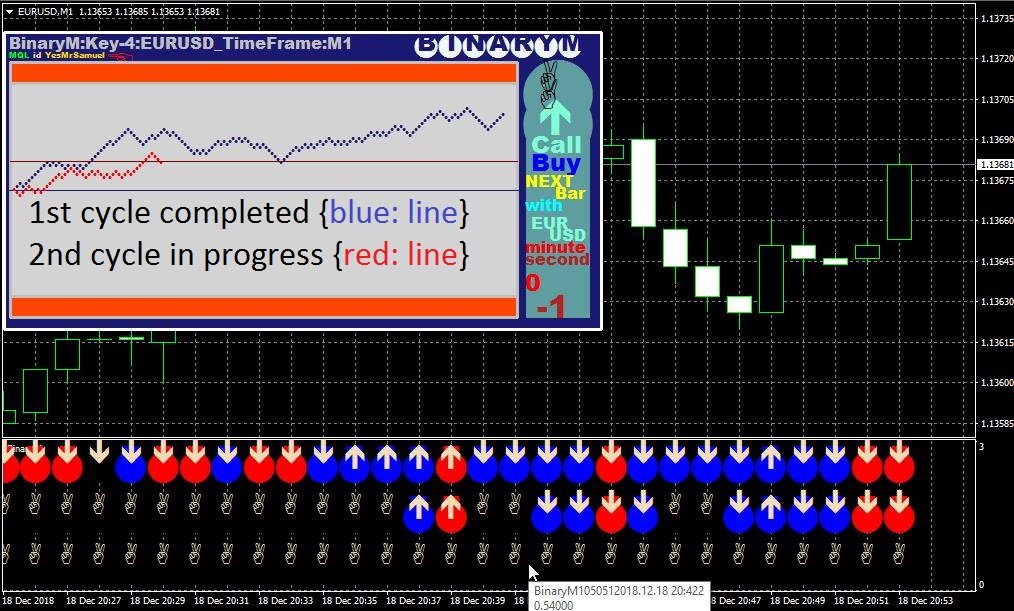
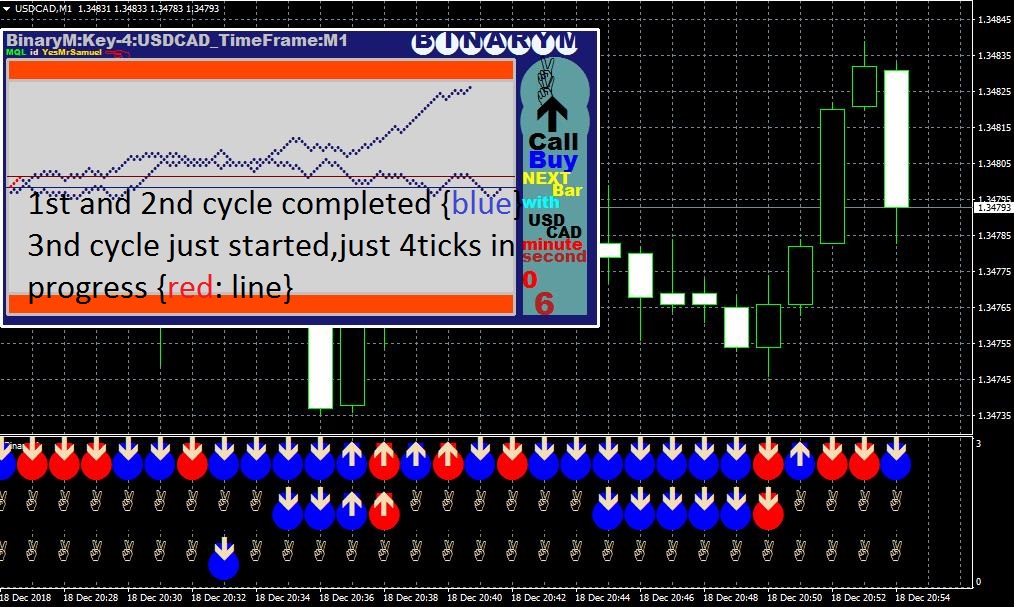
- if the 1st and 2nd cycle completed above Entry Level,
- Place A CALL Option with your binary Broker using the noted TimeFrame,Duration or Expiry Time.
- if the 1st and 2nd cycle completed below Entry Level,
- Place A PUT Option with your binary Broker using the noted TimeFrame,Duration or Expiry Time.
Examples
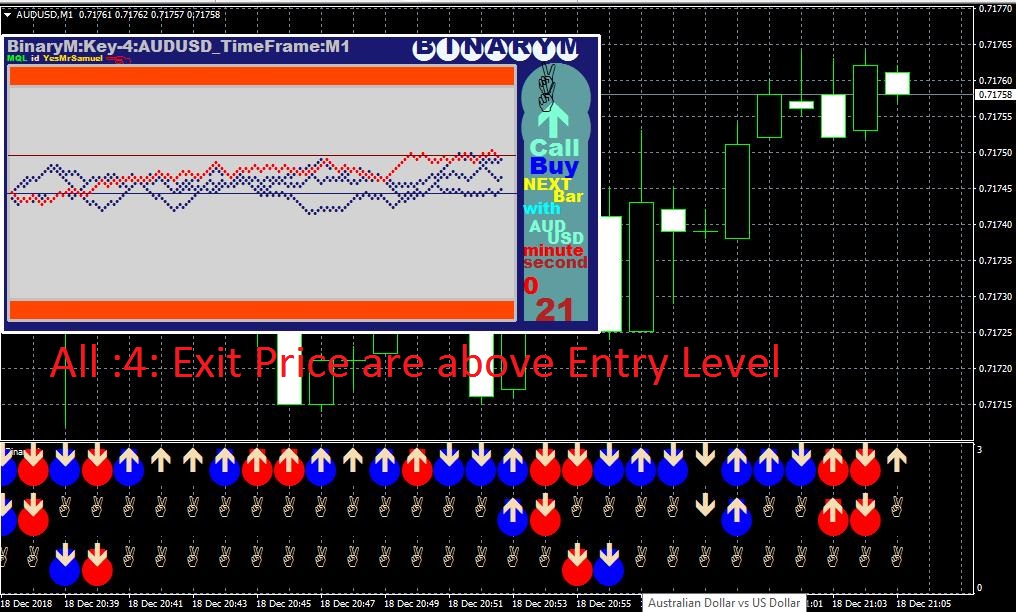
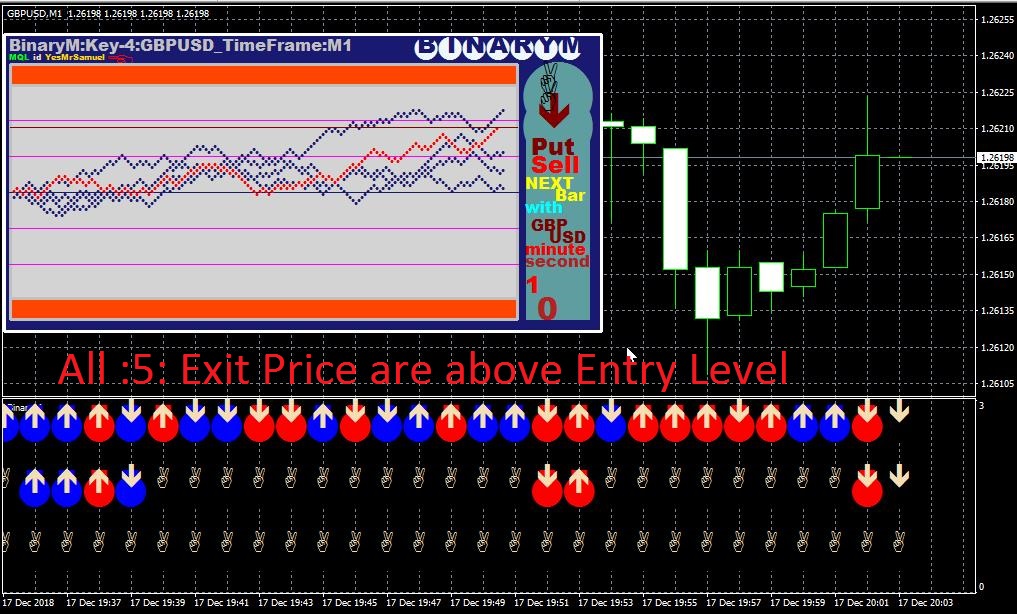
Notice
- Entry Price = Entry Level.
- Exit Price = Exit Level,


