INNOVATIVE
TREND INDICATOR
![]()
A Breakthrough Algorithm For Trend Detection!
Follow 3 EASY STEPS That Can Change
The Way You Trade FOREVER
YOUR BENEFITS!
A Multi-Timeframe And Multi-Currency Scanner Is Available To Our Loyal Clients!
Maximize The Tool's Potential And Have The Ability To Monitor ALL Markets & Timeframes In 1 Chart
WANT TO GET THE SCANNER FOR FREE? Please Read The Whole Page For Further Details
WHY CHOOSE US?
With more than 100,000 Verified Downloads on MQL5 and growing...
Products with the Highest NUMBER OF POSITIVE REVIEWS...THOUSANDS of SATISFIED and RETURNING clients...
PipFinite has proven itself to be ONE OF THE BEST providers of trading tools!
Now Is Your Chance To Join our exclusive community and benefit from the services we offer.
![]()
HOW TO TRADE
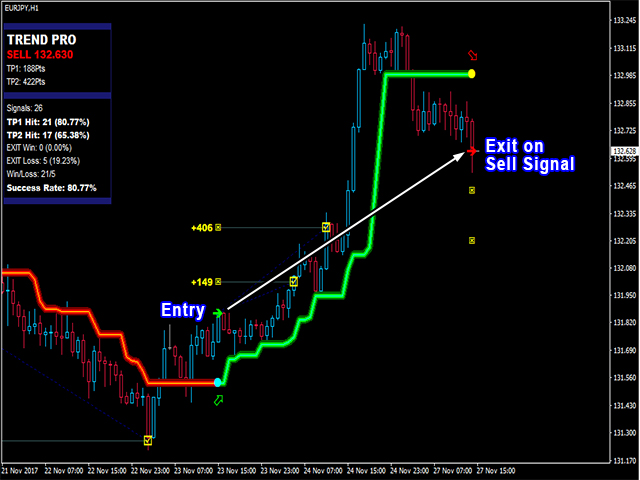
Step 1: New Buy Signal & Success Rate is higher than 65%
Step 2: Determine your StopLoss
- Option 1: Opposite Signal
- Option 2: Support & Resistance levels
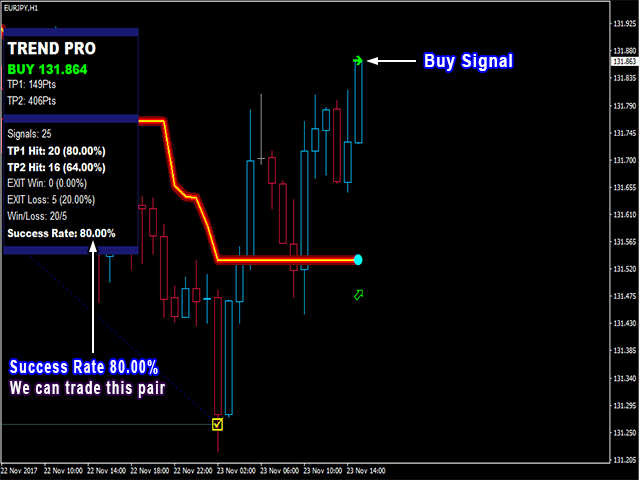
Step 3: Determine your TakeProfit Strategy
Option 1: 100% TakeProfit on TP1
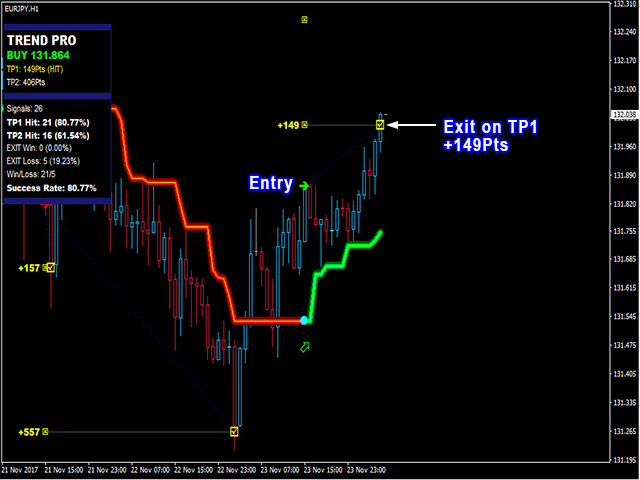
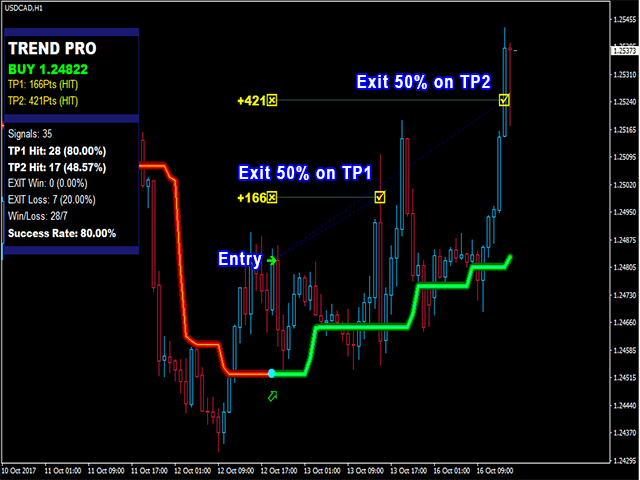
Option 2: 50% partial takeprofit on TP1 & close remaining 50% on TP2.
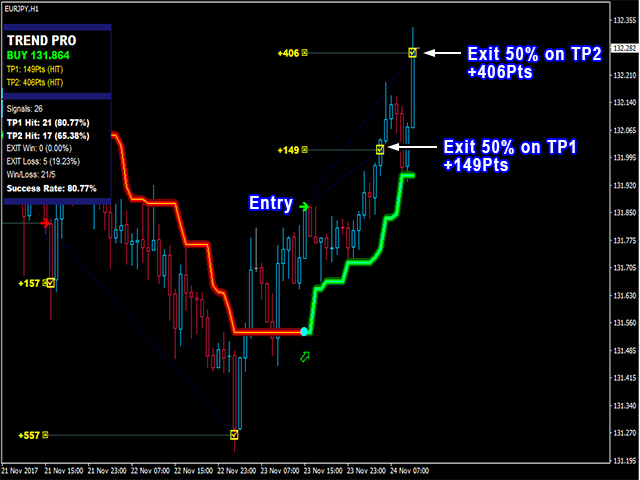
Option 3: 100% takeprofit on opposite signal or riding the trend until it reverses.
![]()
SELL SETUP
Step 1: New Sell Signal & Success Rate is higher than 65%
Step 2: Determine your StopLoss
- Option 1: Opposite Signal
- Option 2: Support & Resistance levels
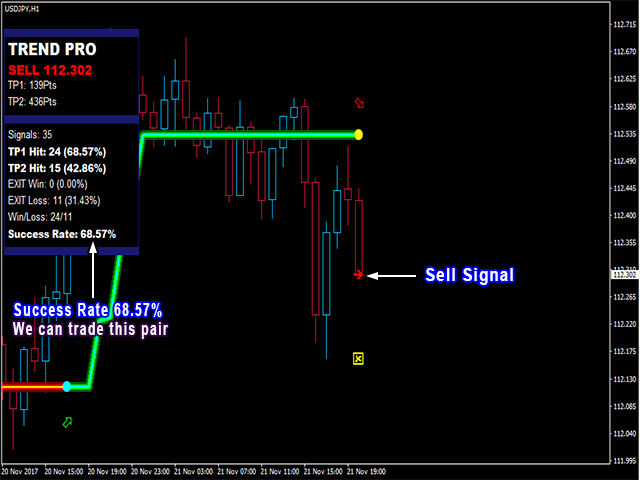
Step 3: Determine your TakeProfit Strategy
Option 1: 100% TakeProfit on TP1
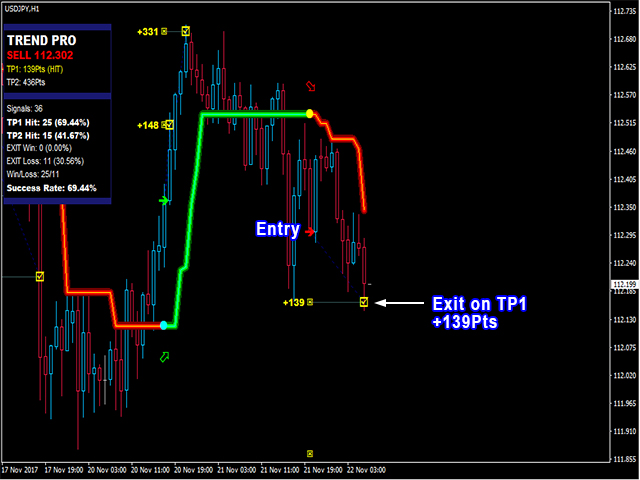
Option 2: 50% partial takeprofit on TP1 & close remaining 50% on TP2.
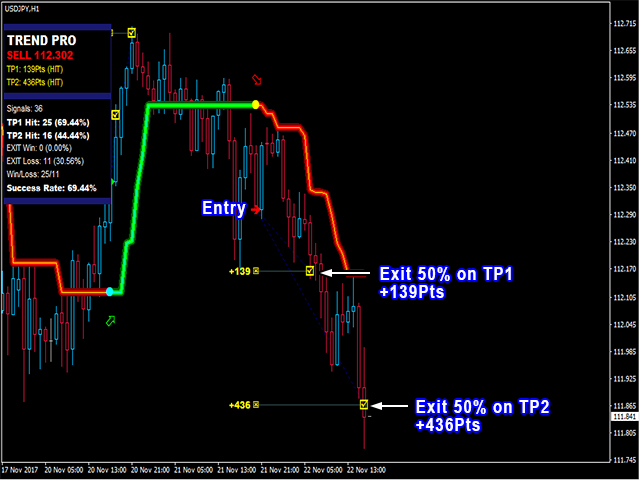
Option 3: 100% takeprofit on opposite signal or riding the trend until it reverses.
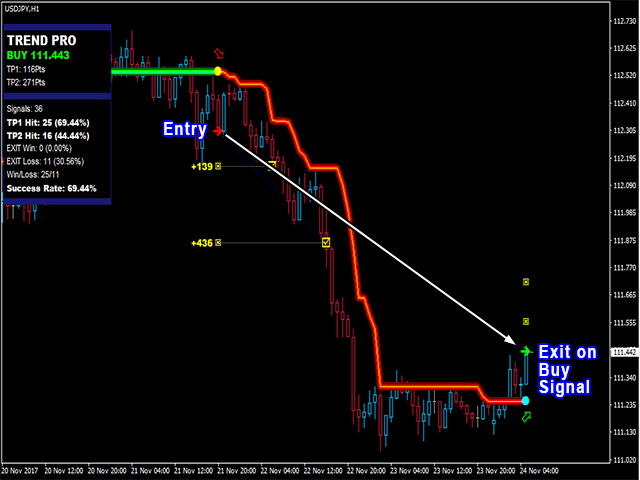
For takeprofit strategy explanation, please read the "TAKEPROFIT STRATEGY BREAKDOWN" Section
![]()
MULTI TIMEFRAME APPLICATION
You can watch the video in this link ==> https://youtu.be/GXN0P2_uwjk?t=4m42s
BUY SETUP
Step 1: Higher timeframe is Uptrend. Only look for Buy signals on lower timeframe
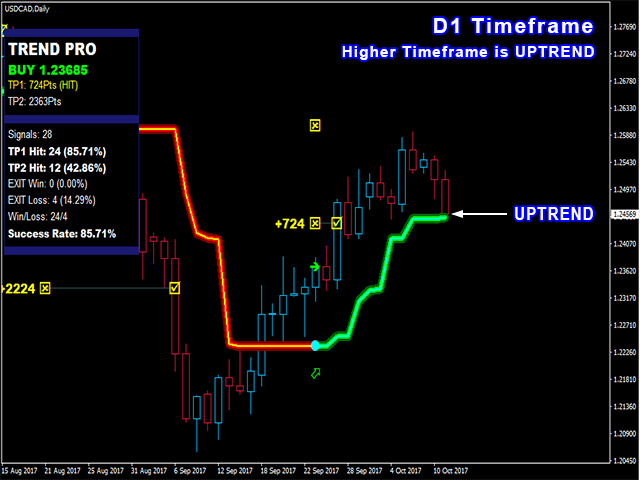
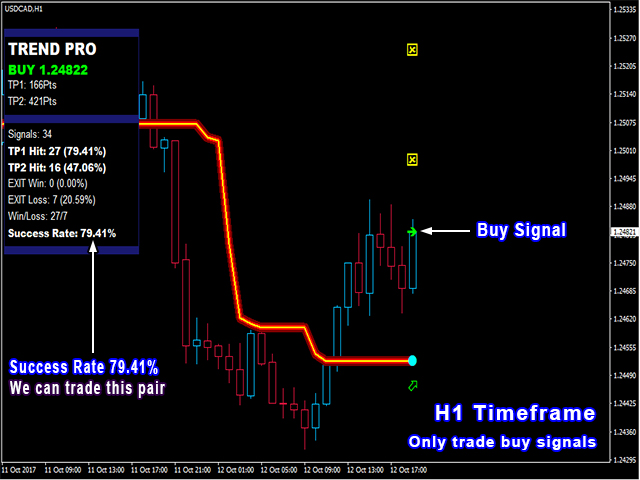
Step 2: Lower timeframe Success Rate is higher than 65%
Step 3: Lower timeframe New Buy Signal
Step 4: Determine your StopLoss
Step 5: Determine your TakeProfit Strategy
![]()
SELL SETUP
Step 1: Higher timeframe is Downtrend. Only look for Sell signals on lower timeframe
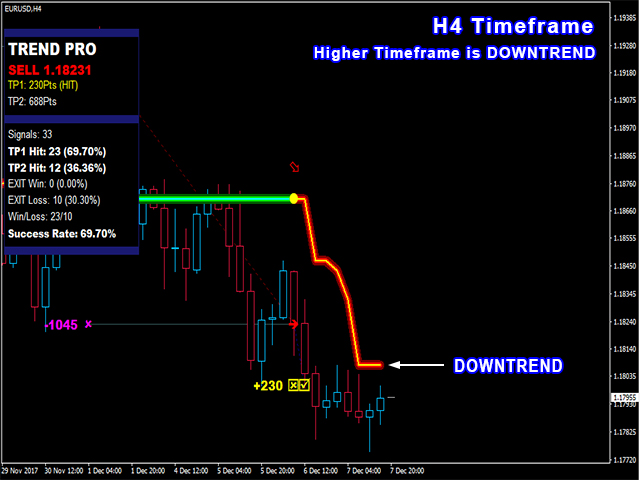
Step 2: Lower timeframe Success Rate is higher than 65%
Step 3: Lower timeframe New Sell Signal
Step 4: Determine your StopLoss
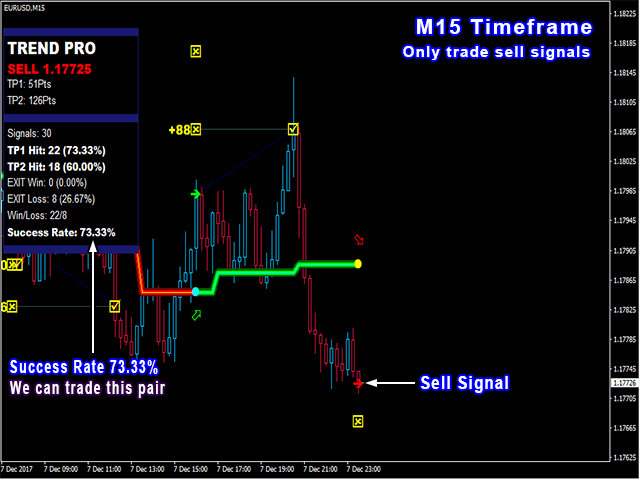
Step 5: Determine your TakeProfit Strategy
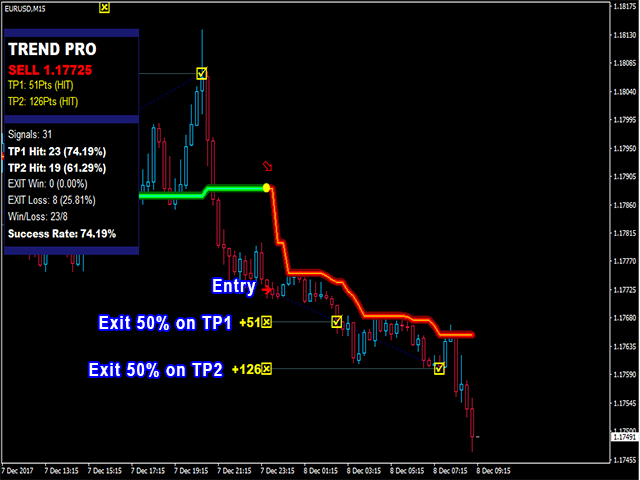
For timeframe suggestion, please read the "MULTI TIMEFRAME SELECTION" Section
![]()
MULTI-CURRENCY & MULTI-TIMEFRAME SCANNER
A New Solution Which Gives Traders The Ability To Monitor ALL Markets & ALL Timeframes In 1 Chart
Simplify Your Workflow, No need to open many charts and timeframes to check if there is a setup!
You can watch the video in this link ==> https://youtu.be/nZyTqA-VB9E
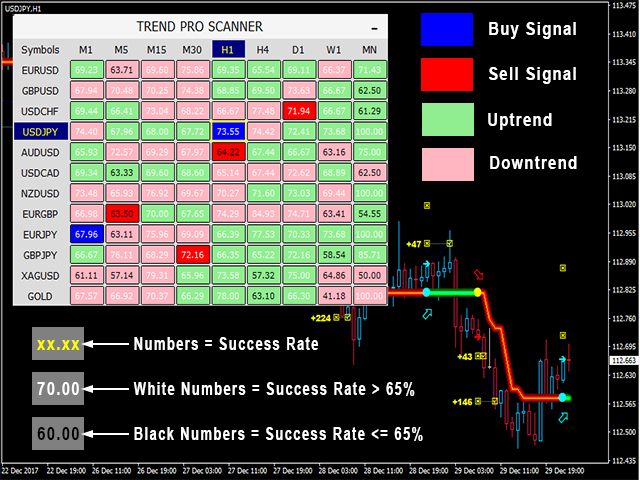
THE INTUITIVE INTERFACE
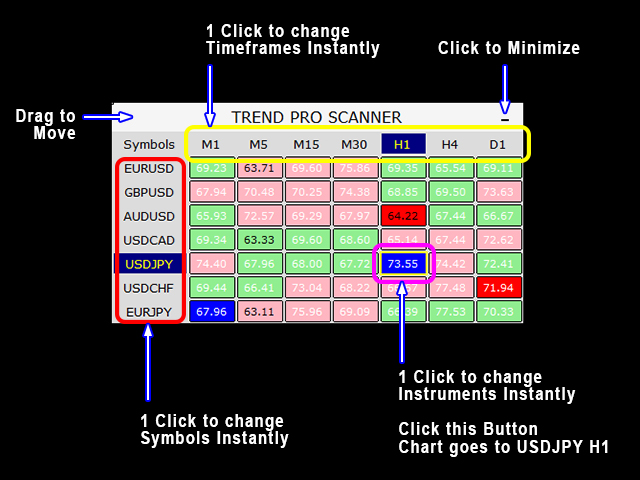
Blue Boxes - Buy Signal
Red Boxes - Sell Signal
Green Boxes - Uptrend
Pink Boxes - Downtrend
Numbers Inside Box - Success Rate
- White Numbers - Success Rate > 65%. You can trade this instrument
- Black Numbers - Success Rate <= 65%. Don't trade this instrument
USER FRIENDLY OPTIONS
You can easily drag the scanner to the desired location.
You can minimize the scanner to view your charts better.
EASY NAVIGATION FEATURE
Allows you navigate across different instruments with 1 click, in just 1 chart.
- Change the current pair
- Move effortlessly to different timeframes
- Instantly switch to your desired instrument
FLEXIBILITY
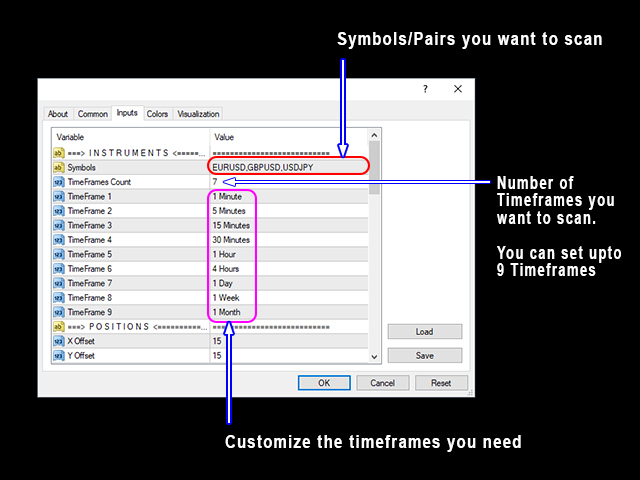
You can add ANY symbol that exist in your platform.
- Symbols - Type the symbols separated by comma ","
- Example: EURUSD,GBPUSD,AUDUSD,XAUUSD
You can select up to 9 different timeframes
- Timeframes Count - The number of timeframes you want to monitor
INTEGRATED ALERTS
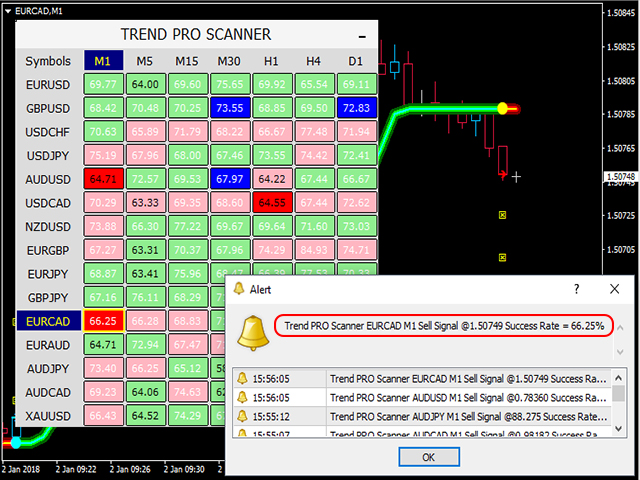
The scanner alerts you when there is a setup to the instruments you are monitoring!
Popup, Sound, Email and Push Notifications available. NEVER MISS A TRADE SETUP AGAIN!
![]()
LIMITED OFFER
Original Price: 149$
Discounted Price: 98$
Save 51$ When you purchase NOW!
CHECK THE LINK BELOW TO PURCHASE WITH DISCOUNT
MT4 > CLICK
HERE < MT4
MT5 > CLICK
HERE < MT5
HOW TO GET THE FREE TREND PRO SCANNER
TAKE ADVANTAGE & SAVE 249$

For more information,
Please contact us via MQL5 Personal Message /
support@pipfinite.com
![]()
LIVE TRADE EXAMPLES
EXAMPLE 1
- Ideal Setup: USDJPY M15 Sell Signal and Success Rate is 67.74
- Check Higher TF: H4 is Downtrend
We Can Trade The Sell Signal
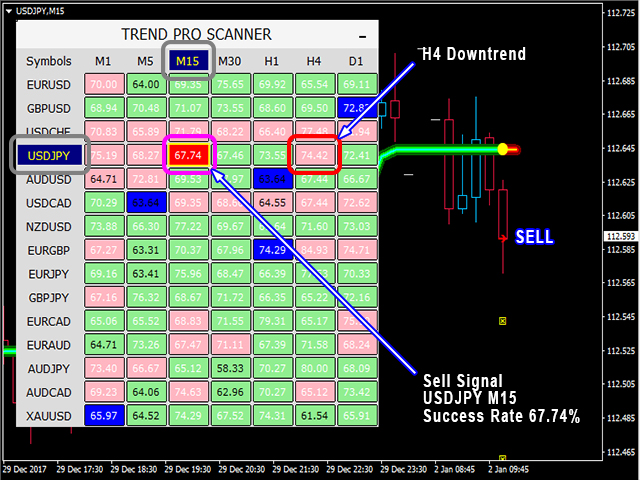
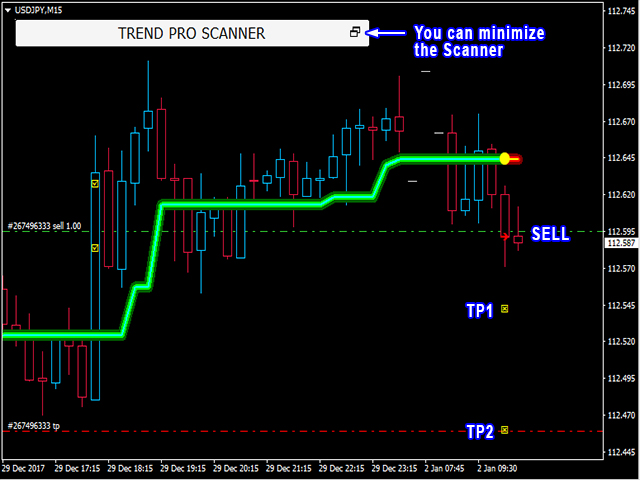
Lets Apply Option 2 For TakeProfit Strategy
- Partial Close trade on TP1
- Close all trades on TP2
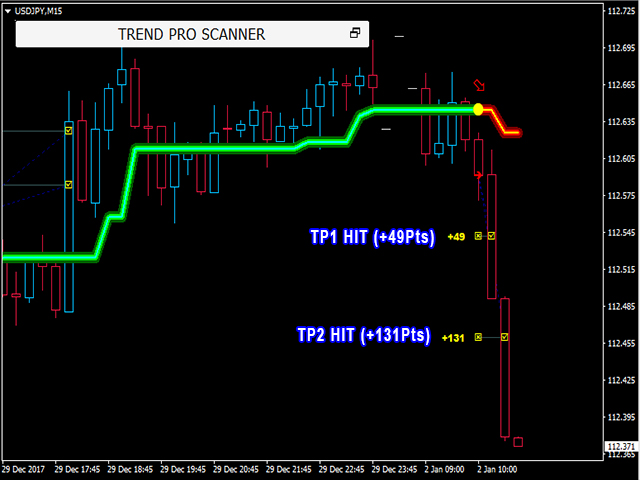
Trade Was Successful
- TP1 Hit +49pts
- TP2 Hit +131pts
![]()
TAKEPROFIT STRATEGY BREAKDOWN
Option 1: 100% TakeProfit on TP1
- Higher probability but less profit
- Ideal for ranging market conditions
- Market ranges 70% on average. A quick exit will ensure that we book profits and avoid reversals.
- Conservative approach and recommended for scalping
Option 2: 50% Partial TakeProfit on TP1 & close remaining 50% on TP2.
- Moderate probability & profit.
- Ideal for swinging conditions (Moderate trends and moderate ranging conditions) which happens 50% on average.
- General recommendation because of a good balance between profit and probability.
- Lower probability but higher profit since a strong trend will generate big rewards.
- Ideal for trending market conditions ONLY.
- Market only trend 30% of the time. Most trades closed in the opposite signal results to a loss.
- Recommended for advance traders who can identify strong trends to unfold.
![]()
PAIR & SYMBOL SELECTION
Works in any pair or symbol, below are suggestions:
- Trade pairs with the highest "Success Rate" value.
- Ideal Success Rate is greater than 65%
- Pairs you are more familiar in trading
- Most traders go for major pairs like EURUSD, GBPUSD, USDCHF, USDJPY...etc
- Pairs with lower spreads, specially when used on timeframes lower than H1
TIMEFRAME SELECTION
Works in any timeframe, below are suggestions:
- M15 for scalping
- H1 for day trading
- H4 for swing trading
- D1 for long term trading
MULTI TIMEFRAME SELECTION
When multi-timeframe application is used, below are suggested combinations.
- M1 Lower timeframe & M15 Higher timeframe
- M5 Lower timeframe & H1 Higher timeframe
- M15 Lower timeframe & H4 Higher timeframe
- M30 Lower timeframe & H4 Higher timeframe
- H1 Lower timeframe & D1 Higher timeframe
- H4 Lower timeframe & D1 Higher timeframe
- D1 Lower timeframe & W1 Higher timeframe
Lower timeframe is used to enter trades
Higher timeframe is used as main trend filter
![]()
STATISTICS
- Signals - total number of signals
- TP1 Hit - percentage of signals that hit TP1
- TP2 Hit - percentage of signals that hit TP2
- Exit Win - percentage of signals that did NOT hit TP1 or TP2 and closed on opposite signal with positive profit
- Exit Loss - percentage of signals that did NOT hit TP1 or TP2 and closed on opposite signal with negative profit
- Wins - total number of wins
- Loss - total number of losses
- Success Rate - percentage of winning trades
STATISTICS CALCULATION
Win Condition
- TP1 Hit - when a signal reaches at least TP1.
- EXIT Win - When a trade is closed on opposite signal and resulted to a positive profit.
Loss Condition
- Exit Loss - When trade is closed on the opposite signal and resulted to a negative profit.
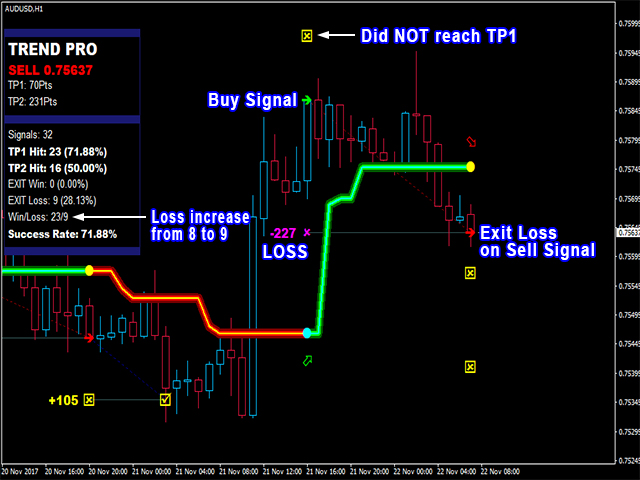
Example of Losing Trade
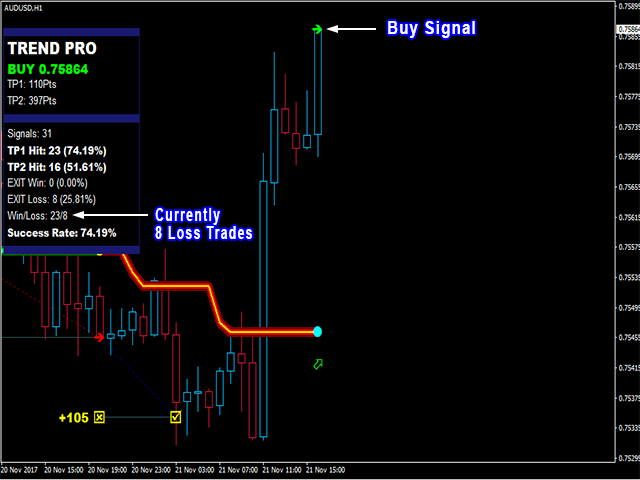
Trade did NOT reach TP1 and closed on opposite signal with Loss
![]()
INDICATOR PARAMETERS
- Period - the number of bars used to calculate the trend.
- Period - 2 to 5 when used in entering trades (Entry Indicator).
- Period - 6 to 15 when used to filter trades (Filter Indicator).
- Target Factor - the multiplier used to calculate take profit levels.
- Increasing this value will give more take profit but decreases success rate.
- Decreasing this value will gives less profit but increases success rate.
- Target Factor - 1.50 to 1.80 for quick trades and scalping
- Target Factor - 2.00 to 3.00 for long term and trend trading
- Maximum History Bars - maximum number of bars used.
MISC PARAMETERS - controls the universal settings. FOR DEVELOPER/CODER PURPOSES ONLY.
- Universal Draw Buffers - Enable/Disable all buffers drawn on chart.
- Universal Draw Objects - Enable/Disable all objects drawn on chart.
- Universal Delete Objects - Enable/Disable all objects to be deleted on chart.
- Universal Enable Alerts - Enable/Disable all alerts to be triggered
DISPLAY PARAMETERS - controls the visibility of objects drawn on chart.
- Show Trend Arrows - show/hide trend direction arrows
- Show Entry Arrows - show/hide entry point arrows
- Show TP Targets - show/hide TP arrows
- Show TP Hit Line - show/hide TP Hit lines
- Show TP Tracking Line - show/hide line from Entry to TP
- Show EXIT Targets - show/hide EXIT arrows
- Show EXIT Hit Line - show/hide EXIT Hit lines
- Show EXIT Tracking Line - show/hide line from entry to exit
- Show Profit - show/hide profit/loss
- Profit Font Size - text size of profit
- Visual Mode - Enable 3D colors
- Charts To Foreground - force charts to be drawn on top of all objects
GRAPHICS PARAMETERS - controls the appearance and colors of drawn objects on chart.
- Uptrend Line - color of uptrend
- Downtrend Line - color of downtrend
- Buy Entry - color of buy entry arrow
- Sell Entry - color of sell entry arrow
- TP1 - color of TP1 arrow
- TP2 - color of TP2 arrow
- TP Hit - color of TP hit arrow
- EXIT Win - color of Exit win arrow
- EXIT Loss - color of Exit loss arrow
- TP Hit Line - color of TP hit line
- TP Tracking Line - color of line from Entry to TP
- EXIT Hit Line - color of Exit hit line
- EXIT Tracking Line - color of line from Entry to Exit
- Positive Profit - color of winning trades
- Negative Profit - color of losing trades
DASHBOARD PARAMETERS - controls the visibility and colors of statistics found on chart.
- Show Dashboard - show/hide information dashboard
- Show Dashboard Background - show/hide dashboard background box
- Dashboard Font Size - Text size for statistics.
- Dashboard X-Offset - Distance of statistics horizontally. Increase value to move it to the right (Ex. 100 to 1000).
- Dashboard Y-Offset - Distance of statistics vertically. Increase value to move it lower (Ex. 100 to 1000).
- Dashboard Y-Spacing - factor used as row distance.
- Dashboard Background X-Size - size of dashboard background.
- Dashboard Background - color of dashboard
- Auto Color Dashboard Background - use the chart background color as dashboard background color
- Dashboard Text - color of dashboard
- Auto Color Dashboard Text - use the chart foreground color as dashboard text color
- Dashboard Buy - color of dashboard buy signal
- Dashboard Sell - color of dashboard sell signals
- Dashboard TP Hit - color of text when targets are hit
- Dashboard Outline - color of dashboard borders
ALERT PARAMETERS - controls the alert options enabled.
- Enable Pop-Up Alerts - Enable MT4/MT5 box alerts.
- Enable Email Alerts - Enables email alerts.
- Enable Push Notification Alerts - Enables smart phone or sms alerts.
- Enable Sound Alerts - Enables sound alerts.
- Sound Alert Name - File name of sound alert.
- Enable Screen Comments - Enable comment on the top right corner of screen.
![]()
HOW TO GET THE SAMPLE CODE
A FREE sample code for "iCustom" intergration is available for our clients.
Step 1: Trend PRO Proof Of Purchase (Method#1: Via Review OR Method#2: Via
MQL5 Payment & Purchase Screenshots)
Step 2: Send me an email on support@pipfinite.com
Subject line: " Your MQL5 Username, PipFinite Trend Pro Sample Code, MT4 or MT5"
HOW TO GET THE 249$ SCANNER FOR FREE
Step 1: Trend PRO Proof Of Purchase (Method#1: Via Review OR Method#2: Via MQL5
Payment & Purchase Screenshots)
Step 2: Send me an email on support@pipfinite.com
Subject line: "
Your MQL5 Username, PipFinite
Trend Pro Scanner,
MT4 or MT5"
Exclusive Access To PipFinite Telegram Group
After we verified your purchase, the telegram invite link will be sent to your email after you downloaded
the scanner.
![]()
PLEASE WAIT FOR US TO RESPOND WITHIN 24 to 48 HOURS MAX...
BUT WHEN WE ARE ONLINE, WE
WILL RESPOND
IMMEDIATELY


