Advanced Currency Strength28 Indicator USER MANUAL
This indicator is part of a complete trading strategy!
The 28Pairs Currency Strength Trading System - also known as Double-GAP Strategy - is our primary trading philosophy and is based on exploiting individual currency strength and weakness. Please click here.
Serious traders know that currency strength trading is the most lucrative form of trading because of the choice of pairs combined with strength and weakness.
What is Advanced Currency Strength28 Indicator?
It is the first of its kind in Forex Trading to show CURRENCY STRENGTH with a new formula and very new features!
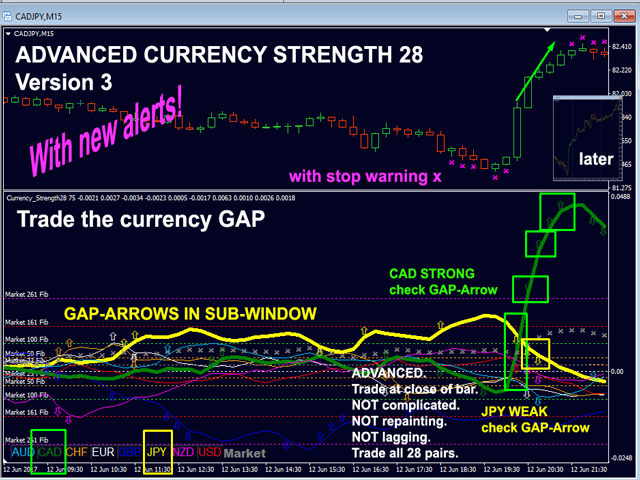
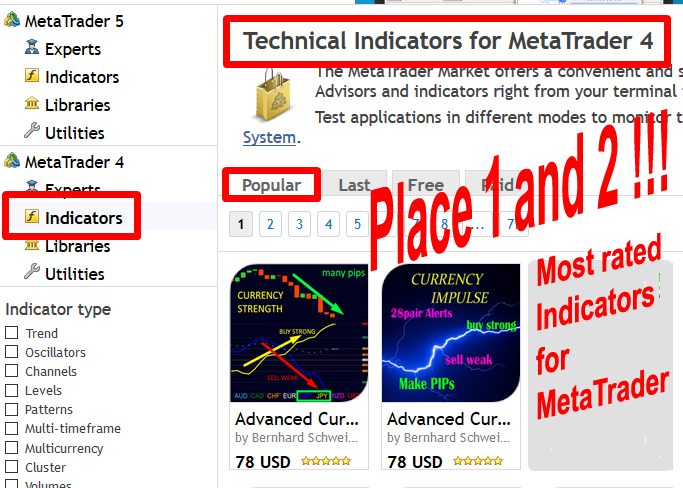
That's the first one, the original! Don't buy a worthless wannabe clone.
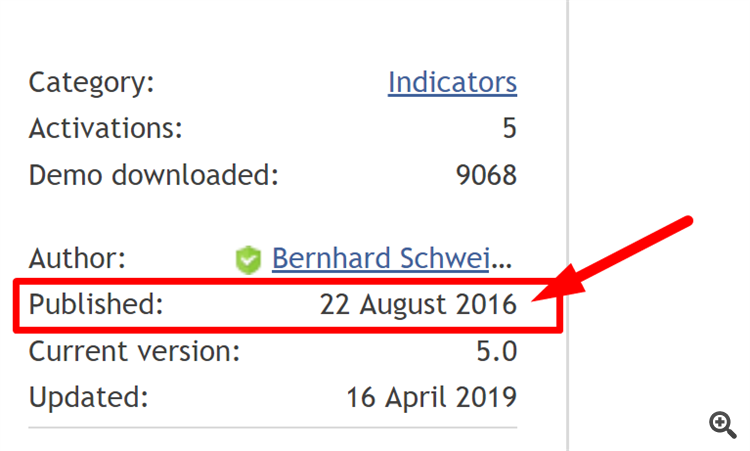
Take a look at the date of publication! 22 August 2016!
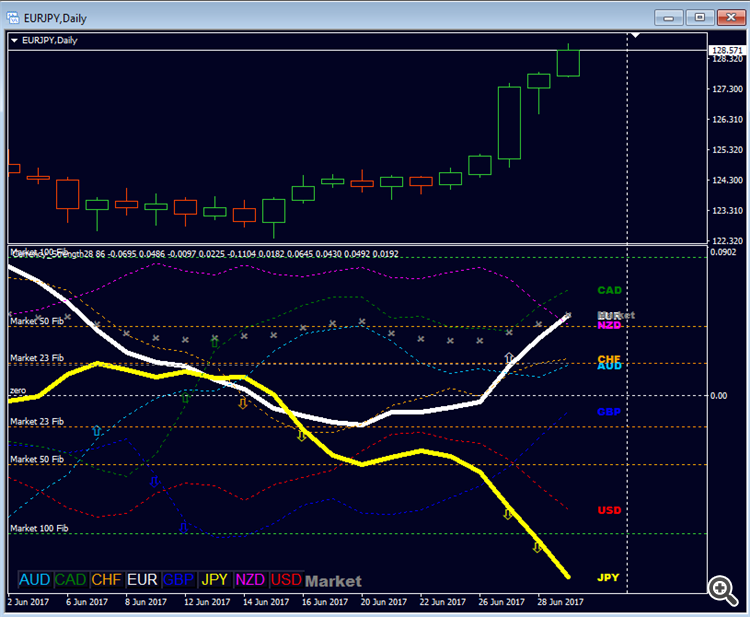
There are big differences with common currency strength indicators. We have invented is a new formula to calculate currency strength and the very new features Market Momentum and dynamic Market Fibonacci Levels which adapt to current market activity! Market momentum is the 9th line. It lets you know if the Market is active or passive. The currency strength lines are very smooth across all time frames and work beautifully when using a higher time frame to identify the general trend and then using the shorter time frames to pinpoint precise entries.
- The only indicators using advanced techniques of Dynamic Market Fibonacci levels. (Our secret code)
- Each time frame is optimized on its own!
- Multi-time-frame settings.
- Each currency is handled by its own characteristics!
- Dynamic Market Fibonacci levels for currency strength are applied. They adapt dynamically and historical to the actual market activity!
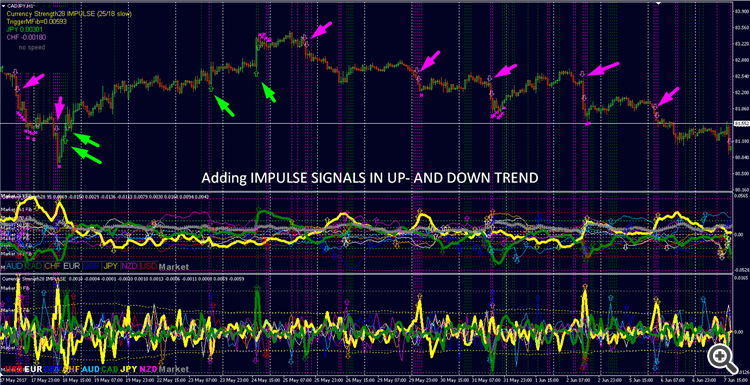
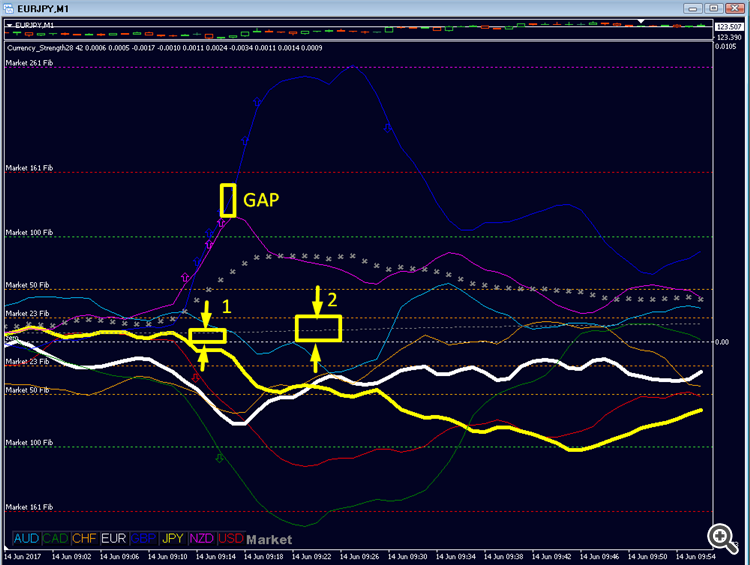
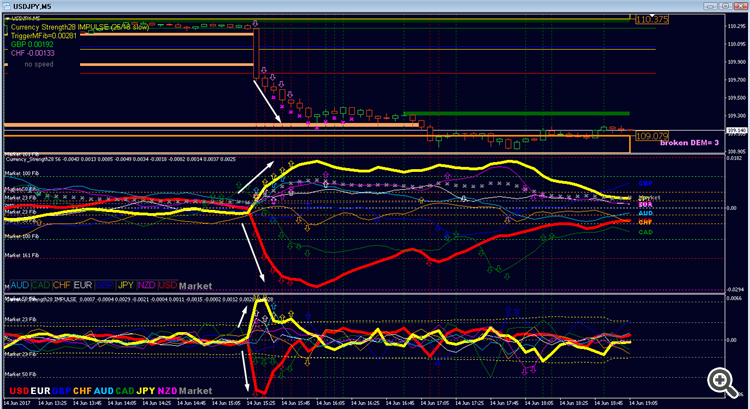
- Arrows to show strong currency momentum "GAP" in the sub-window.
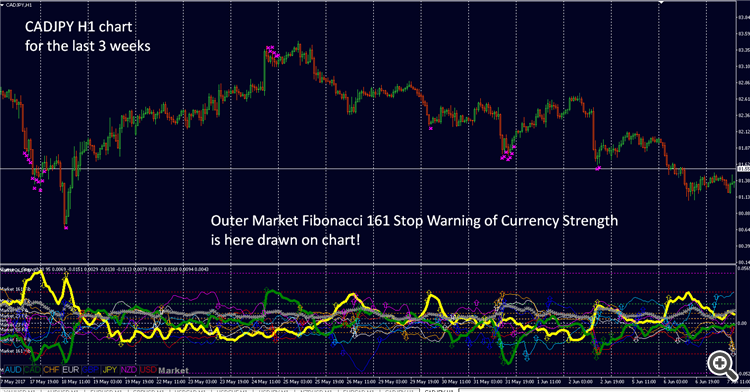
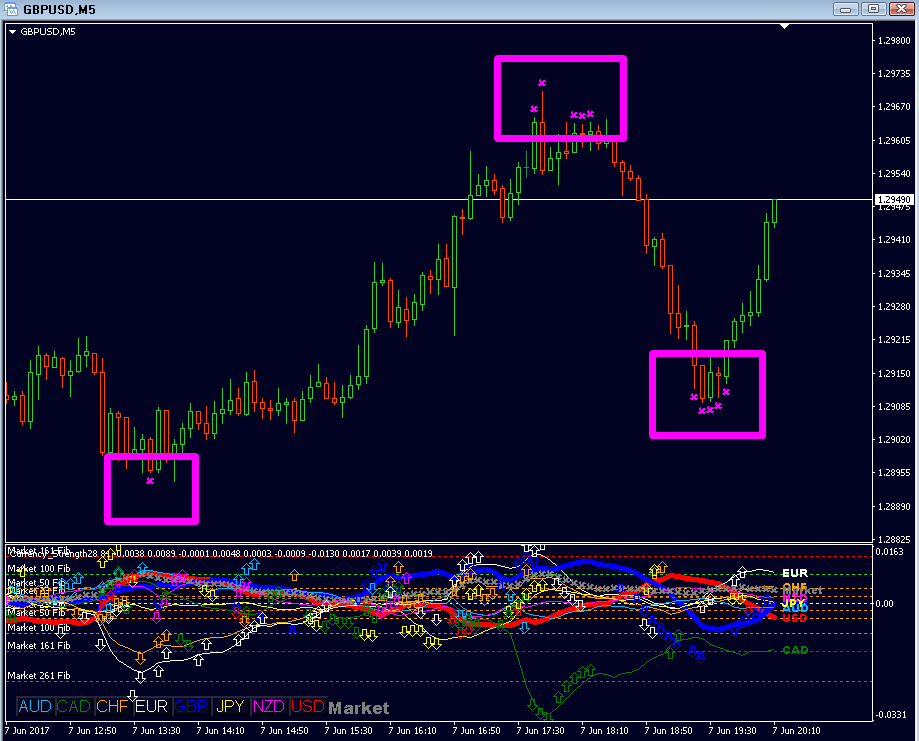
- Warning signs for individual chart when a currency is in oversold/overbought zone (outer market Fibonacci levels) in the main window.
- Hit- and pullback/reversal alert when currency strength drops back from the outer range.
- special cross pattern alert.
- Data calls from external pairs are reduced.
- Automated support charts to speed up broker feed.
- Buttons to quick change chart.
That's why all traders say it is the best currency strength indicator.
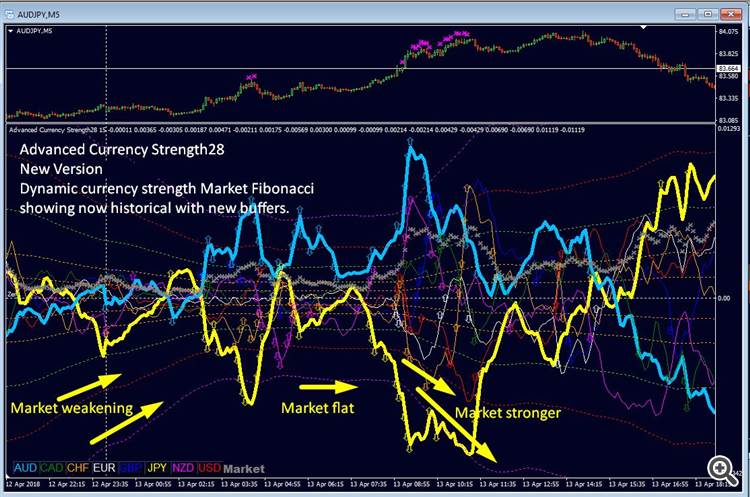
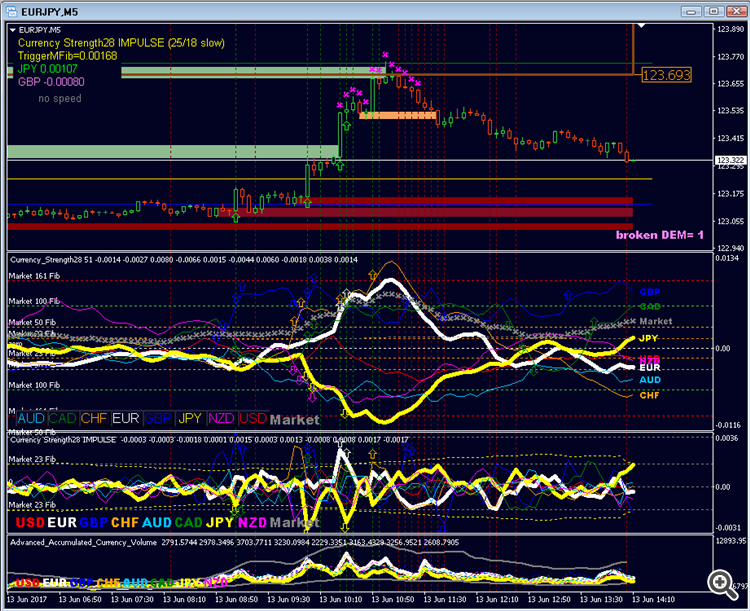
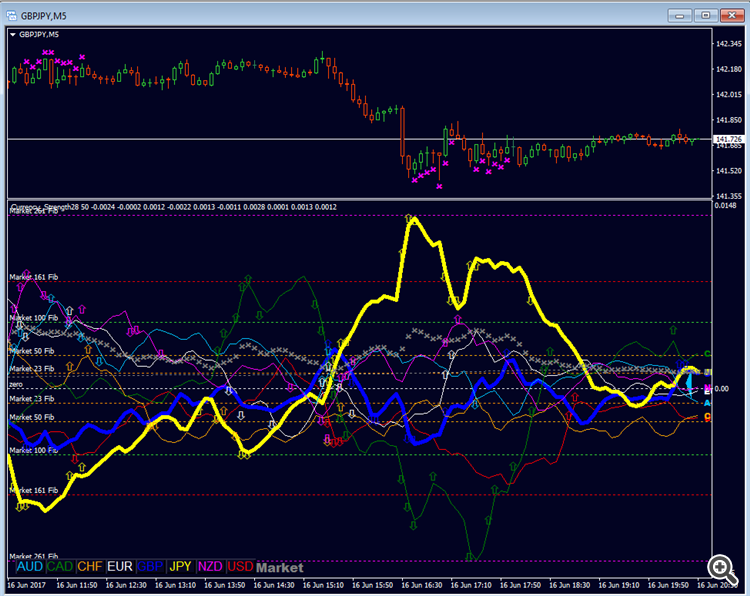
Ones the indicator is added to only ONE chart the indicator gives you the signals for all 28 forex pairs and also draws the historical signals and momentum on the actual chart.
You have the historical view and you can optimize the settings to your trading style and timeframe!
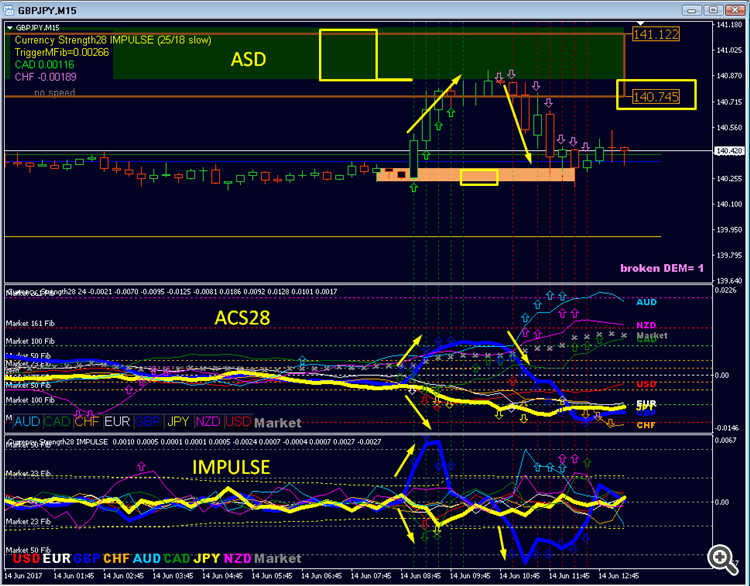
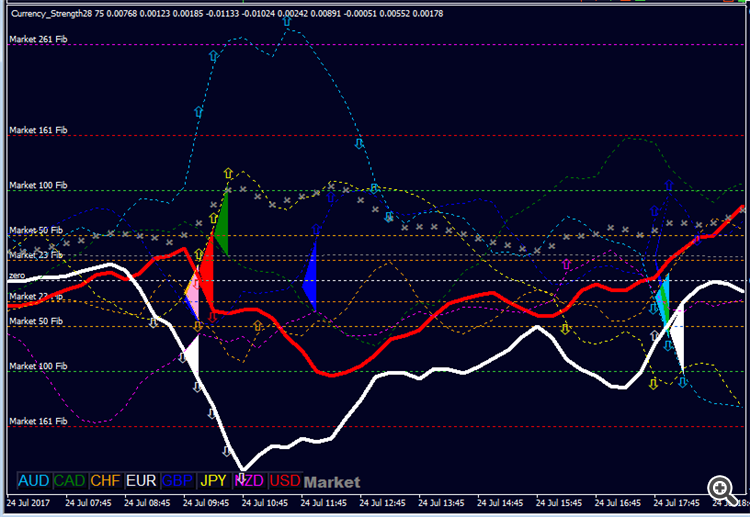
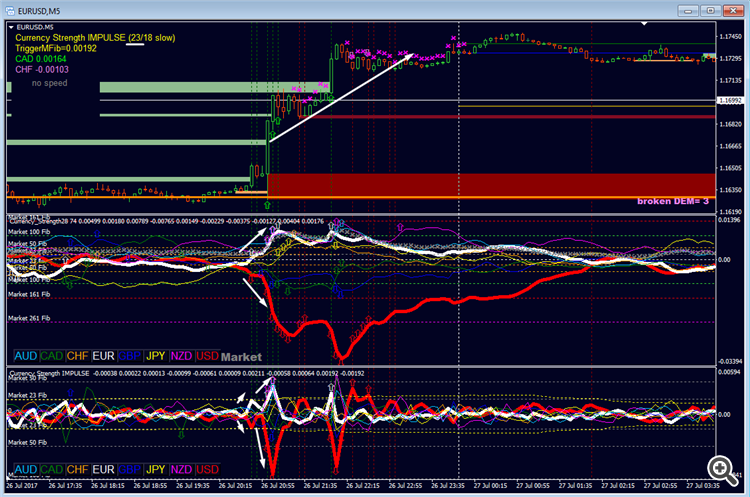
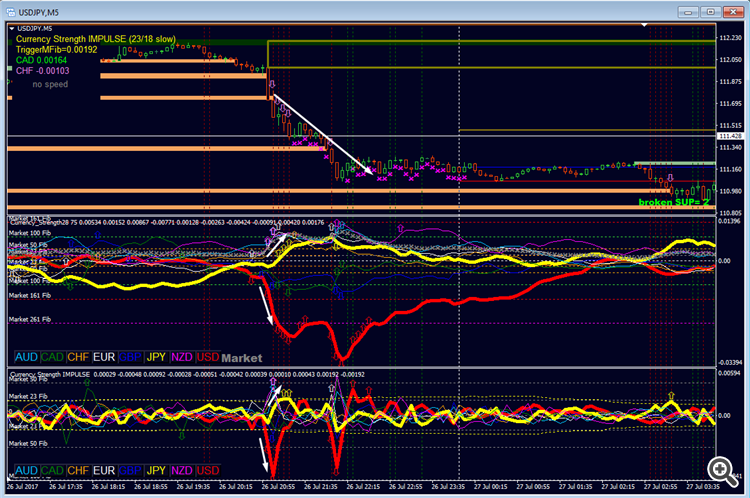
The arrow in the subwindow shows when a currency line reached the required minimum angle/slope. In the picture above it is the value 23 which represents the distance between the zero line and the 23 Market Fibonacci. This way the zoom of the chart will not affect the results. The value is editable.
Features in the new version:
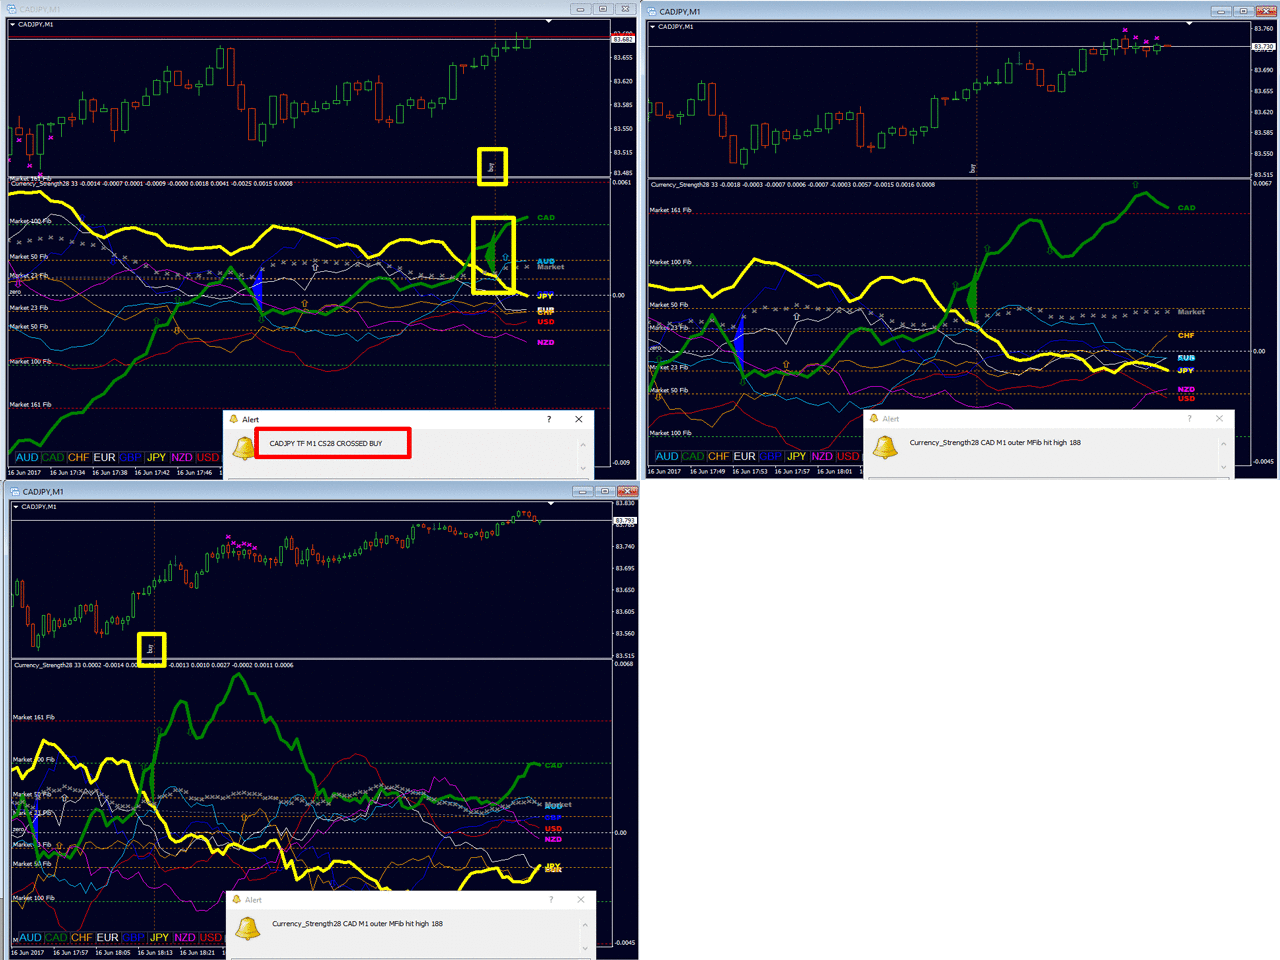
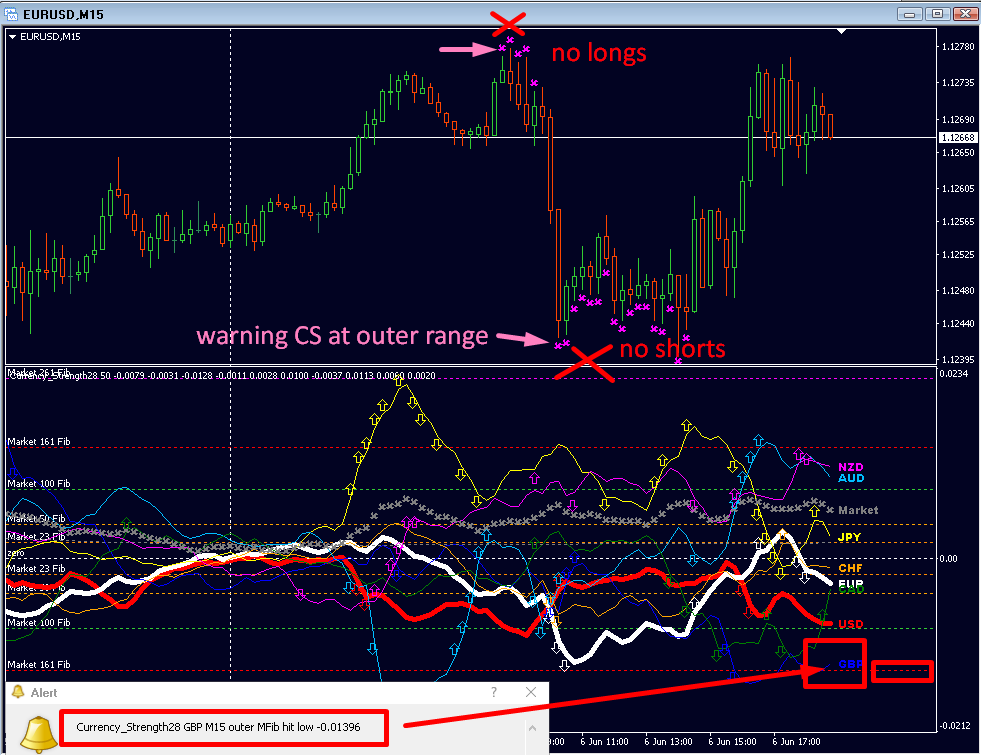
Outer market Fibonacci hit (here with input 161) Warning Alert.
Showing here currency strength line CAD has reached lower Market Fib -161.
Now make attention. If you are already in a trade to check if it is advised to take your profit or to trail your stop loss into profit.
If the price is near S/R, supply/demand price is likely to pull back because CAD strength is exhausted.
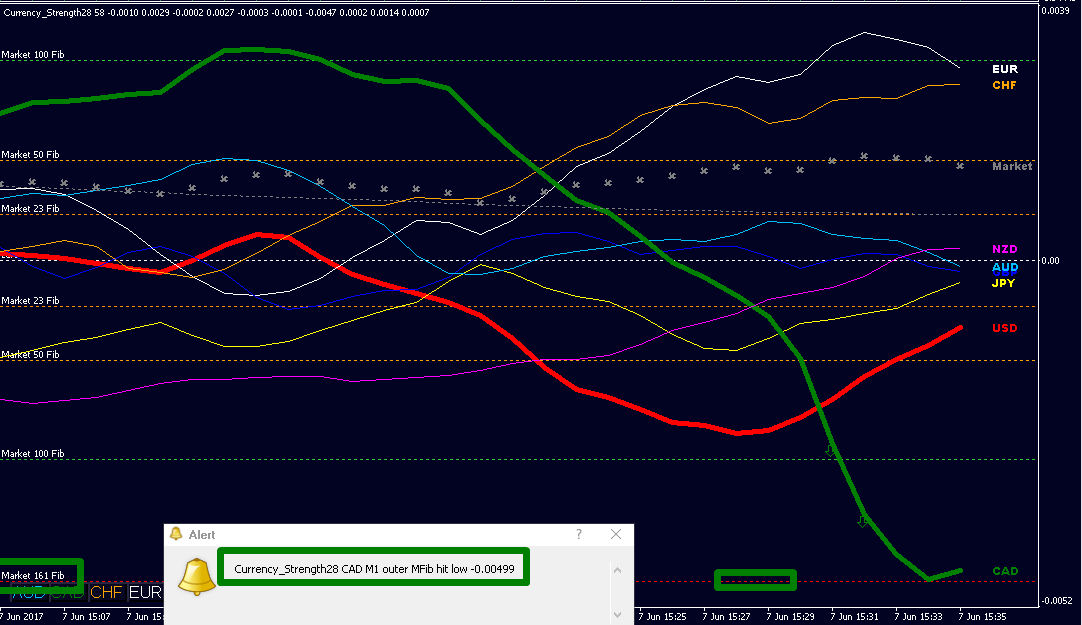
Same chart as above some time later.
We had already the alert of CAD hit outer market Fib. Now the green currency strength line CAD is pulling back from lower outer range into the inner zone. The purple stopper sign is printed above the candles.
Meaning the CAD weakness is strengthening. The actual chart is USDCAD. So CAD is quote currency. In this case, we have to invert. A stronger CAD means for usdCAD to sell.
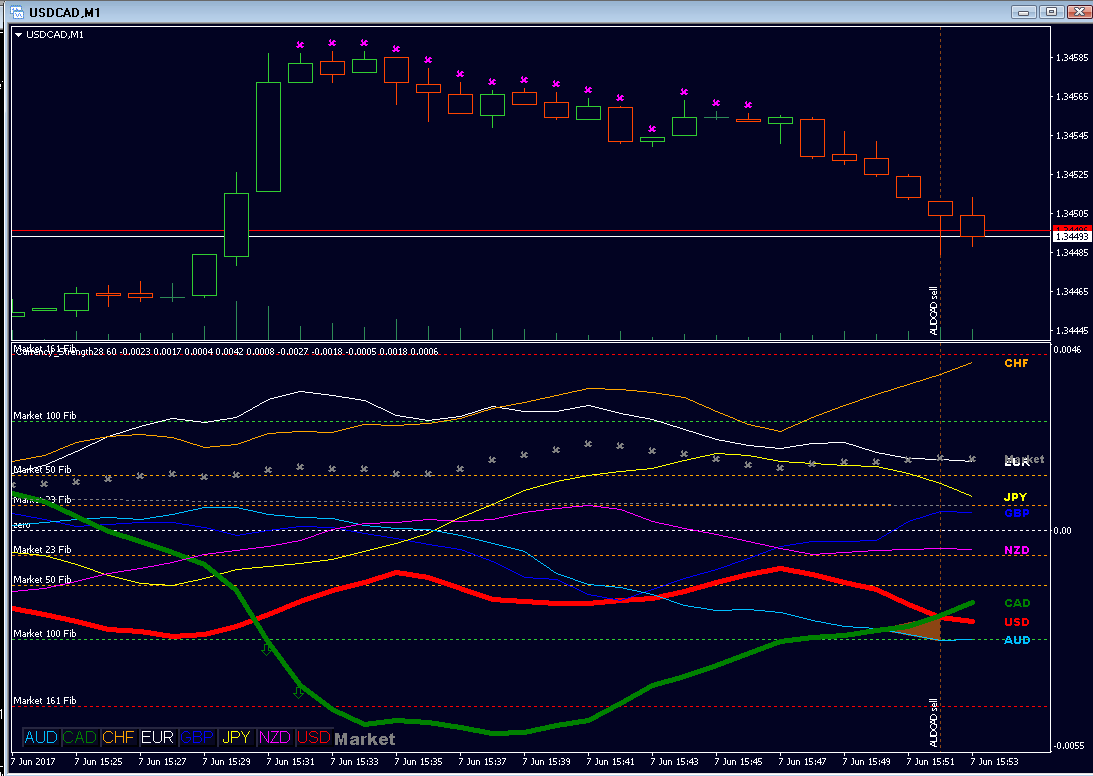
Again sometime later:
The green currency strength line CAD is further rising and crossed the white zero line. CAD might go further but now the base currency USD has hit the Market Fib -161. Which means again for the actual pair USDCAD to make attention. So if you sold USDCAD you would now think about to take profit or trail the stop loss into profit. And the game starts again...
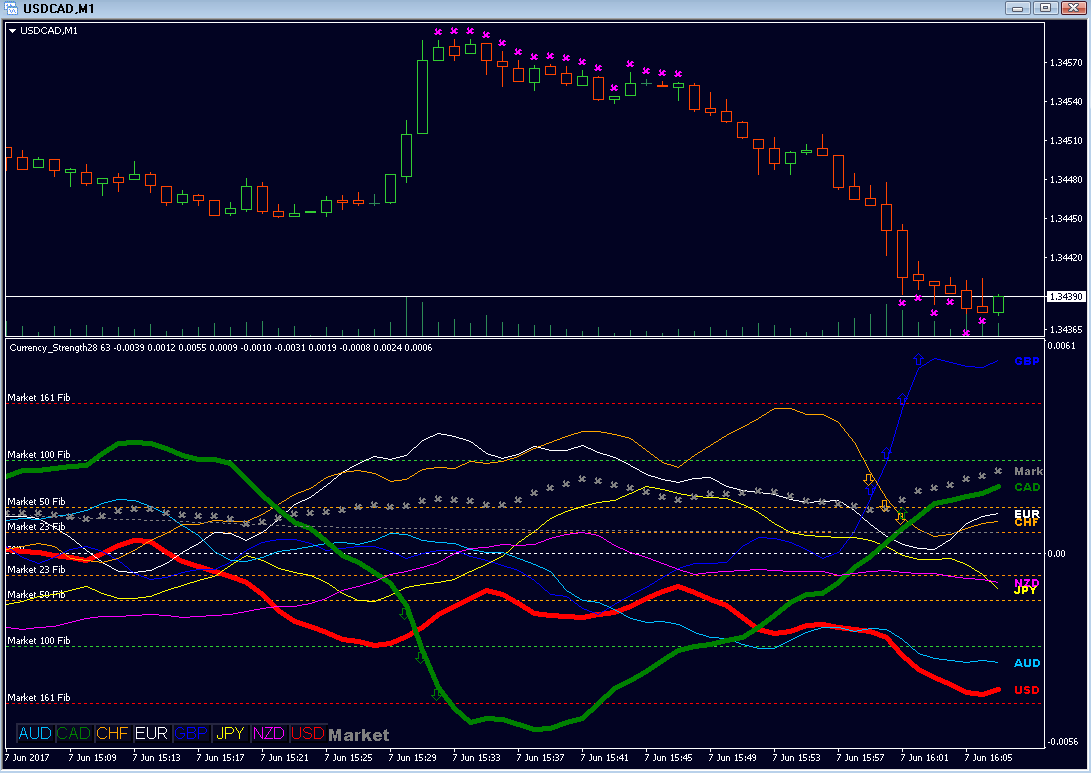
Showing the arrow in sub-window if minimum GAP is reached (value is an editable input). Showing warning sign in the main window when the base or quote currency is at outer Market Fibonacci Levels, (value is an editable input).
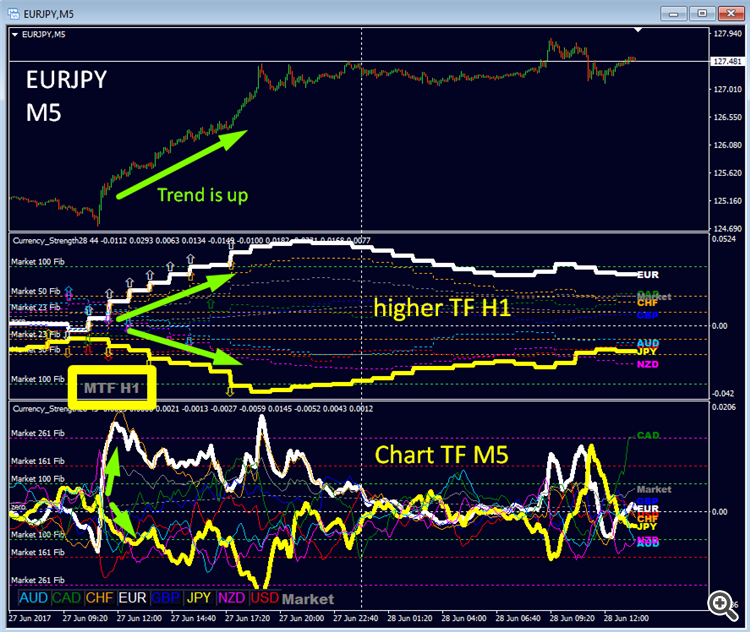
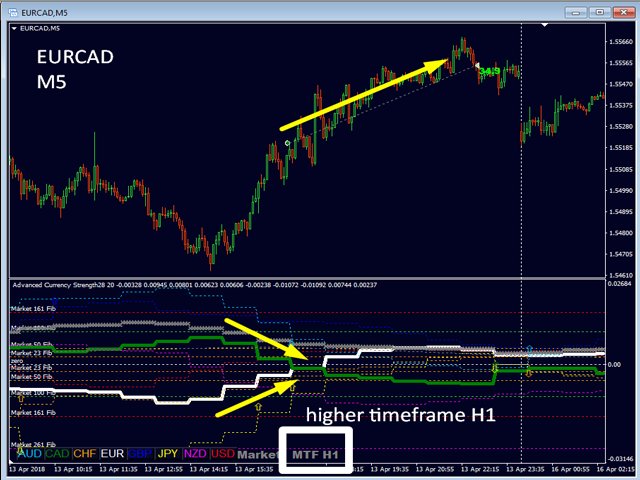
How to trade with showing a higher time frame on a lower chart:
Picture shows Advanced Currency Strength28 Indicator with setting of a higher timeframe H1 on an M5 chart. The steps of the currency line represents when the higher timeframe candle close.
(Only for MT4-version, not MT5)
=============================================================================
Video how to trade the double GAP (Version 2)
Indicator input parameters:
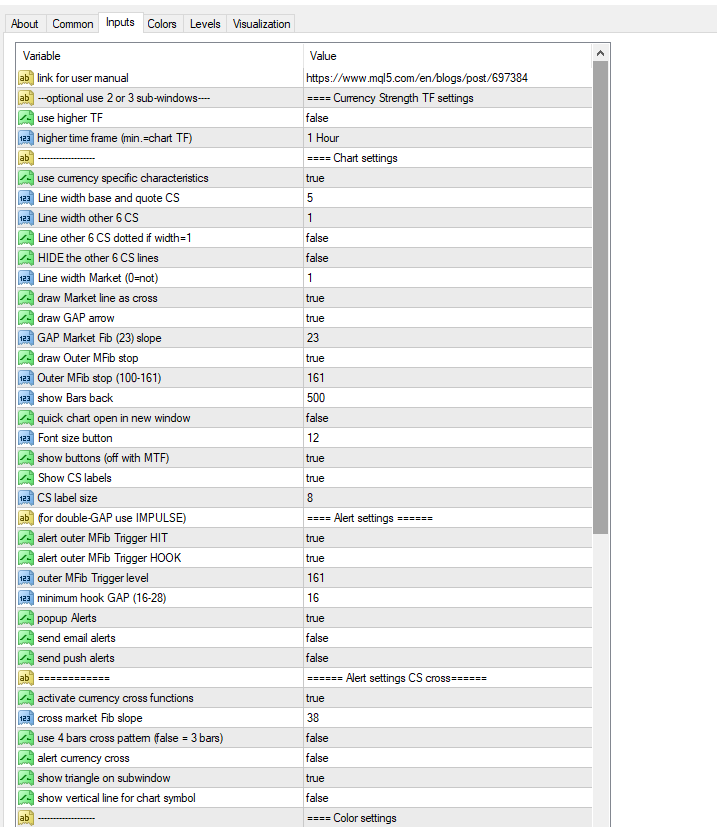
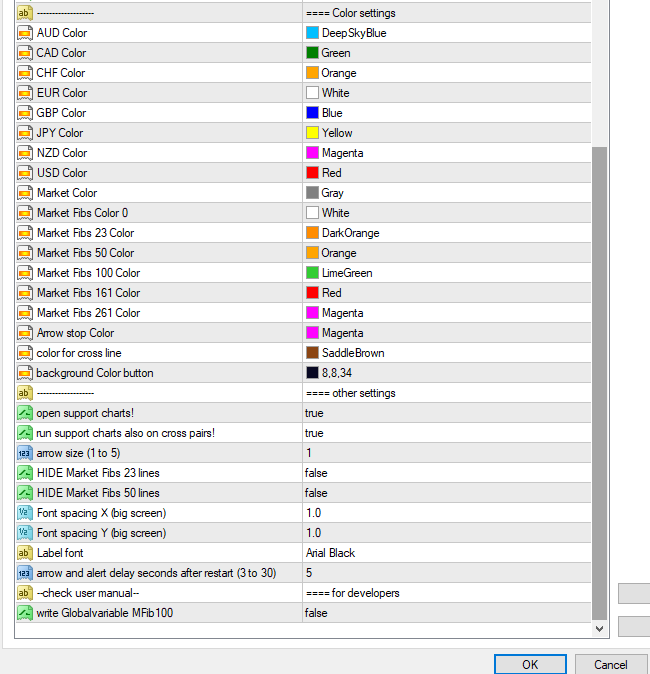
Indicator parameters
=== Currency Strength TF Settings (TF = timeframe)
- use higher timeframe (set true for use higher time frame) higher time frame (min.= chart TF+1) (Only for MT4-version, not MT5)
- higher timeframe choice (Choose the higher time frame. You can add indicator twice on a chart.)
==== Chart Settings
- use currency specific characteristics (Each currency will be handled by its own characteristics)
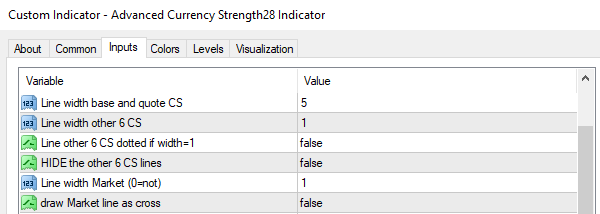
- Line width base and quote CS (make thicker the currency line of the chart)
- Line width other 6 CS (the other currencies which are not part of the chart)
- Line other 6 CS dotted if width=1
- HIDE the other 6 CS lines (Do not show the other currencies)
- Line width Market (0=not) (Size of Market Momentum dot, 0=hide)
- draw Market line as a cross
- draw GAP arrow (Arrows in sub-window to show strong currency momentum "GAP")
- GAP Market Fib (23) (Angle/slope of currency to draw arrow)
- draw Outer MFib stop (Pullback/reversal alert when currency strength drops back from outer range.
- Outer MFib stop (100-161) warning signs in the main window for individual chart when the base or quote currency is in oversold/overbought zone (outer market Fibonacci levels. For M1 use at least 161 or more.)
- show Bars back (how many candles back the indicator prints the currency lines)
- quick chart to open in new window (To change the pair on the chart just click the currency names. Click two names to build a pair. Simple: click GBP and JPY to change the chart to GBPJPY. Set to false: change pair on the chart. Set to true: Open the pair in a new window)
- Show buttons (You may hide buttons if you use indicator with MTF twice on chart)
- Show CS labels (Currency names labels on the right of each currency line. Show or hide)
- Add MFib value to label
- CS label size
=== Alert Settings
- alert outer MFib Trigger HIT (alert when currency strength reach outer Market Fib levels)
- outer MFib Trigger level (161-261) (Alert level above)
- alert outer MFib Trigger HOOK (pullback/reversal alert when currency strength drops back from outer range)
- minimum hook iGAP (16-28) (inside "iGAP" slope value for HOOK)
=== Alert Settings CS CROSS
- activate currency cross functions
- cross market Fib slope
- use 4 bars cross pattern (false = 3 bars)
- alert currency cross
- show triangle on subwindow
- show vertical line for chart symbol
==== General Alert Settings
- popup Alerts
- send email alerts
- send push alerts
==== Color Settings
- EUR Color (Euro is white, please change if you use white chart background)
- For the rest of the colors, and text sizes, you know how to use it...
=== Other Settings
- open support charts!
- run support charts also on cross pairs!
- arrow size (1 to 5)
- button Font size
- button spacing length (big screen)
- button spacing high (big screen)
- Label font
- arrow and alert delay seconds after restart (3 to 30)
- Comma separated pair exclude list (no alert)
- show line always bold (Comma separated CS list) - (An application could be to show "risk on" assets like JPY & USD against "risk off" assets like CAD & AUD. Then add into the above-mentioned input the comma-separated list: JPY,USD,CAD,AUD The sequence does not matter.)
- Show last Signal with Local or broker time (A message in the subwindow will show with for the last signal with the time of your broker or local PC.)
- use PIN --- for developers and to use with CS28 Combo Signals indicator
- pause for HIT alert in bars (0=automated) --- To avoid repeating alerts of HIT.
- pause runs in seconds to next update (for less CPU use) (0=not) --- higher timeframes do not need recalculations each tick.
- Force objects to subwindow number (0=auto)
Tips
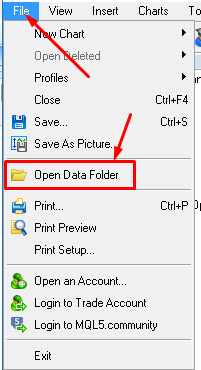
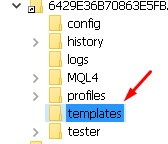
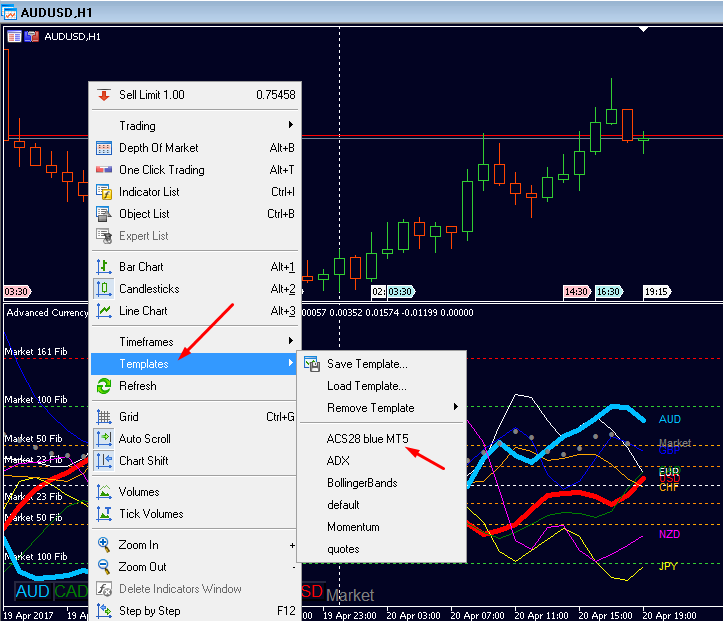
- Use my template. (Download on comment #1 below)
- GET FIRST MT4 CHART HISTORY! (See comments Page 1, Post #3 & #5-7 if you want try the demo!) For the live version it is automated.
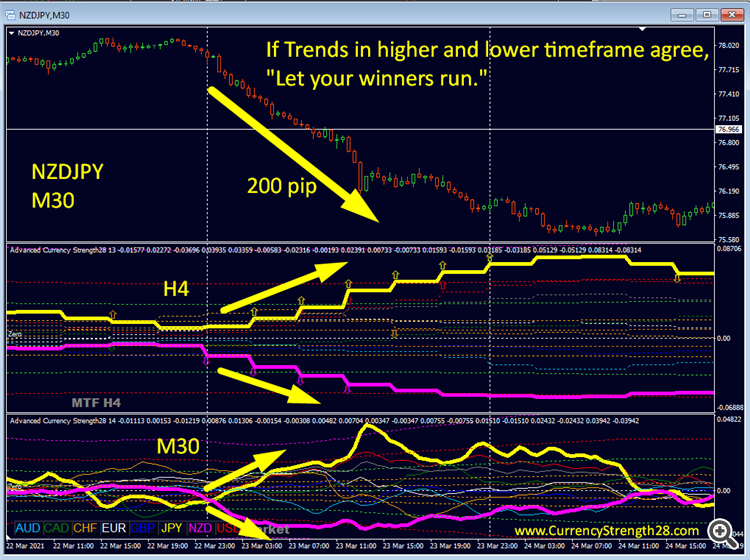
- Stay within the trend (currency GAP) of the higher time frame.
- Look for the currency double-GAP as trade setup.
- Check my news and blogs on profile for trading system and trade examples.
ACS28 is a multi-signals, multi-timeframes, multi-pairs indicator. It works for all time frames and gives all 28 pairs signal on a single chart, and it is super configurable.
So PLEASE take your time and study it VERY good. This indicator is not like a bicycle to driving but like a helicopter to fly.
There are 5 signals in one indicator!
- outer Market Fibs Hit alert, (Currency Strength extreme levels)
- Hook alert, (Currency Strength reversal from extreme levels)
- Cross alert, (Currency Strength cross pattern)
- GAP arrow, (Currency Strength minimum angle/slope)
- pink X warning sign. (Currency Strength extreme level warning)
Each one signal can be edited in its trigger value. As each trader has its own views on the Market choose which one you want to trade. You can apply many different settings so it will fit perfectly to your trading style and psychology.
The MQL5 licenses itself give you the option to use the indicator on unlimited MT4 accounts on the same computer and you can do activations for 5 computers. As well for updates, it is easy. You will be notified and then you can download.
Use my templates. Email me to get the latest support files. currencystrength28@gmail.com
Recap: What are dynamic Market Fibonacci levels (MFib)?
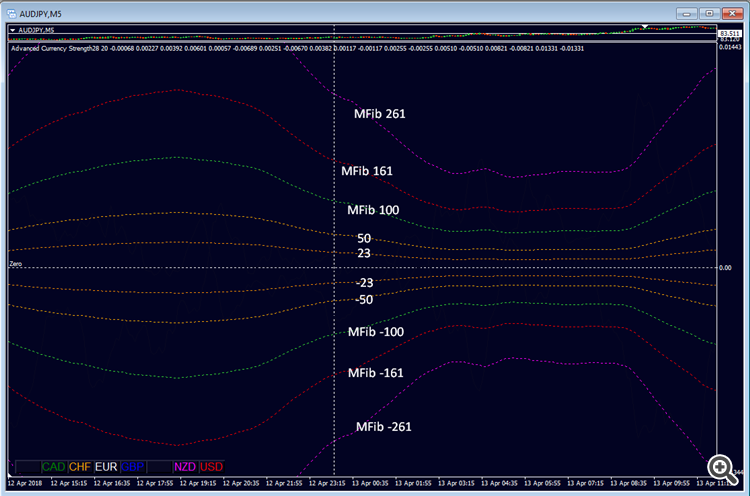
We all know Fibonacci levels from a simple chart but this is a completely different approach. We will now apply Fibonacci on currency strength instead of a price chart. This is one level higher.
Dynamic Market Fibonacci levels is a special feature of Advanced Currency Strength28 indicator and you cannot find in any other Currency Meter! This is a very unique function.
Dynamic Market Fibonacci levels are based on the entire Market activity (all 28 pairs). This is one way to see when Market Makers are active and you want to be with them in your trade! We see clearly on minute charts rising Market activity at London open and falling around London/New York close.
The Market Fibonacci levels 161 and 261 we call Market Fibonacci Retracement Zones (MFib 161/-161 and MFib 261/-261): These levels are used with CS-lines for potential reversal zones and strength sentiment.
We also use the Market Fibonacci level 100 to check if we are early enough to enter a trade (MFib100/-100).
Some traders use also the Market Fibonacci level 23 to check if the sentiment is with a trade (MFib23/-23) (This is optional).
Above mentioned MFib23 value we use to get the GAP value for the GAP arrow.
All together and combinations of it will apply with the functions for the “HIT and HOOK” alert and the pink stopper sign (a warning for extreme levels).
Now... what is new?
In old versions - you might see on old pictures - the Market Fibonacci levels were shown as a horizontal line. Those lines were applied to the last closed candle. It means you do not see how Dynamic Market Fibonacci levels were in the past.
The new version will draw all dynamic Market Fibonacci levels historically! Now you have all the complete historical view!
The development, research, and programming of this indicator reached now 6 years and it is the best available currency meter in the market.
Older customers know that development is very active with frequent updates.
Reminder to update your version. Updates are free.
New VERSION released!
REGULAR UPDATES!
Specials !
Discounts are available for MT4 versions, now.
Get a cheaper rent. Profit now with a lower price. Limited offer with discount.
Get it now with discount 26% OFF!
MT4 CLICK HERE
(MT5 click here)
I will always help you if you have any questions.
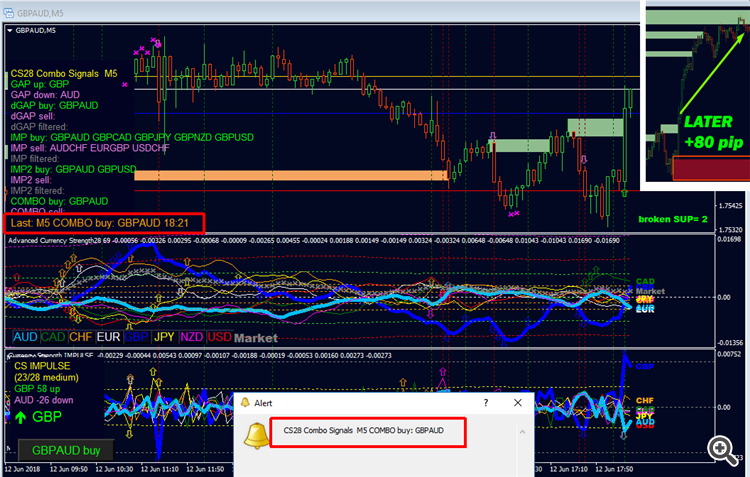
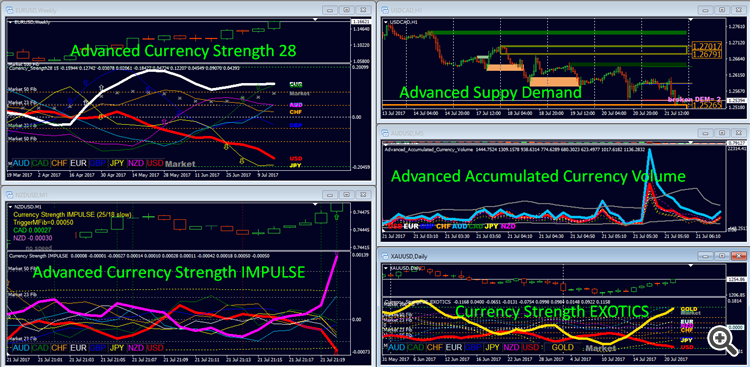
A special tool/indicator called "CS28 Combo Signals" will be free for loyal clients! (MT4)
Who followed the news on my profile will know we were developing that tool over some time. It is a tool which works together with Advanced Currency Strength28 (ACS28) and Advanced Currency IMPULSE with ALERT. ACS28 and Impulse will communicate with the "CS28 Combo Signals" indicator. Then it will filter signals of Advanced Currency Strength28 and Advanced Currency IMPULSE and do different and combined alerts. With several input parameters the trader has now more options to configure alerts to his needs. For example we got alerts for double-GAP or Impulse if Currency Strength is within Market Fib100/-100, or a double-GAP when Currency Strength has already crossed, and more...
A FREE personal license is available for loyal and happy clients who own ACS28 and Impulse indicators and have a bonus with us.
Requirement for "CS28 Combo Signals":
- You own Advanced Currency Strength28 Indicator.
- You own Advanced Currency IMPULSE with ALERT.
- You have at least basic experience with the above indicators for a full week and studied my trading system. You studied the user manuals and know how to use each input parameters. You are happy with the indicators and our service.
Please wait for answer within 24-48 hours.
Many customers got it already.
- Ones you got the indicator(s) request the starter email with more info, links, templates, and stuff. I want to make sure of your success! You need it.
- Send email to currencystrength28@gmail.com or send me personal message.
Unlock Your Serious Edge NOW!
Place a comment on the indicator page at mql5 so we can verify your access for our forum and other bonuses in the future.
Place a comment on the indicator page at mql5 so we can verify your access for our forum and other bonuses in the future.
THIS MANUAL WILL BE continuously be UPDATED !! So check again.
Thanks, I wish you many green pips in the future.
Best regards, Bernhard
