
USDJPY Price Action Analysis - ranging within 50.0% Fibo level and 23.6% Fibo level for direction
9 October 2015, 09:11

0
1 252
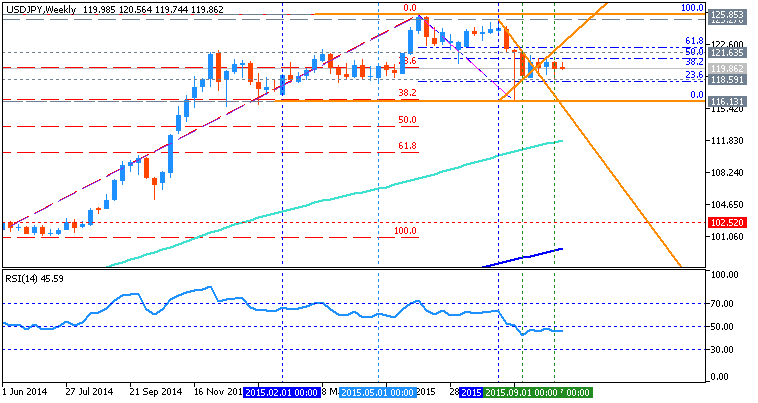
W1 price is located above 200 period SMA (200 SMA) and above 100 period SMA (100-SMA) for the primary bullish market condition with secondary ranging between Fibo resistance level at 125.85 and Fibo support level at 116.13:
- The price is floating within 50.0% Fibo resistance level at 120.97 and 23.6% Fibo support level at 118.41.
- Symmetric triangle pattern was formed by the price to be crossed for direction.
- If the price breaks 23.6% Fibo support level at 118.41 so the bearish market condition will be continuing with Fibo support
level at 116.13 as the next bearish target, otherwise - ranging.
Trend:
- W1 - ranging bullish
- MN1 - ranging bullish


