

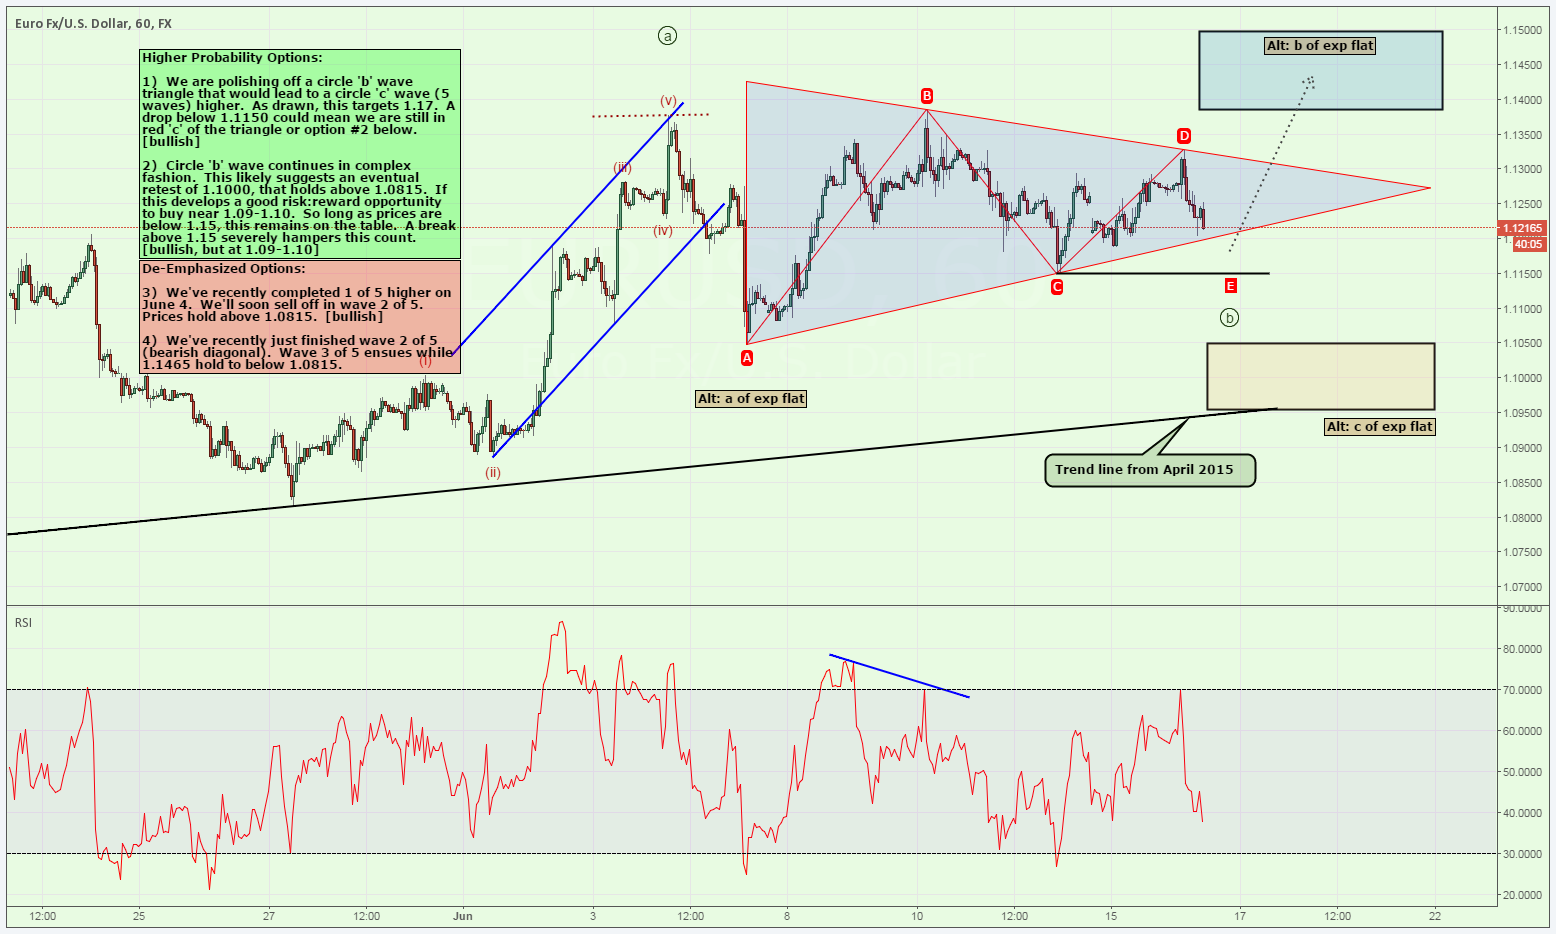
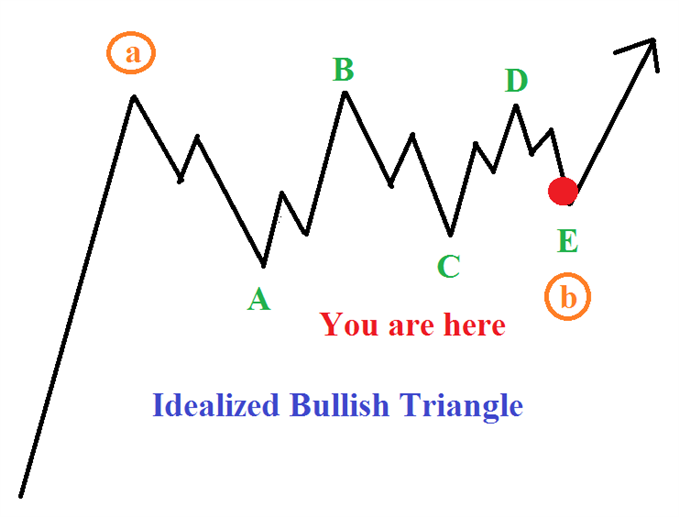
The first scenario to unpack is that the EURUSD is placing the finishing touches on a triangle masterpiece. This means the triangle is the ‘B’ wave of an A-B-C upward movement. If this is correct, then a ‘C’ wave would be a breakout to higher levels that begins from nearby levels.
Expanded Flat
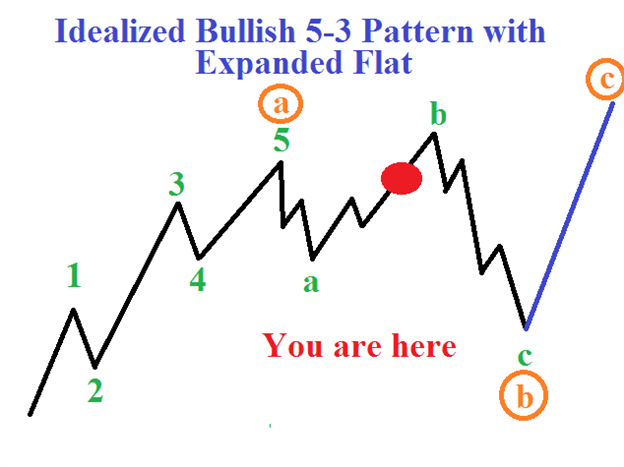
The second higher probability scenario we’re watching is a smaller
degree expanded flat correction that eventually works down towards
1.09-1.10.
Though this is a downward correction, wave relationships suggest prices
could falsely break above 1.1375, but would likely hold below 1.1500. In
essence, 1.1375-1.1500 becomes a false breakout zone. Under this
scenario, an ensuing sell off drops to 1.09-1.10, but holds above
1.0815. Against the backdrop of a medium term up trend, 1.09-1.10
becomes a higher probability long entry.
Combining the Two Possibilities
One of the biggest challenges of the wave picture on the EURUSD is that
until 1.1050 or 1.1500 is broken, the top two interpretations discussed
above are still alive. Meaning, Elliott Wave uses deductive reasoning
and that anything possible, though of low probability, is still
possible. Once a wave count can be eliminated, then the picture cleans
up.


