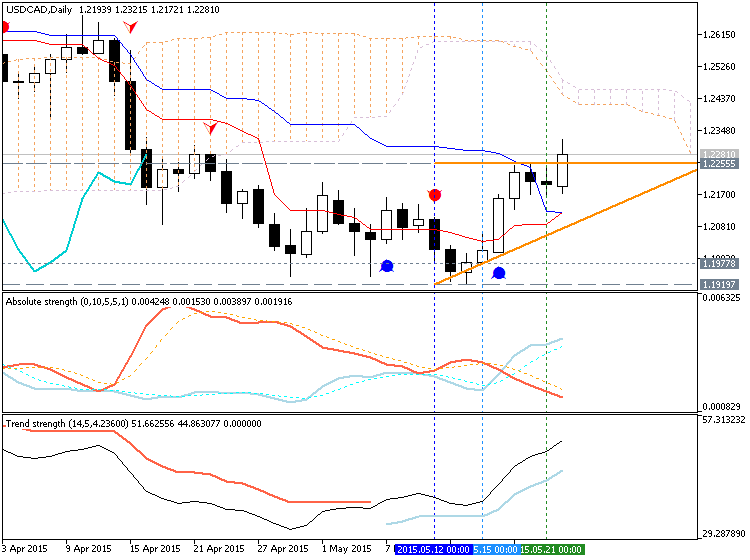
- Tenkan-sen line is crossing Kijun-sen line of Ichimoku indicator from below to above with 1.2255 resistance level on D1 timeframe indicating good possible breakout.
- D1 price is located below Ichimoku cloud for primary bearish market condition
- AbsoluteStrength indicator and TrendStrength indicators are estimating daily bear market rally as local uptrend.
- “The breakdown from a 2 and a half month topping pattern could ‘kick-off’ a much larger decline but near term focus is on early congestion from 1.1931 to 1.2046.”
- "USDCAD has turned up from just below 1.1931 (low was 1.1919). The break above the median line opens up a run on former support from 1.2350 to 1.2447."
- D1 price is breaking 1.2255 resistance with good potential for breakout.
- Chinkou Span line is breaking the price from below to above for breakout to be started
Trend:
- H4 - bullish
- D1 - breakout within the bearish (bear market rally)
- W1 - ranging bullish
- MN1 - ranging bullish