
CRUDE OIL Weekly Technical Analysis - bearish; market rally to be started with 64.85 resistance and 52.49 support levels
23 April 2015, 09:11

0
515
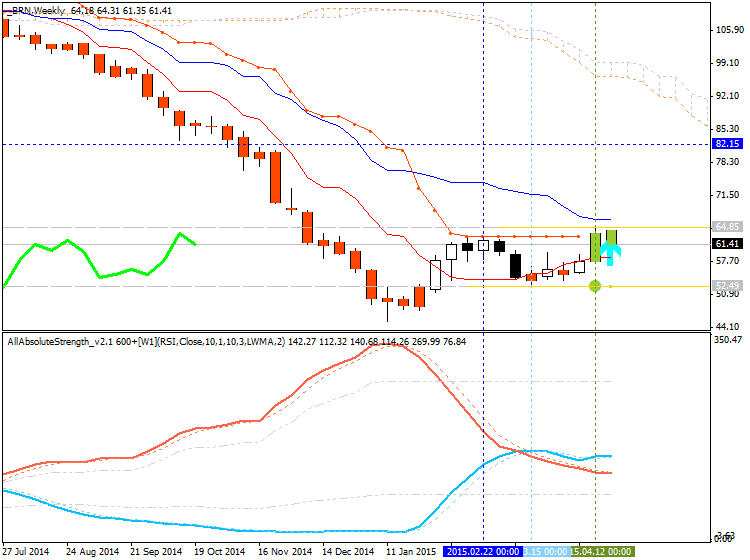
- Tenkan-sen line is located below Kijun-sen line of Ichimoku indicator with 64.85 resistance and 52.49 support level on W1 timeframe for the primary bearish market condition to be continuing
- Weekly price is located below Senkou Span A line which is virtual border between the bearish and the bullish on the chart
- Senkou Span A line is located too far from the price for any possible reversal of the price movement from the bearish to the bullish in the near future
- Price channel indicator is showing the uptrend which was started during the last week.
- AbsoluteStrength indicator estimated the secondary market rally within the primary bearish to be started on open W1 bar.
- Chinkou Span line of Ichimoku indicator is located far from the price for any possible breakout or breakdown of the price movement in the near future.
- Nearest resistance levels are 64.85 and 82.15
- Nearest support level is 52.49
| Resistance | Support |
|---|---|
| 64.85 | 52.49 |
| 82.15 | N/A |
Trend:
- H4 - correction within the bullish
- D1 - correction within the bullish
- W1 - market rally within bearish
- MN1 - ranging bearish


