
HowTo Trade - Video Tutorial: Ichimoku Trading Strategies, Setups and What to Watch for
23 January 2015, 09:11

0
1 111
Ichimoku is a technical or chart indicator that is also a trend trading system in and of itself. The creator of the indicator, Goichi Hosada, introduced Ichimoku as a “one glance” indicator so that in a few seconds you are able to determine whether a tradable trend is present or if you should wait for a better set-up on a specific pair.
=============
Ichimoku indicator description
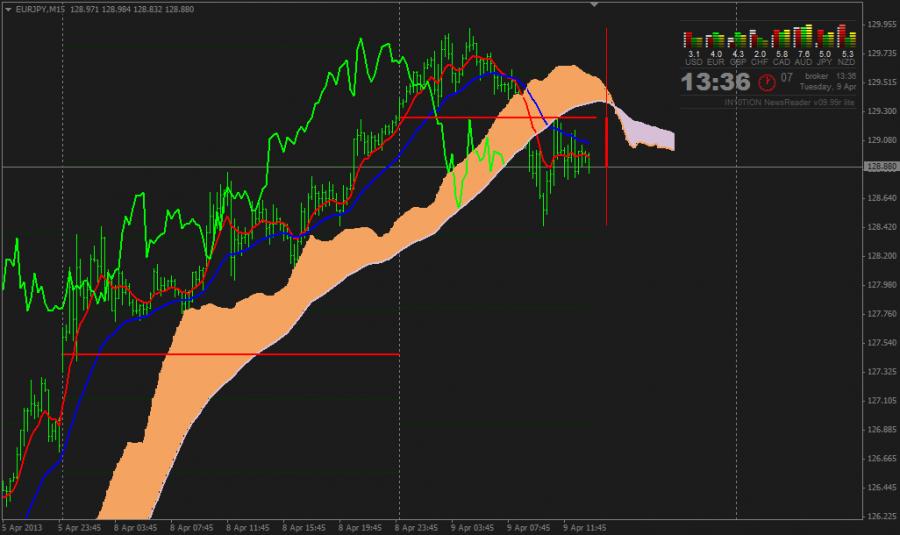
- Tenkan Sen - moving average of the highest high and lowest low over the last 9 trading days. (Highest high + Lowest low) / 2 over the last 9 trading days
- Kijun Sen - moving average of the highest high and lowest low over the last 26 trading days. (Highest high + Lowest low) / 2 over the last 26 trading days.
- Senkou Span A - the average of the Tenkan Sen and Kijun Sen, plotted 26 days ahead. (Tenkan Sen + Kijun Sen) / 2 plotted 26 days ahead
- Senkou Span B
- the average of the highest high and lowest low over the last 52 days,
plotted 26 days ahead. (Highest high + Lowest low) / 2 over the last 52
trading days plotted 26 days ahead.
- Chikou Span - the closing price plotted 26 days behind.
=============
For lower timeframe - there are 2 kinds of settings:
- 9/26/52 as default one and/or
- 72/144/288
=============
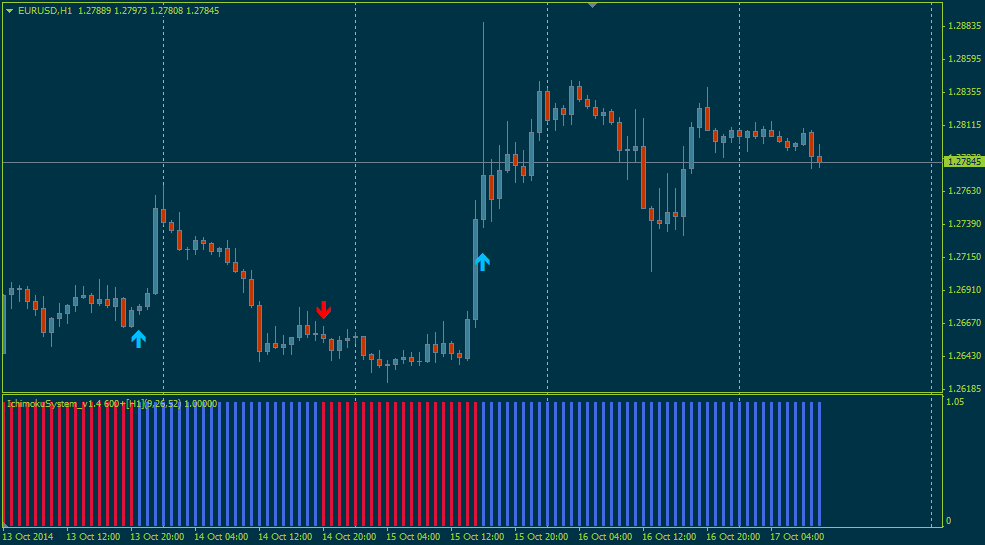
Besides, there are many signals of Ichimoku indicator to open the trades. I know about 6 signals (but it is much more signals in combination with each other):
- Tenkan Sen / Kijun Sen Cross - very weak signal but it is coming as the first one ... but it may be a lot of false signals
- price crossing Kijun Sen - more strong signal
- price crossing Senkou Span A line (Kumo Breakout)
- price crossing Senkou Span B line (Kumo Breakout)
- Senkou Span A crossing the Senkou Span B (trend reversal)
- Chikou Span crossing historical price - it is most strong signal for Ichimoku but it is lagging on timeframes started with H1, and not lagging for lower timeframes
=============


