ALFRED MURIITHI / Profil
- Information
|
10+ Jahre
Erfahrung
|
20
Produkte
|
270
Demoversionen
|
|
0
Jobs
|
0
Signale
|
0
Abonnenten
|
🏛 ALL EA https://www.mql5.com/en/users/pipmontra/seller
👉 MY TELEGRAM @innovicient https://t.me/Innovicient
👍🏻 SUBSCRIBE TO MY YOUTUBE CHANNEL: https://www.youtube.com/c/RangingMarkets
📌 For a discount on my products or other requests, write me through https://t.me/Innovicient or innovicient@gmail.com
True Oversold Overbought MT4: https://www.mql5.com/en/market/product/68396
True Oversold Overbought MT5: https://www.mql5.com/en/market/product/79336
Hot Zones MT4: https://www.mql5.com/en/market/product/77292
Hot Zones MT5: https://www.mql5.com/en/market/product/77417
Outside The Box MT4: https://www.mql5.com/en/market/product/83143
Outside The Box MT5: https://www.mql5.com/en/market/product/76975
Ranging Market Detector MT4: https://www.mql5.com/en/market/product/66062
🏛 ALL EA https://www.mql5.com/en/users/pipmontra/seller
ALFRED MURIITHI
7 Days Sale: 40% DISCOUNT END MONTH OFFER
👉MT4 Version: https://www.mql5.com/en/market/product/83143
👉MT5 Version: https://www.mql5.com/en/market/product/76975
👉ALL Indicators: https://www.mql5.com/en/users/pipmontra/seller
👉MT4 Version: https://www.mql5.com/en/market/product/83143
👉MT5 Version: https://www.mql5.com/en/market/product/76975
👉ALL Indicators: https://www.mql5.com/en/users/pipmontra/seller

ALFRED MURIITHI

7 Days Sale: 40% DISCOUNT END MONTH OFFER
👉MT4 Version: https://www.mql5.com/en/market/product/83143
👉MT5 Version: https://www.mql5.com/en/market/product/76975
👉ALL Indicators: https://www.mql5.com/en/users/pipmontra/seller
👉MT4 Version: https://www.mql5.com/en/market/product/83143
👉MT5 Version: https://www.mql5.com/en/market/product/76975
👉ALL Indicators: https://www.mql5.com/en/users/pipmontra/seller

ALFRED MURIITHI
7 Days Sale: 40% END MONTH OFFER
The Outside The Box (OTB) is a complete trading system that provides the user with immense trading ability by highlighting on the chart areas where the trader should prepare to
Re-enter the trend after pullbacks (Pullback trading strategy)
Take partial/complete profit(Profit taking strategy), and
Trade breakouts (Stock breakout strategy)
Irrespective of whether you are trading,Synthetic Indices,Forex,Cryptocurrencies, or Stocks the Outside The Box System works wonders.
How do I know there is a trend breakout- Breakout Zone
This is the zone between the continuous and dotted lines. The market is expected to breakout on the side of the solid continuous line. After the Breakout Zone draws, you should plan to open trades in the direction after the Re-Entry Zone is displayed. You are recommended to avoid opening buys when the price trends below the bearish breakout. Similarly, don’t go short when the bullish breakout is activated. Another vital point, expect the zones to act as support/resistance.
When do I re-enter the trend. Re-entry Zone
The Re-entry Zone is always below the Breakout Zone during a bear market. However, it can appear above the Breakout Zone if the market is consolidating. On the same note, the bull market Re-entry Zone is always above the Breakout Zone, though this may be overlooked in the early stages of the trend formation. Buy if a candle opens above the buy re-entry zone if bulls are in control and wait for a candle to open below the sell re-entry zone for you to sell during a bear market.
How do I take profit-Take Profit Zones
This module, Take Profit Zones, is useful in that irrespective of the indicator you are using it shows areas where you must lock or take some profit. These zones are displayed when there is either bull or bear market. This is helpful in that you are able to lock most of the gains before a retracement or reversal. On a downtrend, you can re-enter the market, with smaller lots, after a candle opens and closes below the Take Profit Zones. Equally, go long after a candle opens and closes above the zone if you are on an uptrend.
This system has been tested on ordinary and Renko charts. However, use the system together with Renko charts to experience the best outcome and display of these critical zones.
Always know the market level by using Outside The Box trading system.
For the first 10 buyers, we are giving a free copy of Price Elevator> https://www.mql5.com/en/market/product/82757
👉MT4 Version: https://www.mql5.com/en/market/product/83143
👉MT5 Version: https://www.mql5.com/en/market/product/76975
👉ALL Indicators: https://www.mql5.com/en/users/pipmontra/seller

ALFRED MURIITHI
OUTSIDE THE BOX (OTB)- Q/A
10. What are Micro Breakouts and how can I use them?
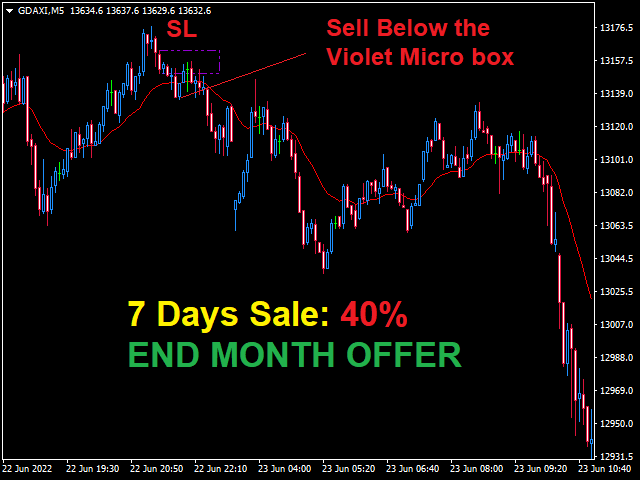
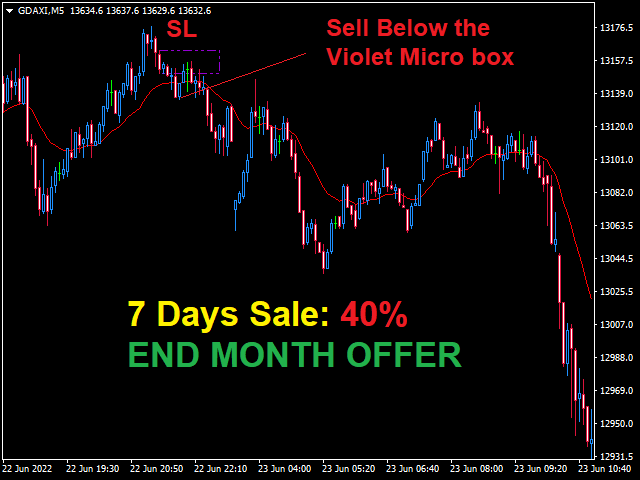
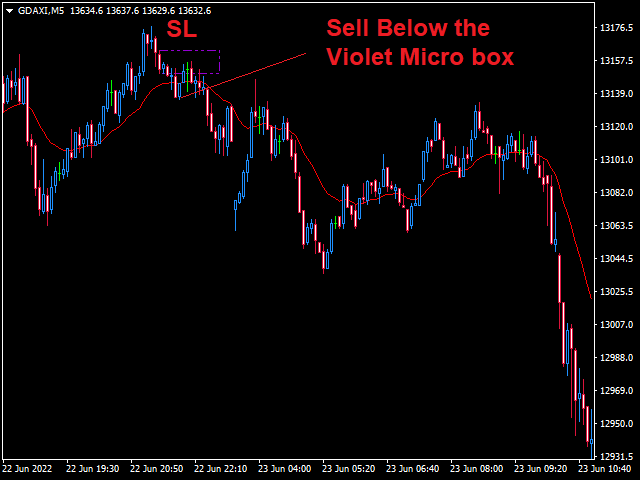
Micro Breakouts are the small boxes on the upper and lower edges of both Bulls / Bears Breakouts. You can buy when the Blue micro breakout forms or when the Green/YellowGreen Micro draws. Similarly, if a Violet or Brown Micro box form take a sell below.
Another Question, Can I use the Micro Boxes together with Moving Averages?
Yes, this is another use for Micro Boxes. Use a 21 EMA as your price monitor, then open buys if the Blue or YellowGreen/Green Boxes form followed by a candle opening above the Moving Average. Better and strong signals are ones where the Micro boxes draw when the price is below the Moving Average and then price breaks above the 21EMA OR the Micro boxes draw at the beginning of the trend and the candles are not oversized; place your SL below previous low. On the other hand, sell if the Violet or Brown Micro boxes form followed by a candle opening below the 21EMA. As previously stated, the better signals form when the micro boxes form above the Moving Average and then the price breaks below the 21 EMA. Place SL above previous high.
See the images.
Download MT5 Version:https://www.mql5.com/en/market/product/76975
Download MT4 Version: https://www.mql5.com/en/market/product/83143

ALFRED MURIITHI
OUTSIDE THE BOX (OTB)- Q/A
10. What are Micro Breakouts and how can I use them?
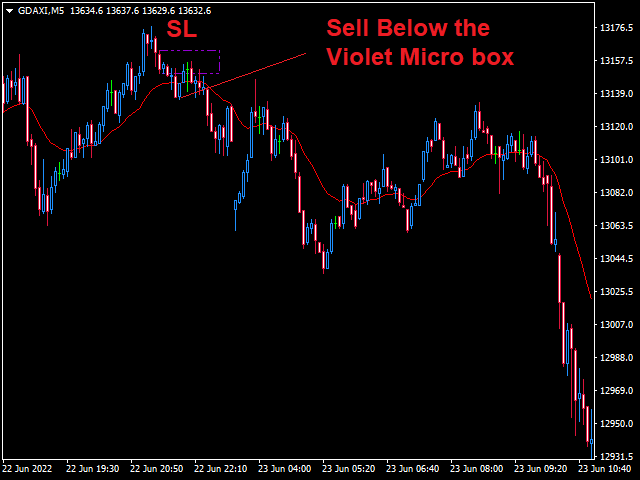
Micro Breakouts are the small boxes on the upper and lower edges of both Bulls / Bears Breakouts. You can buy when the Blue micro breakout forms or when the Green/YellowGreen Micro draws. Similarly, if a Violet or Brown Micro box form take a sell below.
Another Question, Can I use the Micro Boxes together with Moving Averages?
Yes, this is another use for Micro Boxes. Use a 21 EMA as your price monitor, then open buys if the Blue or YellowGreen/Green Boxes form followed by a candle opening above the Moving Average. Better and strong signals are ones where the Micro boxes draw when the price is below the Moving Average and then price breaks above the 21EMA OR the Micro boxes draw at the beginning of the trend and the candles are not oversized; place your SL below previous low. On the other hand, sell if the Violet or Brown Micro boxes form followed by a candle opening below the 21EMA. As previously stated, the better signals form when the micro boxes form above the Moving Average and then the price breaks below the 21 EMA. Place SL above previous high.
See the images.
Download MT5 Version:https://www.mql5.com/en/market/product/76975
Download MT4 Version: https://www.mql5.com/en/market/product/83143
10. What are Micro Breakouts and how can I use them?
Micro Breakouts are the small boxes on the upper and lower edges of both Bulls / Bears Breakouts. You can buy when the Blue micro breakout forms or when the Green/YellowGreen Micro draws. Similarly, if a Violet or Brown Micro box form take a sell below.
Another Question, Can I use the Micro Boxes together with Moving Averages?
Yes, this is another use for Micro Boxes. Use a 21 EMA as your price monitor, then open buys if the Blue or YellowGreen/Green Boxes form followed by a candle opening above the Moving Average. Better and strong signals are ones where the Micro boxes draw when the price is below the Moving Average and then price breaks above the 21EMA OR the Micro boxes draw at the beginning of the trend and the candles are not oversized; place your SL below previous low. On the other hand, sell if the Violet or Brown Micro boxes form followed by a candle opening below the 21EMA. As previously stated, the better signals form when the micro boxes form above the Moving Average and then the price breaks below the 21 EMA. Place SL above previous high.
See the images.
Download MT5 Version:https://www.mql5.com/en/market/product/76975
Download MT4 Version: https://www.mql5.com/en/market/product/83143

ALFRED MURIITHI
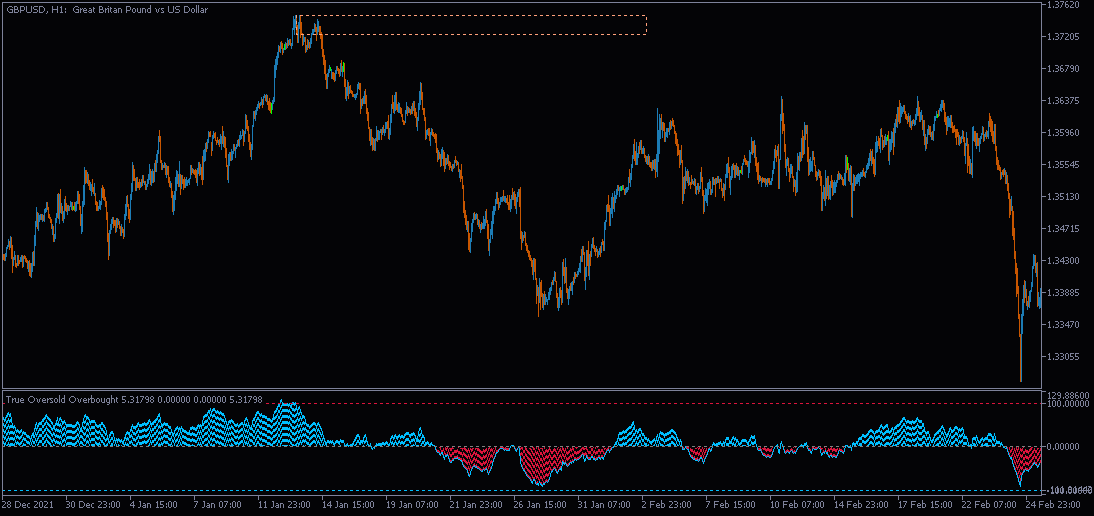
Don't follow the market blindly. The True Oversold Overbought indicator (mt4/5) indicates for you when the truly oversold or overbought. Besides, it gives allows you to trade breakouts if the market is about to break or obey these levels.
The True Oversold Overbought indicator provides you with ability to swiftly check whether the asset is oversold or overbought.
Other than complementing your trading with True Oversold Overbought, you can use the indicator as your only trading system.
It works with all forex instruments and will save you the headache of estimating when the market is due for a reversal or retracement.
When the "Super Charge" feature is enabled, the areas where the price is in oversold/overbought status are amplified to give you a clear state of the market,therefore, you will not miss the moment to prepare for a reversal/retracement.
Alternatively, when the "Super Charge" feature is disabled, the indicator still shows the oversold and overbought levels but this time you get a broader view of the market.
Advantages
✔️It is not overly sensitive or keep touching oversold/overbought levels.
✔️Open trades early when the price is exiting overbought / oversold levels and close trades at the right time.
✔️Trade when there is noise and when the market is silent.
✔️No complex settings since the default settings work perfectly.
✔️The indicator displays on the separate window and also show rectangles on the main chart.
✔️When the overbought and oversold rectangles draw, it is time to buy if price opens above the rectangles and sell if the candle opens below.
Note: If the overbought rectangle is formed but a candle open above it, its an indication the trend will continue surging for a while before breaking below.
Similarly, the continued drop in price below the oversold rectangle indicates the price might continue in the same direction before bulls takes control.
⭐️⭐️⭐️⭐️⭐️True Oversold Overbought MT5: https://www.mql5.com/en/market/product/79336
⭐️⭐️⭐️⭐️⭐️True Oversold Overbought MT4: https://www.mql5.com/en/market/product/68396
🔥🔥🔥🔥🔥 Download other indicators: https://www.mql5.com/en/users/pipmontra/seller

ALFRED MURIITHI

NEW UPDATE
✔️✔️Alerts
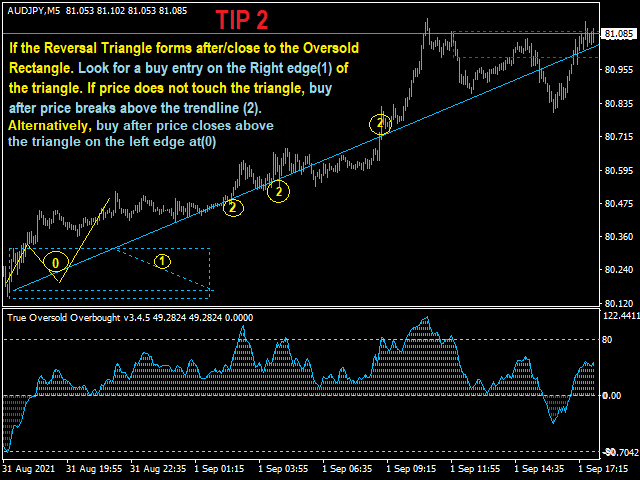
✔️✔️Reversal Triangles for Bulls and Bears.
The True Oversold Overbought indicator provides you with ability to swiftly check whether the asset is oversold or overbought.
Other than complementing your trading with True Oversold Overbought, you can use the indicator as your only trading system.
It works with all forex instruments and will save you the headache of estimating when the market is due for a reversal or retracement.
When the "Super Charge" feature is enabled, the areas where the price is in oversold/overbought status are amplified to give you a clear state of the market,therefore, you will not miss the moment to prepare for a reversal/retracement.
Alternatively, when the "Super Charge" feature is disabled, the indicator still shows the oversold and overbought levels but this time you get a broader view of the market.
Advantages
✔️See Reversal zones with visual Triangles
✔️Get Alerts when the price is in extreme areas and when price is leaving the zone.
✔️Trade when there is noise and when the market is silent.
✔️Open trades early when the price is exiting overbought / oversold levels and close trades at the right time.
✔️Trade when there is noise and when the market is silent.
✔️No complex settings since the default settings work perfectly.
✔️The indicator displays on the separate window and also show rectangles on the main chart.
✔️When the overbought and oversold rectangles draw, it is time to buy if price opens above the rectangles and sell if the candle opens below.
Note: If the overbought rectangle is formed but a candle open above it, its an indication the trend will continue surging for a while before breaking below.
Similarly, the continued drop in price below the oversold rectangle indicates the price might continue in the same direction before bulls takes control.
⭐️⭐️⭐️⭐️⭐️True Oversold Overbought MT5: https://www.mql5.com/en/market/product/79336
⭐️⭐️⭐️⭐️⭐️True Oversold Overbought MT4: https://www.mql5.com/en/market/product/68396
🔥🔥🔥🔥🔥 Download other indicators: https://www.mql5.com/en/users/pipmontra/seller

ALFRED MURIITHI
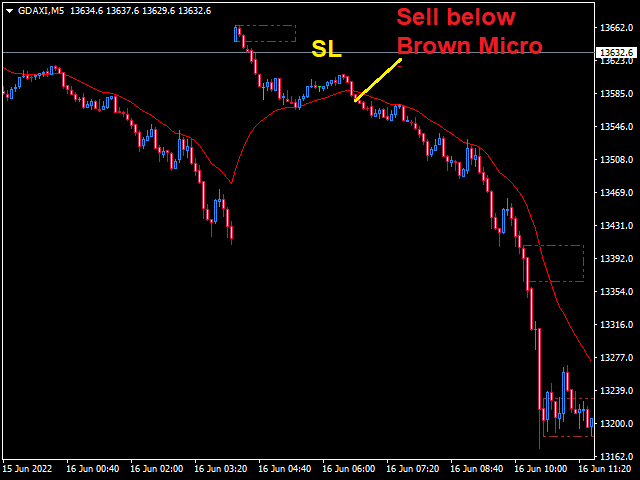
Always know the market level by using Outside The Box trading system.
👉MT4 Version: https://www.mql5.com/en/market/product/83143
👉MT5 Version: https://www.mql5.com/en/market/product/76975
For the first 10 buyers, we are giving a free copy of Price Elevator> https://www.mql5.com/en/market/product/82757
👉ALL Indicators: https://www.mql5.com/en/users/pipmontra/seller
👉MT4 Version: https://www.mql5.com/en/market/product/83143
👉MT5 Version: https://www.mql5.com/en/market/product/76975
For the first 10 buyers, we are giving a free copy of Price Elevator> https://www.mql5.com/en/market/product/82757
👉ALL Indicators: https://www.mql5.com/en/users/pipmontra/seller

ALFRED MURIITHI
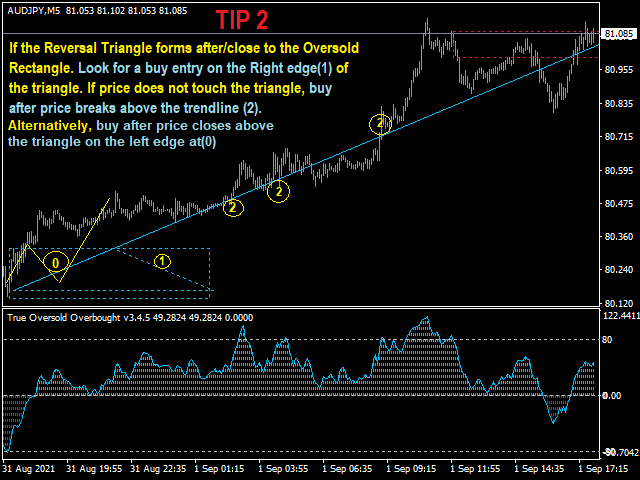
NEW UPDATE
✔️✔️Alerts
✔️✔️Reversal Triangles for Bulls and Bears.
The True Oversold Overbought indicator provides you with ability to swiftly check whether the asset is oversold or overbought.
Other than complementing your trading with True Oversold Overbought, you can use the indicator as your only trading system.
It works with all forex instruments and will save you the headache of estimating when the market is due for a reversal or retracement.
When the "Super Charge" feature is enabled, the areas where the price is in oversold/overbought status are amplified to give you a clear state of the market,therefore, you will not miss the moment to prepare for a reversal/retracement.
Alternatively, when the "Super Charge" feature is disabled, the indicator still shows the oversold and overbought levels but this time you get a broader view of the market.
Advantages
✔️See Reversal zones with visual Triangles
✔️Get Alerts when the price is in extreme areas and when price is leaving the zone.
✔️Trade when there is noise and when the market is silent.
✔️Open trades early when the price is exiting overbought / oversold levels and close trades at the right time.
✔️Trade when there is noise and when the market is silent.
✔️No complex settings since the default settings work perfectly.
✔️The indicator displays on the separate window and also show rectangles on the main chart.
✔️When the overbought and oversold rectangles draw, it is time to buy if price opens above the rectangles and sell if the candle opens below.
Note: If the overbought rectangle is formed but a candle open above it, its an indication the trend will continue surging for a while before breaking below.
Similarly, the continued drop in price below the oversold rectangle indicates the price might continue in the same direction before bulls takes control.
⭐️⭐️⭐️⭐️⭐️True Oversold Overbought MT5: https://www.mql5.com/en/market/product/79336
⭐️⭐️⭐️⭐️⭐️True Oversold Overbought MT4: https://www.mql5.com/en/market/product/68396
🔥🔥🔥🔥🔥 Download other indicators: https://www.mql5.com/en/users/pipmontra/seller
✔️✔️Alerts
✔️✔️Reversal Triangles for Bulls and Bears.
The True Oversold Overbought indicator provides you with ability to swiftly check whether the asset is oversold or overbought.
Other than complementing your trading with True Oversold Overbought, you can use the indicator as your only trading system.
It works with all forex instruments and will save you the headache of estimating when the market is due for a reversal or retracement.
When the "Super Charge" feature is enabled, the areas where the price is in oversold/overbought status are amplified to give you a clear state of the market,therefore, you will not miss the moment to prepare for a reversal/retracement.
Alternatively, when the "Super Charge" feature is disabled, the indicator still shows the oversold and overbought levels but this time you get a broader view of the market.
Advantages
✔️See Reversal zones with visual Triangles
✔️Get Alerts when the price is in extreme areas and when price is leaving the zone.
✔️Trade when there is noise and when the market is silent.
✔️Open trades early when the price is exiting overbought / oversold levels and close trades at the right time.
✔️Trade when there is noise and when the market is silent.
✔️No complex settings since the default settings work perfectly.
✔️The indicator displays on the separate window and also show rectangles on the main chart.
✔️When the overbought and oversold rectangles draw, it is time to buy if price opens above the rectangles and sell if the candle opens below.
Note: If the overbought rectangle is formed but a candle open above it, its an indication the trend will continue surging for a while before breaking below.
Similarly, the continued drop in price below the oversold rectangle indicates the price might continue in the same direction before bulls takes control.
⭐️⭐️⭐️⭐️⭐️True Oversold Overbought MT5: https://www.mql5.com/en/market/product/79336
⭐️⭐️⭐️⭐️⭐️True Oversold Overbought MT4: https://www.mql5.com/en/market/product/68396
🔥🔥🔥🔥🔥 Download other indicators: https://www.mql5.com/en/users/pipmontra/seller

ALFRED MURIITHI
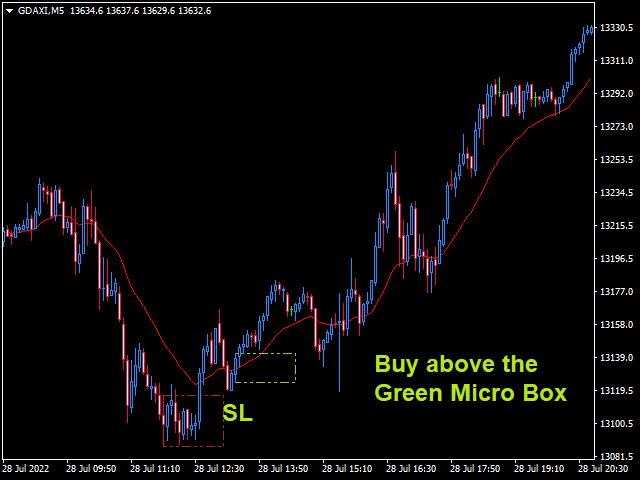
Always know the market level by using Outside The Box trading system.
👉MT4 Version: https://www.mql5.com/en/market/product/83143
👉MT5 Version: https://www.mql5.com/en/market/product/76975
For the first 10 buyers, we are giving a free copy of Price Elevator> https://www.mql5.com/en/market/product/82757
👉ALL Indicators: https://www.mql5.com/en/users/pipmontra/seller
👉MT4 Version: https://www.mql5.com/en/market/product/83143
👉MT5 Version: https://www.mql5.com/en/market/product/76975
For the first 10 buyers, we are giving a free copy of Price Elevator> https://www.mql5.com/en/market/product/82757
👉ALL Indicators: https://www.mql5.com/en/users/pipmontra/seller

ALFRED MURIITHI
NEW UPDATE
✔️✔️Alerts
✔️✔️Reversal Triangles for Bulls and Bears.
The True Oversold Overbought indicator provides you with ability to swiftly check whether the asset is oversold or overbought.
Other than complementing your trading with True Oversold Overbought, you can use the indicator as your only trading system.
It works with all forex instruments and will save you the headache of estimating when the market is due for a reversal or retracement.
When the "Super Charge" feature is enabled, the areas where the price is in oversold/overbought status are amplified to give you a clear state of the market,therefore, you will not miss the moment to prepare for a reversal/retracement.
Alternatively, when the "Super Charge" feature is disabled, the indicator still shows the oversold and overbought levels but this time you get a broader view of the market.
Advantages
✔️See Reversal zones with visual Triangles
✔️Get Alerts when the price is in extreme areas and when price is leaving the zone.
✔️Trade when there is noise and when the market is silent.
✔️Open trades early when the price is exiting overbought / oversold levels and close trades at the right time.
✔️Trade when there is noise and when the market is silent.
✔️No complex settings since the default settings work perfectly.
✔️The indicator displays on the separate window and also show rectangles on the main chart.
✔️When the overbought and oversold rectangles draw, it is time to buy if price opens above the rectangles and sell if the candle opens below.
Note: If the overbought rectangle is formed but a candle open above it, its an indication the trend will continue surging for a while before breaking below.
Similarly, the continued drop in price below the oversold rectangle indicates the price might continue in the same direction before bulls takes control.
⭐️⭐️⭐️⭐️⭐️True Oversold Overbought MT5: https://www.mql5.com/en/market/product/79336
⭐️⭐️⭐️⭐️⭐️True Oversold Overbought MT4: https://www.mql5.com/en/market/product/68396
🔥🔥🔥🔥🔥 Download other indicators: https://www.mql5.com/en/users/pipmontra/seller
✔️✔️Alerts
✔️✔️Reversal Triangles for Bulls and Bears.
The True Oversold Overbought indicator provides you with ability to swiftly check whether the asset is oversold or overbought.
Other than complementing your trading with True Oversold Overbought, you can use the indicator as your only trading system.
It works with all forex instruments and will save you the headache of estimating when the market is due for a reversal or retracement.
When the "Super Charge" feature is enabled, the areas where the price is in oversold/overbought status are amplified to give you a clear state of the market,therefore, you will not miss the moment to prepare for a reversal/retracement.
Alternatively, when the "Super Charge" feature is disabled, the indicator still shows the oversold and overbought levels but this time you get a broader view of the market.
Advantages
✔️See Reversal zones with visual Triangles
✔️Get Alerts when the price is in extreme areas and when price is leaving the zone.
✔️Trade when there is noise and when the market is silent.
✔️Open trades early when the price is exiting overbought / oversold levels and close trades at the right time.
✔️Trade when there is noise and when the market is silent.
✔️No complex settings since the default settings work perfectly.
✔️The indicator displays on the separate window and also show rectangles on the main chart.
✔️When the overbought and oversold rectangles draw, it is time to buy if price opens above the rectangles and sell if the candle opens below.
Note: If the overbought rectangle is formed but a candle open above it, its an indication the trend will continue surging for a while before breaking below.
Similarly, the continued drop in price below the oversold rectangle indicates the price might continue in the same direction before bulls takes control.
⭐️⭐️⭐️⭐️⭐️True Oversold Overbought MT5: https://www.mql5.com/en/market/product/79336
⭐️⭐️⭐️⭐️⭐️True Oversold Overbought MT4: https://www.mql5.com/en/market/product/68396
🔥🔥🔥🔥🔥 Download other indicators: https://www.mql5.com/en/users/pipmontra/seller

ALFRED MURIITHI

Always know the market level by using Outside The Box trading system.
👉MT4 Version: https://www.mql5.com/en/market/product/83143
👉MT5 Version: https://www.mql5.com/en/market/product/76975
For the first 10 buyers, we are giving a free copy of Price Elevator> https://www.mql5.com/en/market/product/82757
👉ALL Indicators: https://www.mql5.com/en/users/pipmontra/seller
👉MT4 Version: https://www.mql5.com/en/market/product/83143
👉MT5 Version: https://www.mql5.com/en/market/product/76975
For the first 10 buyers, we are giving a free copy of Price Elevator> https://www.mql5.com/en/market/product/82757
👉ALL Indicators: https://www.mql5.com/en/users/pipmontra/seller

ALFRED MURIITHI

Trade RENKO CHART retracements like pro with Retracement Feeder
⭐️⭐️⭐️⭐️⭐️ MT5 version: https://www.mql5.com/en/market/product/71340
⭐️⭐️⭐️⭐️⭐️ MT4 version: https://www.mql5.com/en/market/product/67443
⭐️⭐️⭐️⭐️⭐️ MT5 version: https://www.mql5.com/en/market/product/71340
⭐️⭐️⭐️⭐️⭐️ MT4 version: https://www.mql5.com/en/market/product/67443
ALFRED MURIITHI - Innovicient Limited
The Retracement Feeder checks for retracement opportunities after the first move has occurred.
Basically it scans for the second wave of trend.
Works with any financial instrument,
It does not repaint/change color or cancel arrows,
Easy to set and use.
Works great with Renko Charts
⭐️⭐️⭐️⭐️⭐️ MT5 version: https://www.mql5.com/en/market/product/71340
⭐️⭐️⭐️⭐️⭐️ MT4 version: https://www.mql5.com/en/market/product/67443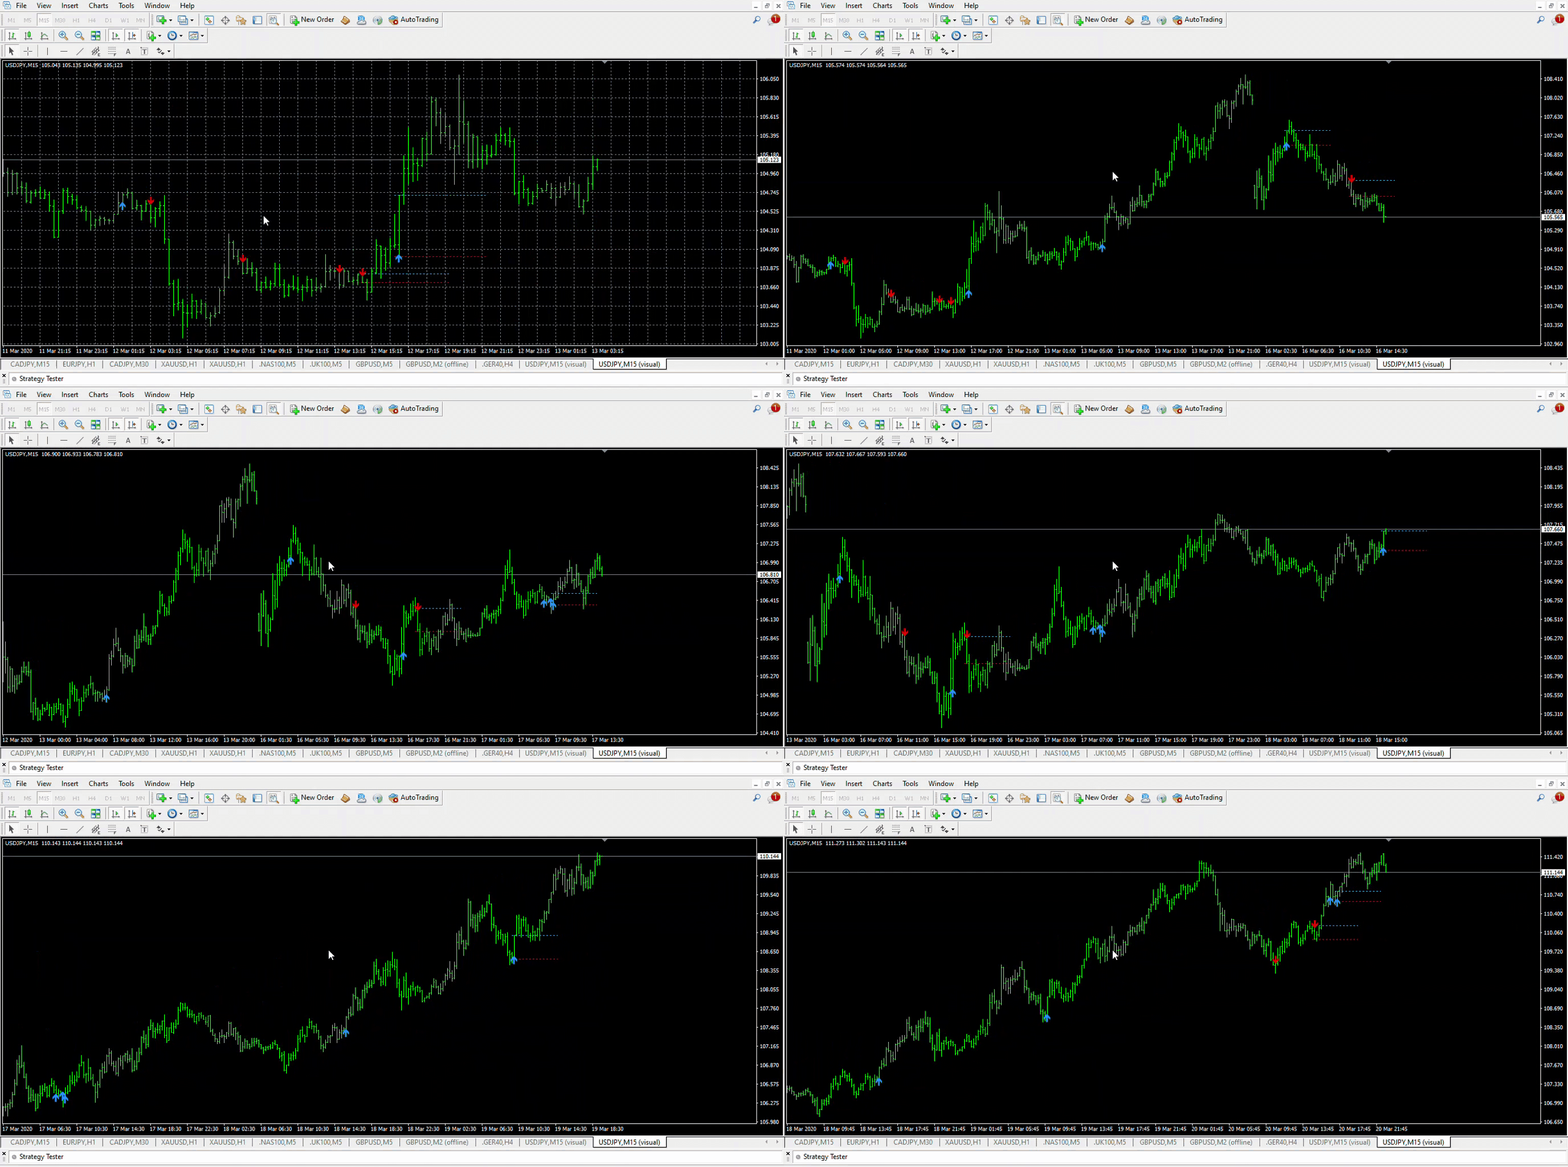

ALFRED MURIITHI

The Retracement Feeder checks for retracement opportunities after the first move has occurred.
Basically it scans for the second wave of trend.
Works with any financial instrument,
It does not repaint/change color or cancel arrows,
Easy to set and use.
Works great with Renko Charts
⭐️⭐️⭐️⭐️⭐️ MT5 version: https://www.mql5.com/en/market/product/71340
⭐️⭐️⭐️⭐️⭐️ MT4 version: https://www.mql5.com/en/market/product/67443
Basically it scans for the second wave of trend.
Works with any financial instrument,
It does not repaint/change color or cancel arrows,
Easy to set and use.
Works great with Renko Charts
⭐️⭐️⭐️⭐️⭐️ MT5 version: https://www.mql5.com/en/market/product/71340
⭐️⭐️⭐️⭐️⭐️ MT4 version: https://www.mql5.com/en/market/product/67443

ALFRED MURIITHI
NEW UPDATE
✔️✔️Alerts
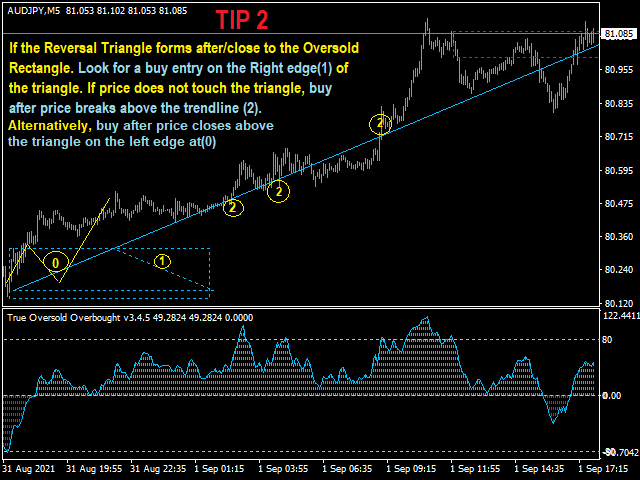
✔️✔️Reversal Triangles for Bulls and Bears.
The True Oversold Overbought indicator provides you with ability to swiftly check whether the asset is oversold or overbought.
Other than complementing your trading with True Oversold Overbought, you can use the indicator as your only trading system.
It works with all forex instruments and will save you the headache of estimating when the market is due for a reversal or retracement.
When the "Super Charge" feature is enabled, the areas where the price is in oversold/overbought status are amplified to give you a clear state of the market,therefore, you will not miss the moment to prepare for a reversal/retracement.
Alternatively, when the "Super Charge" feature is disabled, the indicator still shows the oversold and overbought levels but this time you get a broader view of the market.
Advantages
✔️See Reversal zones with visual Triangles
✔️Get Alerts when the price is in extreme areas and when price is leaving the zone.
✔️Trade when there is noise and when the market is silent.
✔️Open trades early when the price is exiting overbought / oversold levels and close trades at the right time.
✔️Trade when there is noise and when the market is silent.
✔️No complex settings since the default settings work perfectly.
✔️The indicator displays on the separate window and also show rectangles on the main chart.
✔️When the overbought and oversold rectangles draw, it is time to buy if price opens above the rectangles and sell if the candle opens below.
Note: If the overbought rectangle is formed but a candle open above it, its an indication the trend will continue surging for a while before breaking below.
Similarly, the continued drop in price below the oversold rectangle indicates the price might continue in the same direction before bulls takes control.
⭐️⭐️⭐️⭐️⭐️True Oversold Overbought MT5: https://www.mql5.com/en/market/product/79336
⭐️⭐️⭐️⭐️⭐️True Oversold Overbought MT4: https://www.mql5.com/en/market/product/68396
🔥🔥🔥🔥🔥 Download other indicators: https://www.mql5.com/en/users/pipmontra/seller
✔️✔️Alerts
✔️✔️Reversal Triangles for Bulls and Bears.
The True Oversold Overbought indicator provides you with ability to swiftly check whether the asset is oversold or overbought.
Other than complementing your trading with True Oversold Overbought, you can use the indicator as your only trading system.
It works with all forex instruments and will save you the headache of estimating when the market is due for a reversal or retracement.
When the "Super Charge" feature is enabled, the areas where the price is in oversold/overbought status are amplified to give you a clear state of the market,therefore, you will not miss the moment to prepare for a reversal/retracement.
Alternatively, when the "Super Charge" feature is disabled, the indicator still shows the oversold and overbought levels but this time you get a broader view of the market.
Advantages
✔️See Reversal zones with visual Triangles
✔️Get Alerts when the price is in extreme areas and when price is leaving the zone.
✔️Trade when there is noise and when the market is silent.
✔️Open trades early when the price is exiting overbought / oversold levels and close trades at the right time.
✔️Trade when there is noise and when the market is silent.
✔️No complex settings since the default settings work perfectly.
✔️The indicator displays on the separate window and also show rectangles on the main chart.
✔️When the overbought and oversold rectangles draw, it is time to buy if price opens above the rectangles and sell if the candle opens below.
Note: If the overbought rectangle is formed but a candle open above it, its an indication the trend will continue surging for a while before breaking below.
Similarly, the continued drop in price below the oversold rectangle indicates the price might continue in the same direction before bulls takes control.
⭐️⭐️⭐️⭐️⭐️True Oversold Overbought MT5: https://www.mql5.com/en/market/product/79336
⭐️⭐️⭐️⭐️⭐️True Oversold Overbought MT4: https://www.mql5.com/en/market/product/68396
🔥🔥🔥🔥🔥 Download other indicators: https://www.mql5.com/en/users/pipmontra/seller

ALFRED MURIITHI
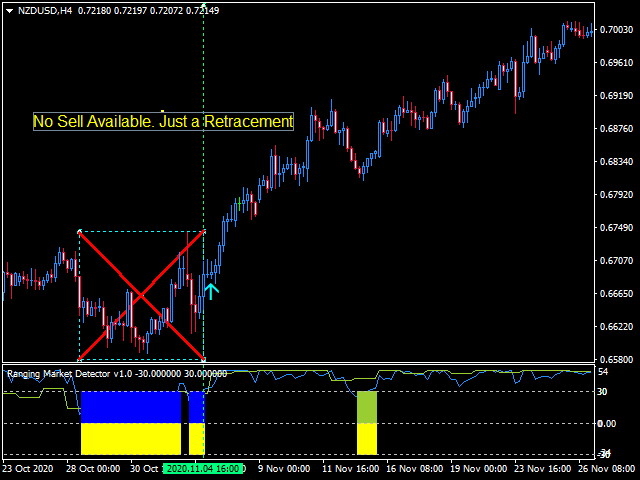
Ranging Market Detector scans the market for momentum and price to check whether the price is range-bound and the direction to which it will breakout.
New Update: It now draws Critical Boxes as support/resistance areas.
It works with all the all assets and visually shows you the instances when the market is either ranging or trending.
Informs when the price has finished a retracement, an opportune time to re-enter the trend early. This will help you in position management.
It works very well for Scalping, Day trading, and Swing trading. Helpful in all timeframes
Great tool for every trader.
Features:
If Disable Histograms=true. This disables the Histograms.
The indicator then displays only the Short-term/Fast Signal lines, the Multi-timeframe Long-term Signal lines, and levels -20, 0, 20, and colored Dots.
BUY: After the LightGreen dot forms, but wait for the candle to open above the YellowGreen box on the chart.
OR After the Red dot forms, but a candle open above the Red box on the chart.
SELL: After the Red dot forms, but wait for the candle to open below the Red box on the chart.
OR After the YellowGreen dot forms, but a candle open below the YellowGreen box on the chart.
If Disable Histograms=false. This displays the Histograms, both signal lines and levels -30, 0, and 30
When the Histograms are drawn on a section of the indicator, the market is either entering ranging state or changing direction.
If there are no histograms being drawn, the market has started to trend.
BUY:
If both the short-term and the Long-term signal lines are above 0 , but wait for the candle to open above the YellowGreen box on the chart.
OR If both the short-term and the Long-term signal lines are below 0 , but a candle open above the Red box on the chart.
SELL:
If both the short-term and the Long-term signal lines are below 0 , but wait for the candle to open below the Red box on the chart.
OR If both the short-term and the Long-term signal lines are above 0 , but a candle open below the YellowGreen box on the chart.
👉 Ranging Market Detector: https://www.mql5.com/en/market/product/66062
🔥🔥🔥🔥🔥 Download other indicators: https://www.mql5.com/en/users/pipmontra/seller

ALFRED MURIITHI
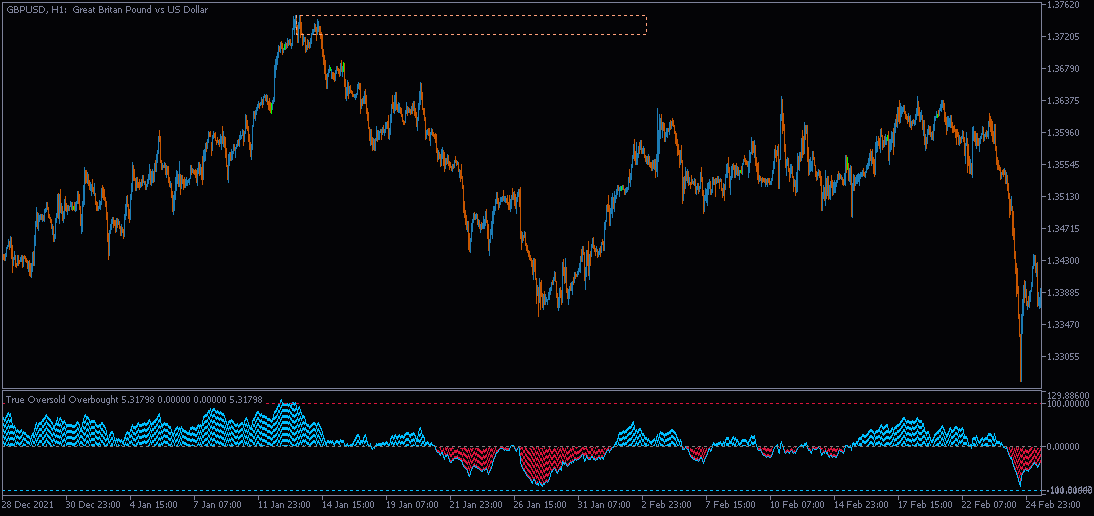
Don't follow the market blindly. The True Oversold Overbought indicator (mt4/5) indicates for you when the truly oversold or overbought. Besides, it gives allows you to trade breakouts if the market is about to break or obey these levels.
The True Oversold Overbought indicator provides you with ability to swiftly check whether the asset is oversold or overbought.
Other than complementing your trading with True Oversold Overbought, you can use the indicator as your only trading system.
It works with all forex instruments and will save you the headache of estimating when the market is due for a reversal or retracement.
When the "Super Charge" feature is enabled, the areas where the price is in oversold/overbought status are amplified to give you a clear state of the market,therefore, you will not miss the moment to prepare for a reversal/retracement.
Alternatively, when the "Super Charge" feature is disabled, the indicator still shows the oversold and overbought levels but this time you get a broader view of the market.
Advantages
✔️It is not overly sensitive or keep touching oversold/overbought levels.
✔️Open trades early when the price is exiting overbought / oversold levels and close trades at the right time.
✔️Trade when there is noise and when the market is silent.
✔️No complex settings since the default settings work perfectly.
✔️The indicator displays on the separate window and also show rectangles on the main chart.
✔️When the overbought and oversold rectangles draw, it is time to buy if price opens above the rectangles and sell if the candle opens below.
Note: If the overbought rectangle is formed but a candle open above it, its an indication the trend will continue surging for a while before breaking below.
Similarly, the continued drop in price below the oversold rectangle indicates the price might continue in the same direction before bulls takes control.
⭐️⭐️⭐️⭐️⭐️True Oversold Overbought MT5: https://www.mql5.com/en/market/product/79336
⭐️⭐️⭐️⭐️⭐️True Oversold Overbought MT4: https://www.mql5.com/en/market/product/68396
🔥🔥🔥🔥🔥 Download other indicators: https://www.mql5.com/en/users/pipmontra/seller
The True Oversold Overbought indicator provides you with ability to swiftly check whether the asset is oversold or overbought.
Other than complementing your trading with True Oversold Overbought, you can use the indicator as your only trading system.
It works with all forex instruments and will save you the headache of estimating when the market is due for a reversal or retracement.
When the "Super Charge" feature is enabled, the areas where the price is in oversold/overbought status are amplified to give you a clear state of the market,therefore, you will not miss the moment to prepare for a reversal/retracement.
Alternatively, when the "Super Charge" feature is disabled, the indicator still shows the oversold and overbought levels but this time you get a broader view of the market.
Advantages
✔️It is not overly sensitive or keep touching oversold/overbought levels.
✔️Open trades early when the price is exiting overbought / oversold levels and close trades at the right time.
✔️Trade when there is noise and when the market is silent.
✔️No complex settings since the default settings work perfectly.
✔️The indicator displays on the separate window and also show rectangles on the main chart.
✔️When the overbought and oversold rectangles draw, it is time to buy if price opens above the rectangles and sell if the candle opens below.
Note: If the overbought rectangle is formed but a candle open above it, its an indication the trend will continue surging for a while before breaking below.
Similarly, the continued drop in price below the oversold rectangle indicates the price might continue in the same direction before bulls takes control.
⭐️⭐️⭐️⭐️⭐️True Oversold Overbought MT5: https://www.mql5.com/en/market/product/79336
⭐️⭐️⭐️⭐️⭐️True Oversold Overbought MT4: https://www.mql5.com/en/market/product/68396
🔥🔥🔥🔥🔥 Download other indicators: https://www.mql5.com/en/users/pipmontra/seller

ALFRED MURIITHI
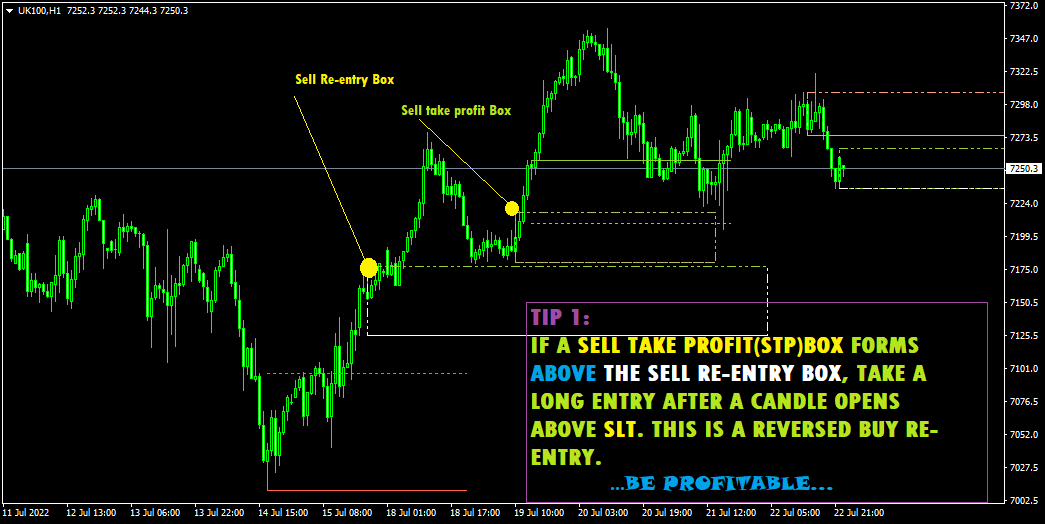
Always know the market level by using Outside The Box trading system.
For the first 10 buyers, we are giving a free copy of Price Elevator> https://www.mql5.com/en/market/product/82757
👉MT4 Version: https://www.mql5.com/en/market/product/83143
👉MT5 Version: https://www.mql5.com/en/market/product/76975
👉ALL Indicators: https://www.mql5.com/en/users/pipmontra/seller
For the first 10 buyers, we are giving a free copy of Price Elevator> https://www.mql5.com/en/market/product/82757
👉MT4 Version: https://www.mql5.com/en/market/product/83143
👉MT5 Version: https://www.mql5.com/en/market/product/76975
👉ALL Indicators: https://www.mql5.com/en/users/pipmontra/seller

ALFRED MURIITHI
The Outside The Box (OTB) is a complete trading system that provides the user with immense trading ability by highlighting on the chart areas where the trader should prepare to
Re-enter the trend after pullbacks (Pullback trading strategy)
Take partial/complete profit(Profit taking strategy), and
Trade breakouts (Stock breakout strategy)
Irrespective of whether you are trading,Synthetic Indices,Forex,Cryptocurrencies, or Stocks the Outside The Box System works wonders.
How do I know there is a trend breakout- Breakout Zone
This is the zone between the continuous and dotted lines. The market is expected to breakout on the side of the solid continuous line. After the Breakout Zone draws, you should plan to open trades in the direction after the Re-Entry Zone is displayed. You are recommended to avoid opening buys when the price trends below the bearish breakout. Similarly, don’t go short when the bullish breakout is activated. Another vital point, expect the zones to act as support/resistance.
When do I re-enter the trend. Re-entry Zone
The Re-entry Zone is always below the Breakout Zone during a bear market. However, it can appear above the Breakout Zone if the market is consolidating. On the same note, the bull market Re-entry Zone is always above the Breakout Zone, though this may be overlooked in the early stages of the trend formation. Buy if a candle opens above the buy re-entry zone if bulls are in control and wait for a candle to open below the sell re-entry zone for you to sell during a bear market.
How do I take profit-Take Profit Zones
This module, Take Profit Zones, is useful in that irrespective of the indicator you are using it shows areas where you must lock or take some profit. These zones are displayed when there is either bull or bear market. This is helpful in that you are able to lock most of the gains before a retracement or reversal. On a downtrend, you can re-enter the market, with smaller lots, after a candle opens and closes below the Take Profit Zones. Equally, go long after a candle opens and closes above the zone if you are on an uptrend.
This system has been tested on ordinary and Renko charts. However, use the system together with Renko charts to experience the best outcome and display of these critical zones.
Always know the market level by using Outside The Box trading system.
For the first 10 buyers, we are giving a free copy of Price Elevator> https://www.mql5.com/en/market/product/82757
👉MT4 Version: https://www.mql5.com/en/market/product/83143
👉MT5 Version: https://www.mql5.com/en/market/product/76975
👉ALL Indicators: https://www.mql5.com/en/users/pipmontra/seller
ALFRED MURIITHI

Don't follow the market blindly. The True Oversold Overbought indicator (mt4/5) indicates for you when the truly oversold or overbought. Besides, it gives allows you to trade breakouts if the market is about to break or obey these levels.
The True Oversold Overbought indicator provides you with ability to swiftly check whether the asset is oversold or overbought.
Other than complementing your trading with True Oversold Overbought, you can use the indicator as your only trading system.
It works with all forex instruments and will save you the headache of estimating when the market is due for a reversal or retracement.
When the "Super Charge" feature is enabled, the areas where the price is in oversold/overbought status are amplified to give you a clear state of the market,therefore, you will not miss the moment to prepare for a reversal/retracement.
Alternatively, when the "Super Charge" feature is disabled, the indicator still shows the oversold and overbought levels but this time you get a broader view of the market.
Advantages
✔️It is not overly sensitive or keep touching oversold/overbought levels.
✔️Open trades early when the price is exiting overbought / oversold levels and close trades at the right time.
✔️Trade when there is noise and when the market is silent.
✔️No complex settings since the default settings work perfectly.
✔️The indicator displays on the separate window and also show rectangles on the main chart.
✔️When the overbought and oversold rectangles draw, it is time to buy if price opens above the rectangles and sell if the candle opens below.
Note: If the overbought rectangle is formed but a candle open above it, its an indication the trend will continue surging for a while before breaking below.
Similarly, the continued drop in price below the oversold rectangle indicates the price might continue in the same direction before bulls takes control.
⭐️⭐️⭐️⭐️⭐️True Oversold Overbought MT5: https://www.mql5.com/en/market/product/79336
⭐️⭐️⭐️⭐️⭐️True Oversold Overbought MT4: https://www.mql5.com/en/market/product/68396
🔥🔥🔥🔥🔥 Download other indicators: https://www.mql5.com/en/users/pipmontra/seller
The True Oversold Overbought indicator provides you with ability to swiftly check whether the asset is oversold or overbought.
Other than complementing your trading with True Oversold Overbought, you can use the indicator as your only trading system.
It works with all forex instruments and will save you the headache of estimating when the market is due for a reversal or retracement.
When the "Super Charge" feature is enabled, the areas where the price is in oversold/overbought status are amplified to give you a clear state of the market,therefore, you will not miss the moment to prepare for a reversal/retracement.
Alternatively, when the "Super Charge" feature is disabled, the indicator still shows the oversold and overbought levels but this time you get a broader view of the market.
Advantages
✔️It is not overly sensitive or keep touching oversold/overbought levels.
✔️Open trades early when the price is exiting overbought / oversold levels and close trades at the right time.
✔️Trade when there is noise and when the market is silent.
✔️No complex settings since the default settings work perfectly.
✔️The indicator displays on the separate window and also show rectangles on the main chart.
✔️When the overbought and oversold rectangles draw, it is time to buy if price opens above the rectangles and sell if the candle opens below.
Note: If the overbought rectangle is formed but a candle open above it, its an indication the trend will continue surging for a while before breaking below.
Similarly, the continued drop in price below the oversold rectangle indicates the price might continue in the same direction before bulls takes control.
⭐️⭐️⭐️⭐️⭐️True Oversold Overbought MT5: https://www.mql5.com/en/market/product/79336
⭐️⭐️⭐️⭐️⭐️True Oversold Overbought MT4: https://www.mql5.com/en/market/product/68396
🔥🔥🔥🔥🔥 Download other indicators: https://www.mql5.com/en/users/pipmontra/seller

: