Returns Momentum Oscillator RMO
- Indikatoren
- Florian Nuebling
- Version: 1.0
- Aktivierungen: 5
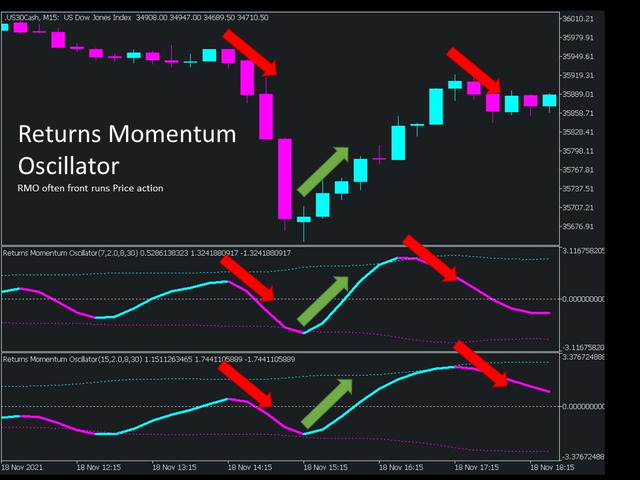
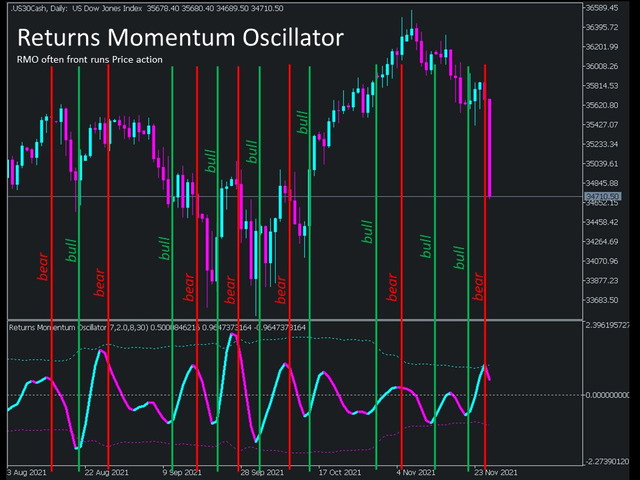
Der Returns Momentum Oscillator (RMO) zeigt die Differenz der exponentiell gewichteten Volatilität an. Er wird verwendet, um Höchst- und Tiefststände des Marktes zu ermitteln. Die Volatilität tritt in Wellen auf, und da die Renditen oft der Preisentwicklung vorausgehen, gibt er eine Richtungsvorhersage für die Marktbewegung.
Das Oszillatorsignal wird mit dem RMS (Root Mean Squared) multipliziert, um die Verteilung näher an die Gaußsche Verteilung heranzuführen. Während die traditionellen RSI-Indikatoren oft lange Zeit in überkauften oder überverkauften Bereichen verharren, wird dies durch die RMS-Bewertung des Signals vermieden. Um dieses Verhalten zu unterstützen, wird ein Hochpassfilter angewendet, um höhere Perioden herauszufiltern, die nicht berücksichtigt werden sollten.
Der Mittelwert des Indikatorsignals ist die Nulllinie, da der Mittelwert gleich Null ist. Dadurch wird eine Schieflage der zugrunde liegenden Indikatorverteilung vermieden.
Nach den Signalverarbeitungsschritten wird der Indikatorwert mit einer fortschrittlichen Technik geglättet, die das Signal mit minimaler Verzögerung glättet.
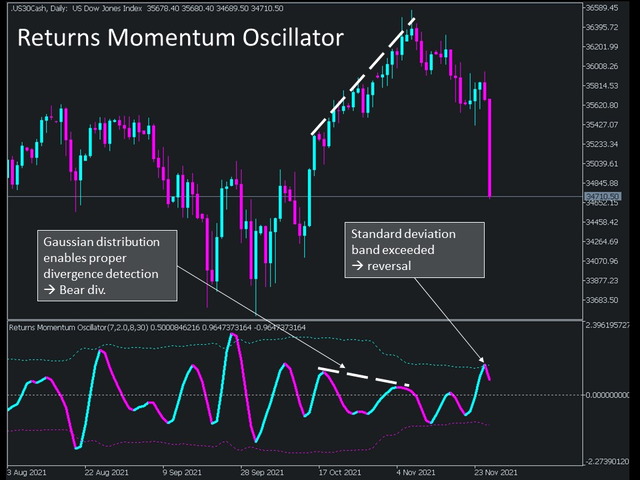
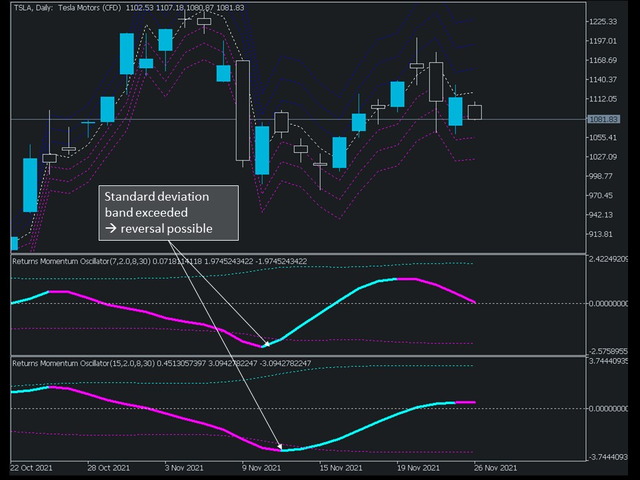
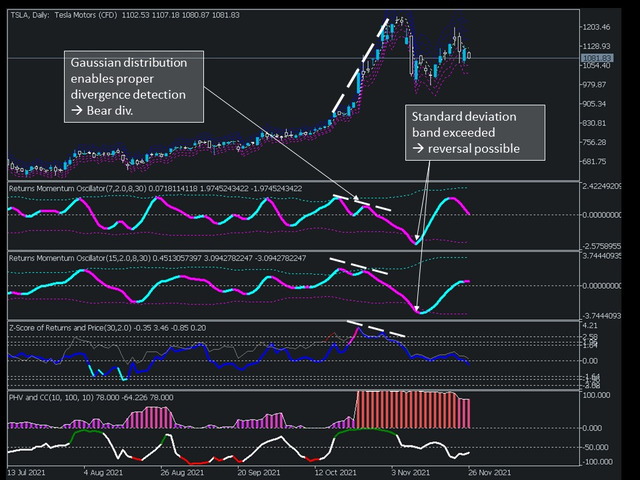
Ein Standardabweichungsband wird angewendet, um die Signifikanzniveaus des Indikators anzuzeigen, die oft als Umkehrpunkt dienen. Es ist vergleichbar mit den überkauften und überverkauften Niveaus des RSI-Indikators, jedoch mit statistischer Signifikanz.
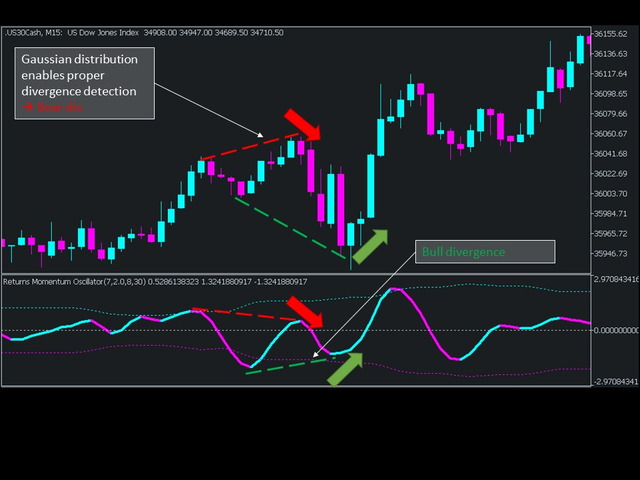
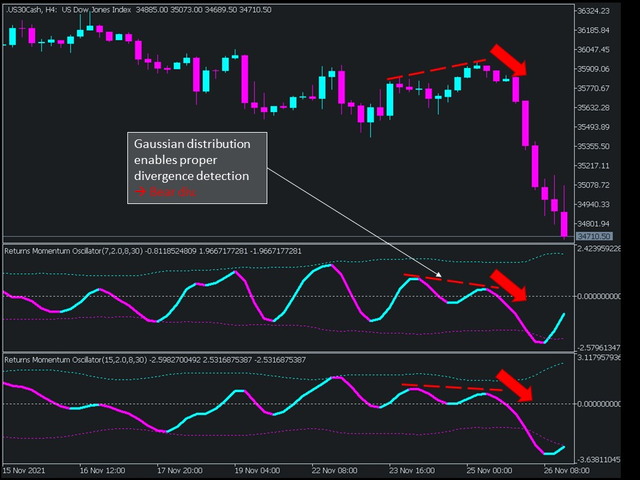
Da der Indikator aufgrund der Signalverarbeitung nahezu normalverteilt ist, kann er auch als Divergenzindikator verwendet werden.
Die Eingabeeinstellungen:
Stichprobengröße: Standard 7, Länge der Perioden zurück zur berechneten Volatilität
Smoothing Sample Size: Standardwert 8, Länge der Perioden zurück zur Glättung des Signals mit minimaler Verzögerung
Multiplikator: Standard 2.00 Standardabweichungen, Multiplikator in Form der Standardabweichung, um Ausreißer/mögliche Umkehrungen anzuzeigen (Farbänderung der Linie)
Stichprobengröße Bänder: Standardwert 30, Länge der Perioden zurück zu den berechneten SD-Bändern des RMO, um Ausreißer zu finden
Hochpassfilter Stichprobengröße: Standardwert 50, Stichprobengröße des Hochpassfilters zur Reduzierung des tieffrequenten Rauschens des Signals
Bemerkung: Der Indikator dient nur der statistischen Analyse und der Darstellung von Wahrscheinlichkeiten und sollte nicht als Finanzberatung verstanden werden.