• Información general
  • Comentarios
  • Discusión

Returns Momentum Oscillator RMO

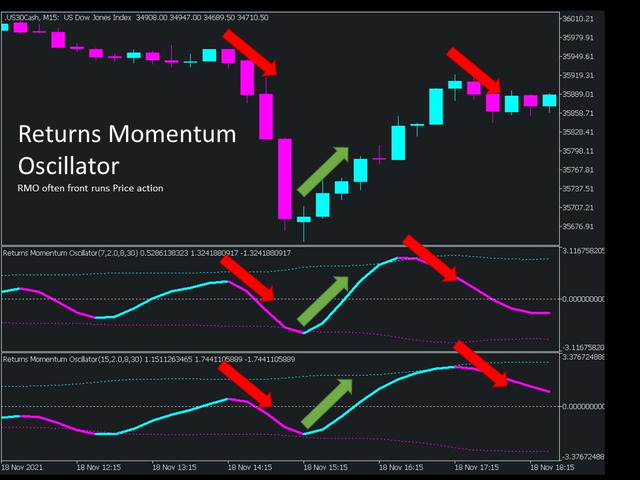
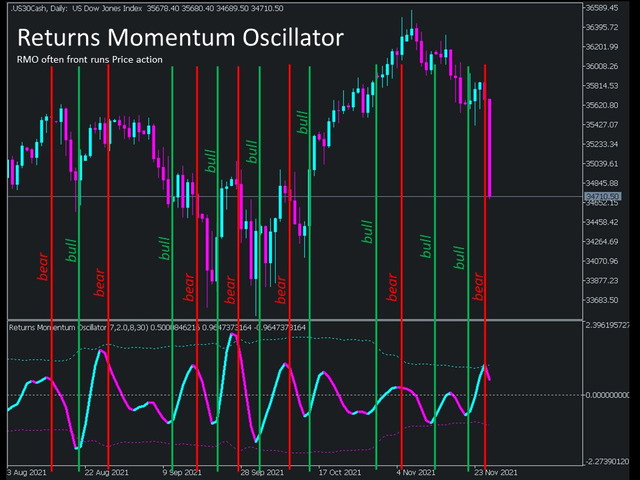
The Returns Momentum Oscillator (RMO) shows the difference of exponentially weighted volatility. It is used to find market tops and bottoms. Volatility comes in waves, and as the Returns often front run price action it gives directional prediction of market movement.


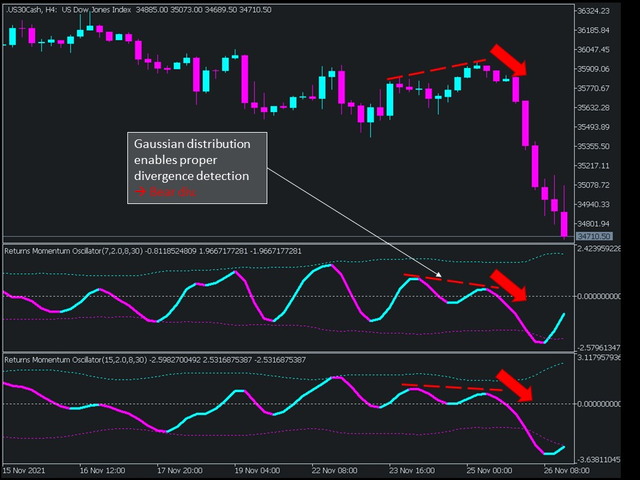
The Oscillator signal is RMSed (root mean squared) to make the distribution closer to Gaussian distribution. While the traditional RSI indicators are often stuck in overbought or oversold areas for a long time, RMSing of the signal gets rid of this. To support this behaviour a high pass filter is applied to filter out higher periods, which should not be considered.

The mean of the indicator signal is the zero line, because it is zero meaned. This avoids skewness of the underlaying indicator distribution.


After the signal processing steps, the indicator value is smoothed with an advanced technic, which smooths the signal with minimal lag.


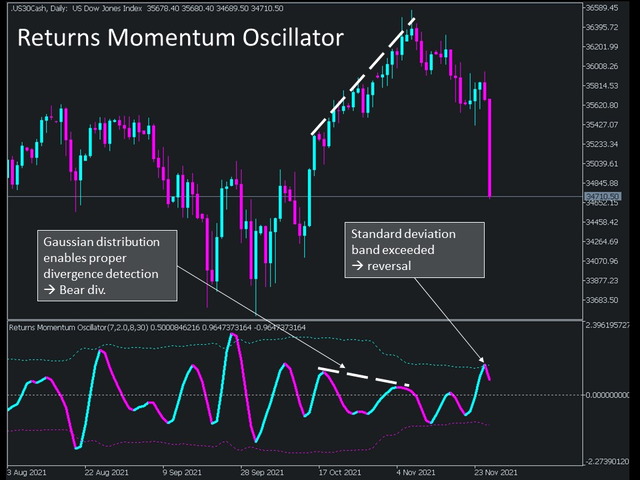
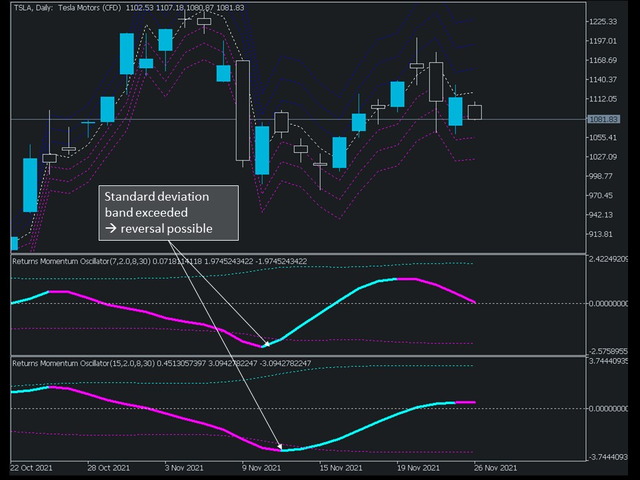
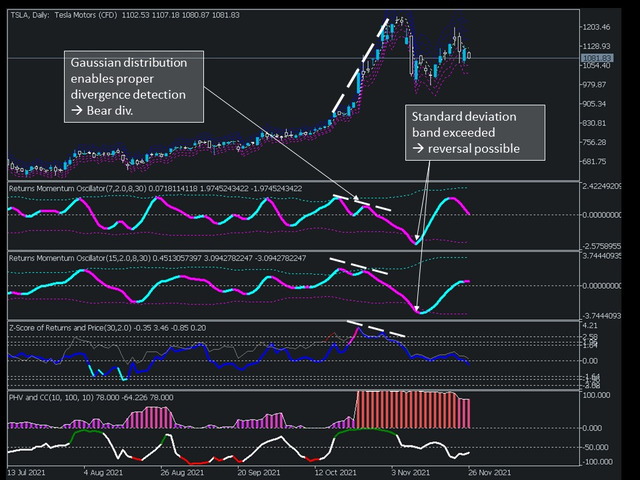
A standard deviation band is applied to show significance levels of the indicator, which often act as reversal point. It is like the overbought and oversold levels of RSI indicator, but with statistical significance.


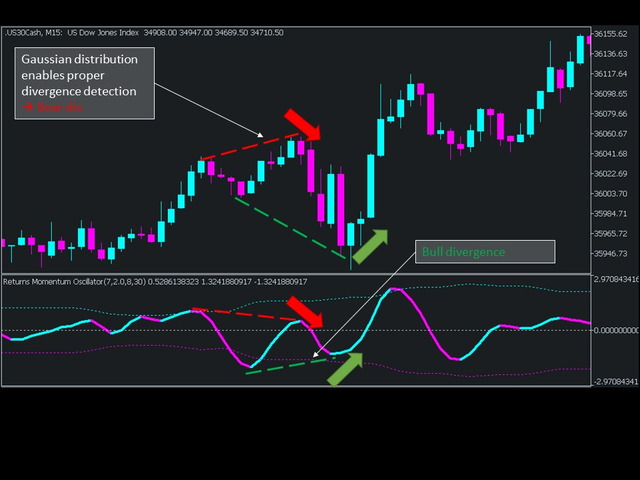
As the indicator is nearly normal distributed, due to the signal processing, it can also be used as divergence indicator.


The Input Settings:

Sample Size: Default 7, length of periods back to calculated Volatility

Smoothing Sample Size: default 8, length of periods back to smooth signal with minimal lag

Multiplier: default 2.00 Standard Deviations, Multiplier in terms of standard deviation, to show outliers/possible reversals (line colour change)

Sample Size Bands: Default 30, length of periods back to calculated SD-Bands of RMO to find outliers

High-pass Filter Sample Size: default 50, sample size of high-pass filter to reduce low-frequency noise of the signal


Remark: Indicator is provided for statistical analysis and showing probabilities only and should not be construed as financial advice.


Productos recomendados
Disclaimer : Keep in mind that seasonal patterns are not always reliable. Therefore, thoughtful risk management is crucial to minimize losses.  Seasonal patterns in the financial world are like a well-guarded secret that successful investors use to their advantage. These patterns are recurring price movements that occur during specific periods or around special events. Additionally, there are also intraday patterns that repeat. For example, Uncle Ted from Forex Family suggests examining previou
Markets Heat indicator can help you determine correct course of action at current market situation, by calculating market's "heat level". What is market's "heat level"? Well, it's my own way of simplifying complex market conditions to ease decision-making process. How does it work? Most of time market is moving in some narrow range and can't "decide" where to go -> flat market -> cold market. Other times, price goes Up or Down -> making trend movements -> heating the market. More powerful trends
¡Presentamos RSIScalperPro - un revolucionario indicador basado en RSI para MetaTrader 5, diseñado específicamente para el scalping en gráficos de un minuto! Con RSIScalperPro, tendrás una herramienta poderosa para señales precisas de entrada y salida, lo que mejorará tu eficiencia de trading. RSIScalperPro utiliza dos diferentes indicadores de RSI que proporcionan señales claras para los niveles de sobrecompra y sobreventa. Puedes ajustar los periodos de tiempo y los valores límite de los dos
The chart pattern is automatically drawn. It also automatically tells you the price at which you are most likely to buy or sell according to the pattern. Therefore, there is no need to memorize patterns or draw lines by yourself. * The "WhaleFinder" includes four indicators ("DrawTurningPoint", "DrawHurdle", "DrawChartPattern", "DrawFibonacci").  so, Please be careful not to purchase more than one copy (duplicates). We are live-streaming the actual operation of the system. Please check for yo
Si tienes alguna pregunta, no dudes en enviarme un mensaje privado: https://www.mql5.com/en/users/dennisfinimento Visión general     Rango y Breakout Estrategia que utiliza backevolving mercados.     Optimizada y respaldada por inteligencia artificial para reconocer la dirección en el mercado.     Se ha probado durante más de 10 años utilizando datos reales de tick y ha mostrado un rendimiento estable.     El asesor puede ser utilizado en múltiples tipos de cuenta, incluyendo micro, estándar
Three Candles Pattern
Edson Cavalca Junior
5 (1)
The patterns of 3 (three) Candles: Three White Soldiers; Three Black Crows; These are reversal patterns widely used by traders, as they have a high probability of showing the inversion of the current market movement. For example, if in a bullish trend there are three black crows, there is a high probability of reversing the current bullish movement. The Three White Soldiers have the following characteristics: There are 3 consecutive candles with a good body, that is, the difference between th
Titan Backup
Elies Noah Siebenpfeiffer
Introducing Titan Backup : Are you ready to enhance your trading game with an automated system built for precision and flexibility? Meet Titan Backup , your expert trading assistant designed to capture high-profit breakouts by identifying accumulation zones . This powerful Expert Advisor (EA) excels in high-volatility markets such as the Nasdaq 100 and Crypto 10 , offering both hands-free automation and manual assistance to support your trading strategies. How Titan Backup Works: Titan Backup ru
Explosive Breakout Hunter es un Asesor Experto (EA) diseñado para maximizar las ganancias capturando fuertes rompimientos en el mercado. Aunque su tasa de éxito es del 50% y realiza solo unas pocas operaciones al mes, este EA prioriza la calidad sobre la cantidad. Es paciente al esperar oportunidades, acumulando ganancias significativas de manera constante. Puede revisar los resultados de las pruebas retrospectivas en capturas de pantalla para estimar el potencial de ganancias. Además, le invita
Jumping and Dumping Candles Detector Also known as Pumping and Dumping Candles Detector. Multi - timeframe. Scans historical candles. For MT5 program. With this amazing indicator, adopt your own strategy. Note: Share your strategy with us and we automate it. Check out my 98% win rate signal : https://www.mql5.com/en/signals/2278767?source=Site +Profile (Expired)
The PriceActionOracle indicator greatly simplifies your trading decision-making process by providing accurate signals about market reversals. It is based on a built-in algorithm that not only recognizes possible reversals, but also confirms them at support and resistance levels. This indicator embodies the concept of market cyclicality in a form of technical analysis. PriceActionOracle tracks the market trend with a high degree of reliability, ignoring short-term fluctuations and noise around
【Super Scanner】Indicator Introduction : The color of the Super Scanner which is green and climbing up means that the price trend is going up.The color of the Super Scanner is red and going down means that the price trend is going down. It is very simple to use it to judge the market trend! What's even better is that the open parameters of the indicators allow investors to adjust. You can adjust【Super Scanner】according to your needs. Adjust it faster to be closer to short-term market fluctuatio
Expert Market Edge is scalping, trending, reversal indicator, with alerts . You can use it all and fit with your strategy whatever it fits you. My recommendation is to combine with my Colored RSI , and when 2 signals are matched, and pointing same direction (for example buy on this indicator, and green on RSI, you can take a long position, stop loss should be last local low, if you want to be more conservative, add ATR. ) you can take position. If you using moving averages, that's even better i
Si está buscando una perspectiva pragmática para sus futuros esfuerzos comerciales, permítame presentarle EverGrowth. ¿Está cautivado por la idea de participar en actividades comerciales con un EA profesional completo, que comprende una extensa base de código de aproximadamente 6800 líneas? EverGrowth cuenta con una multitud de funciones e indicadores, priorizando la autenticidad al replicar fielmente los resultados de las pruebas en condiciones reales del mercado. Aprovecha las funcionalidades
Gold Crazy EA   is an Expert Advisor designed specifically for trading Gold H1/ EU M15. It use some indicators to find the good Entry. And you can set SL or you can DCA if you want. It can be an Scalping or an Grid/ Martingale depend yours setting. This EA can Auto lot by Balance, set risk per trade. You also can set TP/ SL for earch trade or for basket of trade. - RSI_PERIOD - if = -1, then the default strategy works, if >0, then the RSI strategy works - MAX_ORDERS - to trade with only 1 order,
Ignition
Dansie Software Limited
Strategy Overview The Ignition EA tries to take advantage of sudden momentum when the Ignition pattern is detected. The final bar in the ignition pattern has a small opening wick, a very little or no closing wick, is large in comparison to recent bars and must start from the lower end of the current range (for a bullish ignition) Quick Testing Use Symbol EURUSD, Timeframe M2, and remove the GBPUSD symbol from the "Symbols" input (stratergy 1 and stratergy 2) Settings The below settings appe
The   ICT Immediate Rebalance Toolkit   is a comprehensive suite of tools crafted to aid traders in pinpointing crucial trading zones and patterns within the market. The ICT Immediate Rebalance, although frequently overlooked, emerges as one of ICT's most influential concepts, particularly when considered within a specific context. The toolkit integrates commonly used price action tools to be utilized in conjunction with the Immediate Rebalance patterns, enriching the capacity to discern conte
Alert Up Down MT5
William Oswaldo Mayorga Urduy
ALERT  UP - DOWN PARA METATRADER 5 Este indicador genera una alerta cuando el precio sale de la zona que se encuentra entre las líneas UP y DOWN. Se puede generar alertas de varios tipos como son: > Sonido > Caja de mensaje > Mensaje en la caja de expertos > Correo (previamente configurado) > Notificaciones PUSH (previamente configurado) Las líneas se deben configurar desde las propiedades del indicador y no desde las propiedades líneas, ya que si se hace desde las propiedades de las líneas , s
Révolutionnez votre trading avec PowerPro Volatility : une précision automatisée à votre service Êtes-vous prêt à transformer votre approche du trading d’indices synthétiques ? Présentation de PowerPro Volatility, la solution ultime pour ceux qui cherchent à maximiser leurs gains tout en minimisant les efforts. Grâce à   Automatisation avancée et technologie de pointe, ce robot de trading est conçu pour offrir des performances exceptionnelles sans aucune intervention humaine. Découvrez les avan
Reverse side scalper is the manual trading system, that works on choppy(anti-trend) market. As a rule markets are on 80% choppy and only 20% is trend phase. System is based on custom step Moving and RSI and reverse pattern. System defines up movement, down movement, trend / choppy phases. Indicator plots Buy signal arrow when current direction is down and phase is trend, Sell signal arrow is plotted when currently is up movement and phase is trend. As a rule it allows to "catch" local maximum/mi
TPO Profile MT5
Kyra Nickaline Watson-gordon
Definition : TPO is a Time Price Opportunity. Instead of using bars or candles with an Open, High, Low, and Close price, each "bar" in a Market Profile is represented by horizontal bars against the price It is called Market Profile terminology. In other words time-price-opportunity (TPO) profiles are histograms of how much time was spent at each price within the span of the profile. By using a TPO chart, you are able to analyze the amount of trading activity, based on time, for each price level
This Indicator adding power to traditional zigzag indicator. With High-Low numbers in vision it will be easier to estimate change of trend by knowing the depth of each wave. Information including points, pips, percentage%, and #bars can be displayed based on configuration. All information is real-time update. This indicator is especially useful in sideway market to buy low sell high.
The indicator identifies critical support and resistance areas. It also can give alerts and notifications to your mobile. A lot of customization options are available: You can have different timeframe on your current chart. For example, if your current chart timeframe is H1, you can assign the indicator timeframe to M15.The indicator identifies critical support and resistance areas. It also can give alerts and notifications to your mobile. A lot of customizations are available. There is an optio
- simple Price Action Indicator - a  3 Candle Pattern (1. Direction-Candle / 2. the TRAP / 3. Trigger-Candle)    BUT every Signal needs ATTENTION to check for a clean Range - NON Lagging ! the Alert shows instantly whats happening - recommended SETUP is: - there is a VOLUME-Filter (in points for the   1. candle ) to avoid alerts with tiny Candles during a NON-VOLUME-Time - 10% off the Boobietrap-Candle as the ALERT-Level --> can easily be adjusted - user defined - recommended Timeframe: M30 (we
O Alexxander Autotrader é seu robô especialista em trade em minidólar WDO na bolsa brasileira B3. Com estratégia única, o robô já está configurado para operar minidólar na abertura do pregão, operando em fechamentos de gaps principalmente. O robô também pode ser otimizado para operar além do horário de abertura. Alem disso, o robô pode ser configurado com trailling stop, horários de trades e tipo de stop, se fixo ou dinâmico. OBS: alterar o parâmetro BR1 para BR.
The Beta index, also known as the Beta indicator, is one of the key reference indicators for hedging institutions. It allows you to measure the relative risk of individual assets, such as currencies and commodities, in comparison to market portfolios, cross-currency pairs, the U.S. dollar index, and stock indices. By understanding how your assets perform in relation to market benchmarks, you will have a clearer understanding of your investment risk. Key Features: Accurate Risk Assessment: The Be
Top level indicator of exact buy and sell prices. Suitable for all symbols, you just have to choose a convenient trading activity. The indicator shows price rebound levels with the targets for entering and exiting a position. The commentary at each level states: what to do at the level (BUY/SELL); entry price; target exit price. In the parameters you need to select your trading activity: Long term investor Medium term investor Medium-term investor active Short term investor Short-term investor a
- This is an implementation of OCC ==> open close cross - This indicator applies twelve different averaging methods to open and close prices separately to signal the trend switching. - All MA methods are set as input as well as period and different offsets applied to linear regression and ALMA averaging. - Buffers 16 and 17 can be used in EAs to detect trend direction. - You can message in private chat for further changes you need.
Best swing
Winsou Cedric Anicet Kpanou
-- BEST SWING  -- L'indicateur BEST SWING est un indicateur technique personnalisé, un excellent outil pour négocier les cassures en fonction des niveaux de support et de résistance horizontaux. L'indicateur BEST SWING utilise une formule complexe en analysant des données de prix autrement incongrues sur les cours de clôture de chaque période, ainsi que les hauts et les bas du prix, afin de donner un aperçu de la force ou de la faiblesse de la tendance du marché et de sa probabilité
Stormer RSI 2
Ricardo Rodrigues Lucca
This strategy was learned from Stormer to be used on B3. Basically, 15 minutes before closing the market, it will check RSI and decided if it will open an position. This strategy do not define a stop loss. If the take profit reach the entry price it will close at market the position. The same happens if the maximal number of days is reached. It is created to brazilian people, so all configuration are in portuguese. Sorry Activations allowed have been set to 50.
Tucan PullBack
Arlos Elias Rivas Romero
Indicador tipo estrategia (Pullback) para todos los simbolos y periodicidades, preferiblemente desde M30.  La estrategia se basa en criterios para los indicadores  Rsi, Atr y Force. La banda del canal corresponde al valor del indicador Atr. Los parametros (modificables) por defecto son : a) Precio = Median price b) Metodo de promedio = Simple c) Periodo    promedio =   3 d) Coeficiente del indicador Atr = 1.0 BUY when there is a Green Arrow. StopLoss below the bottom line of the channel.  SELL
Los compradores de este producto también adquieren
Golden Trend Indicator MT5
Noha Mohamed Fathy Younes Badr
4.86 (14)
Golden Trend indicator  is The best indicator for predicting trend movement this indicator never lags and never repaints and never back paints    and give  arrow buy and sell    before the candle appear  and it will help you and  will make your trading decisions clearer its work on all currencies and  gold and crypto and all time frame This unique  indicator uses very secret algorithms to catch the  trends, so you can trade using this indicator and see the trend clear on charts  manual guide and
TPSpro RFI Levels MT5
Roman Podpora
4.53 (19)
INSTRUCCIONES       RUSO   -   ING        Se   recomienda utilizar con un indicador.       -       TPSpro   TENDENCIA PRO -   Versión MT5 Un elemento clave en el trading son las zonas o niveles desde los que se toman las decisiones de compra o venta de un instrumento de trading. A pesar de los intentos de los principales actores de ocultar su presencia en el mercado, inevitablemente dejan rastros. Nuestra tarea era aprender a identificar estos rastros e interpretarlos correctamente. Funciones p
TPSproTREND PrO MT5
Roman Podpora
4.47 (17)
TPSpro TREND PRO  - is a trend indicator that automatically analyzes the market and provides information about the trend and each of its changes, as well as giving signals for entering trades without redrawing! The indicator uses each candle, analyzing them separately. referring to different impulses - up or down impulse. Exact entry points into transactions for currencies, crypto, metals, stocks, indices!  ИНСТРУКЦИЯ RUS         INSTRUCTIONS  ENG       R ecommended to use with an indicator   -
Quantum TrendPulse
Bogdan Ion Puscasu
5 (12)
Presentamos   Quantum TrendPulse   , la herramienta de trading definitiva que combina el poder de   SuperTrend   ,   RSI   y   Stochastic   en un indicador integral para maximizar su potencial de trading. Diseñado para traders que buscan precisión y eficiencia, este indicador le ayuda a identificar tendencias del mercado, cambios de impulso y puntos de entrada y salida óptimos con confianza. Características principales: Integración con SuperTrend:   siga fácilmente la tendencia predominante del
RelicusRoad Pro MT5
Relicus LLC
4.78 (18)
Ahora $ 147 (aumentando a $ 499 después de algunas actualizaciones) - Cuentas ilimitadas (PC o Mac) Manual de usuario de RelicusRoad + Videos de capacitación + Acceso al grupo privado de Discord + Estado VIP UNA NUEVA MANERA DE VER EL MERCADO RelicusRoad es el indicador comercial más poderoso del mundo para divisas, futuros, criptomonedas, acciones e índices, y brinda a los comerciantes toda la información y las herramientas que necesitan para mantenerse rentables. Brindamos análisis técnico
Bill Williams Advanced
Siarhei Vashchylka
5 (10)
Bill Williams Advanced is designed for automatic chart analysis using Bill Williams' "Profitunity" system. The indicator analyzes four timeframes at once. Manual (Be sure to read before purchasing) Advantages 1. Automatically analyzes the chart using the "Profitunity" system of Bill Williams. The found signals are placed in a table in the corner of the screen. 2. Equipped with a trend filter based on the Alligator indicator. Most of the system signals are recommended to be used only according t
Introduciendo       Quantum Breakout PRO   , el innovador indicador MQL5 que está transformando la forma en que comercia con Breakout Zones. Desarrollado por un equipo de comerciantes experimentados con experiencia comercial de más de 13 años,       Desglose cuántico PRO       está diseñado para impulsar su viaje comercial a nuevas alturas con su innovadora y dinámica estrategia de zona de ruptura. El indicador de ruptura cuántica le dará flechas de señal en las zonas de ruptura con 5 zonas ob
Este es un genial indicador para MT5 que ofrece señales precisas para entrar en una transacción sin redibujar. Se puede aplicar a cualquier activo financiero: fórex, criptomonedas, metales, acciones, índices. Nos dará valoraciones bastante precisas y nos dirá cuándo es mejor abrir y cerra una transacción. Eche un vistazo  al vídeo  (6:22), ¡contiene un ejemplo de procesamiento de una sola señal que ha amortizado el indicador! La mayoría de los tráders mejoran sus resultados comerciales durante l
Este es posiblemente el indicador de reconocimiento automático de formación de precios más completo que puede encontrar para la plataforma MetaTrader. Detecta 19 patrones diferentes, toma las proyecciones de Fibonacci tan en serio como usted, muestra la zona de reversión potencial (PRZ) y encuentra niveles adecuados de stop-loss y take-profit. [ Guía de instalación | Guía de actualización | Solución de problemas | FAQ | Todos los productos ] Detecta 19 formaciones de precios armónicos diferen
CONTACT US  after purchase to get the Indicator Manual. Try Now—Limited 50% Discount for First 10 Buyers! Download the  Metatrader 4 Version Due to regulatory restrictions, our service is unavailable in certain countries such as India, Pakistan, and Bangladesh. William Delbert Gann (W.D. Gann) was an exceptional market analyst, whose trading technique was based on a complex blend of mathematics, geometry, astrology, and ancient mathematics which proved to be extremely accurate. A Note from t
Indicador único que implementa un enfoque profesional y cuantitativo para el comercio de reversión a la media. Aprovecha el hecho de que el precio se desvía y vuelve a la media de manera predecible y medible, lo que permite reglas claras de entrada y salida que superan ampliamente las estrategias comerciales no cuantitativas. [ Installation Guide | Update Guide | Troubleshooting | FAQ | All Products ] Señales comerciales claras Sorprendentemente fácil de operar Colores y tamaños personalizables
Blahtech Supply Demand MT5
Blahtech Limited
4.54 (13)
Was: $299  Now: $149  Supply Demand uses previous price action to identify potential imbalances between buyers and sellers. The key is to identify the better odds zones, not just the untouched ones. Blahtech Supply Demand indicator delivers functionality previously unavailable on any trading platform. This 4-in-1 indicator not only highlights the higher probability zones using a multi-criteria strength engine, but also combines it with multi-timeframe trend analysis, previously confirmed swings
Elliot Waves Analyzer Pro
Viktor Weidenthal
2.67 (3)
Elliot Waves Analyzer Pro calculates Elliot Waves to Help Identify Trend direction and Entry Levels. Mainly for Swing Trading Strategies. Usually one would open a Position in trend direction for Wave 3 or a Correction for Wave C . This Indicator draws Target Levels for the current and next wave. Most important Rules for Elliot Wave Analysis are verified by the Indicator.  The Pro version analyzes Multiple Timeframes and shows the Subwaves and Target-Levels.   For an Overview  " Elliot Waves Anal
Was: $249  Now: $149   Market Profile defines a number of day types that can help the trader to determine market behaviour. A key feature is the Value Area, representing the range of price action where 70% of trading took place. Understanding the Value Area can give traders valuable insight into market direction and establish the higher odds trade. It is an excellent addition to any system you may be using. Inspired by Jim Dalton’s book “Mind Over Markets”, this indicator is designed to suit the
Volume Horizon is a horizontal volume indicator that allows you to observe the density of market participants' volumes across various price and time intervals. Volume histograms can be constructed based on ascending or descending market waves, as well as individual bars. This tool enables more precise determination of entry or exit points, relying on levels of maximum volumes or volume-weighted average prices (VWAP). What makes Volume Horizon unique? 1. Segmentation into ascending and descendi
Quantum Trend Sniper
Bogdan Ion Puscasu
4.73 (51)
Introduciendo       Indicador Quantum Trend Sniper   , el innovador indicador MQL5 que está transformando la forma en que identificas y negocias los cambios de tendencia. Desarrollado por un equipo de comerciantes experimentados con experiencia comercial de más de 13 años,       Indicador de francotirador de tendencia cuántica       está diseñado para impulsar su viaje comercial a nuevas alturas con su forma innovadora de identificar cambios de tendencia con una precisión extremadamente alta. *
TPA True Price Action indicator reveals the true price action of the market makers through 100% non-repainting signals strictly at the close of a candle! TPA shows entries and re-entries, every time the bulls are definitely stronger than the bears and vice versa. Not to confuse with red/green candles. The shift of power gets confirmed at the earliest stage and is ONE exit strategy of several. There are available now two free parts of the TPA User Guide for our customers. The first "The Basics"
AT Forex Indicator MT5
Marzena Maria Szmit
5 (5)
The AT Forex Indicator MT5 is a sophisticated trading tool designed to provide traders with a comprehensive analysis of multiple currency pairs. This powerful indicator simplifies the complex nature of the forex market, making it accessible for both novice and experienced traders. AT Forex Indicator uses advanced algorithms to detect trends, patterns and is an essential tool for traders aiming to enhance their forex trading performance. With its robust features, ease of use, and reliable signal
Trend Forecaster
Alexey Minkov
5 (6)
!SPECIAL SALE!  The Trend Forecaster indicator utilizes a unique proprietary algorithm to determine entry points for a breakout trading strategy. The indicator identifies price clusters, analyzes price movement near levels, and provides a signal when the price breaks through a level. The Trend Forecaster indicator is suitable for all financial assets, including currencies (Forex), metals, stocks, indices, and cryptocurrencies. You can also adjust the indicator to work on any time frames, althoug
Berma Bands
Muhammad Elbermawi
5 (3)
El indicador de bandas de Berma (BB) es una herramienta valiosa para los operadores que buscan identificar y aprovechar las tendencias del mercado. Al analizar la relación entre el precio y las bandas de Berma, los operadores pueden discernir si un mercado se encuentra en una fase de tendencia o de rango. Visita el [ Blog de Berma Home ] para saber más. Las bandas de Berma se componen de tres líneas distintas: la banda de Berma superior, la banda de Berma media y la banda de Berma inferior. Esta
TrendMaestro5
Stefano Frisetti
note: this indicator is for METATRADER4, if you want the version for METATRADER5 this is the link:  https://www.mql5.com/it/market/product/108106 TRENDMAESTRO ver 2.4 TRENDMAESTRO recognizes a new TREND in the bud, he never makes mistakes. The certainty of identifying a new TREND is priceless. DESCRIPTION TRENDMAESTRO identifies a new TREND in the bud, this indicator examines the volatility, volumes and momentum to identify the moment in which there is an explosion of one or more of these data a
The Boom And Crash Spike Entry This Indicator is Also Developed To milk the     BOOM and CRASH indices .   Free EA/Robot Also available based on the indicator DM after purchase of the indicator to get the EA/Robot for free and it's results. You get the EA only if you buy the indicator not rent it. It works On all Boom and Crash pairs (boom 300, 500, 1000 & Crash 300, 500, 1000) I would Highly recommend that you use this indicator to Catch spikes on Boom and Crash for higher win rate and accuracy
Mega Spikes Max
Niccyril Chirindo
5 (1)
Are you tired of missing out on the biggest opportunities in Boom and Crash trading? Mega Spikes Max is your ultimate tool for dominating the markets, giving you the precision and confidence you need to succeed. Why Choose Mega Spikes Max? Stay Ahead with Real-Time Alerts Never miss a profitable trade again. Get instant notifications directly to your mobile or desktop when a spike is imminent, even if you're away from your screen. Accurate Spike Detection Engineered for pinpoint accuracy, Mega
MetaForecast M5
Vahidreza Heidar Gholami
5 (2)
MetaForecast predice y visualiza el futuro de cualquier mercado basándose en las armonías de los datos de precios. Aunque el mercado no siempre es predecible, si existe un patrón en el precio, MetaForecast puede predecir el futuro con la mayor precisión posible. En comparación con otros productos similares, MetaForecast puede generar resultados más precisos al analizar las tendencias del mercado. Parámetros de entrada Past size (Tamaño del pasado) Especifica el número de barras que MetaForecast
Fxaccurate Trend Trading is a method that focuses on identifying and capitalizing on market trends in the foreign exchange (Forex) market. This strategy is grounded in the principle that once a trend is established, it tends to persist, allowing traders to enter positions that align with the market's prevailing direction. Fxaccurate Trend Trading relies on various tools, indicators, and methodologies to spot, confirm, and trade in the direction of a trend, whether it’s upward (bullish) or downwa
PZ Swing Trading MT5
PZ TRADING SLU
5 (5)
Swing Trading es el primer indicador diseñado para detectar oscilaciones en la dirección de la tendencia y posibles oscilaciones de reversión. Utiliza el enfoque de intercambio de línea de base, ampliamente descrito en la literatura comercial. El indicador estudia varios vectores de precios y tiempos para rastrear la dirección de la tendencia agregada y detecta situaciones en las que el mercado está sobrevendido o sobrecomprado y listo para corregir. [ Guía de instalación | Guía de actualización
El indicador muestra la dirección de la tendencia de varios plazos en una ventana. Si la tendencia de varios plazos coincide, se dibujan flechas. También puede cambiar al histograma, que indica la tendencia en el plazo actual. El indicador dibuja puntos de entrada y puntos de salida aproximados en el gráfico. Advertencia: dado que el indicador es multi timeframe, cuando se utiliza en el probador de estrategias, las cotizaciones para todos los timeframes necesarios deben descargarse con antelac
AriBot
Arman Belassarov
AriMax   – AI-Powered Trading Robot AriMax is a cutting-edge AI-powered trading robot designed to help traders maximize profits while minimizing risk. Utilizing advanced machine learning algorithms and real-time market analysis, AriMax identifies high-probability trade opportunities with precision and speed. Key Features:     AI-Driven Market Analysis   – Analyzes market trends and patterns to make data-driven trading decisions.     Automated Execution   – Places trades seamlessly with optimiz
Wave Anatomy MT5
Trade The Volume Waves Single Member P.C.
Wave Anatomy Visit:  http://www.trafethevolumewaves.com  for more information Construct your own 5 Waves and analyze the price movements stages: Easy Movement Hard time to move Fast move This indicator is based on Wyckoff’s, David’s Weis and my Speed Index Theory. This indicator will you help analyze what is happening in 5 Price Waves that you can construct yourself. This tool is designed for scalpers and swing traders and will help them to analyze any wave on any timeframe at the same time. Fur
Volume by Price MT5
Brian Collard
3.25 (4)
The Volume by Price Indicator for MetaTrader 5 features Volume Profile, Footprint and Market Profile TPO (Time Price Opportunity). Volume and TPO histogram bar and line charts. Volume Footprint charts. TPO letter and block marker collapsed and split structure charts. Static, dynamic and flexible range segmentation and compositing methods with relative and absolute visualizations. Session hours filtering and segment concatenation with Market Watch and custom user specifications. Graphical layeri
Otros productos de este autor
Percentile of Historical Volatility and Correlation Coefficient shows if the asset is cheap or expensive based on the volatility. It is used to determine a good entry point. It has two indicators built in: Historical Volatility is ranked percentile wise and its correlation to price action which gives an indication of the direction of a possible future move. Together the both indicators can give good entries and direction.   Historical Volatility is a statistical measure of the dispersion of retu
This z-score indicator shows the correct z-score of an asset, as it uses the normalized price data for calculation, which is the only correct way. Z-score is only applicable for normal distributed data, therefore not the actual price is considered, but the normalised returns, which were assumed to follow a normal distribution. Returns are mean reverting and assumed to follow a normal distribution, therefore z-score calculation of returns is more reliable than z-score on price, as price is NOT m
The RSI2.0 indicator uses normalized price data and signal processing steps to get a normal distributed oscillator with no skew (mean is zero). Therefore, it can give much better reads than the traditional RSI.   Areas/Levels of reversal: Overbought or oversold levels from traditional RSI have no statistical significance, therefore the standard deviation bands are implemented here, which can be used in similar way as possible reversal points.   Divergence: As the indicator is nearly normal dist
Drift
Florian Nuebling
This Oscillator describes the drift of an asset, as part of the geometric Brownian Motion (GBM). As a data basis the mean reverting log returns of the asset price is considered. It gives the percentile of drift directional. For instance, a value of 0.05 means a drift of 5%, based on the selected sample size. If the value is positive, drift to higher asset values is determined.  This indicator should be used in confluence with other indicators based on volatility, probability and statistics. Li
FREE
The indicator ‘Probability Range Bands’ gives a prediction of the amount, how much the asset is moving from its current price. The range bands give probabilities, that the candle close will not exceed this certain price level. It is also called the expected move for the current candle close.   This Indicator is based on statistical methods, probabilities and volatility. Asset price is assumed to follow a log-normal distribution. Therefore, log returns are used in this indicator to determine the
Bollinger Bands based on Returns   This indicator characterizes the price and volatility by providing a channel/band of standard deviations like the Bollinger Bands. In contrary to standard Bollinger Bands which uses price directly, this indicator uses returns due to normalization.   The standard Bollinger Bands based on price directly, were one of the first quant or statistical methods for retail traders available. The issue with these bands, standard deviations can only be calculated, if the u
Filtro:
No hay comentarios
Respuesta al comentario