• Übersicht
  • Bewertungen
  • Diskussion
  • Neue Funktionen

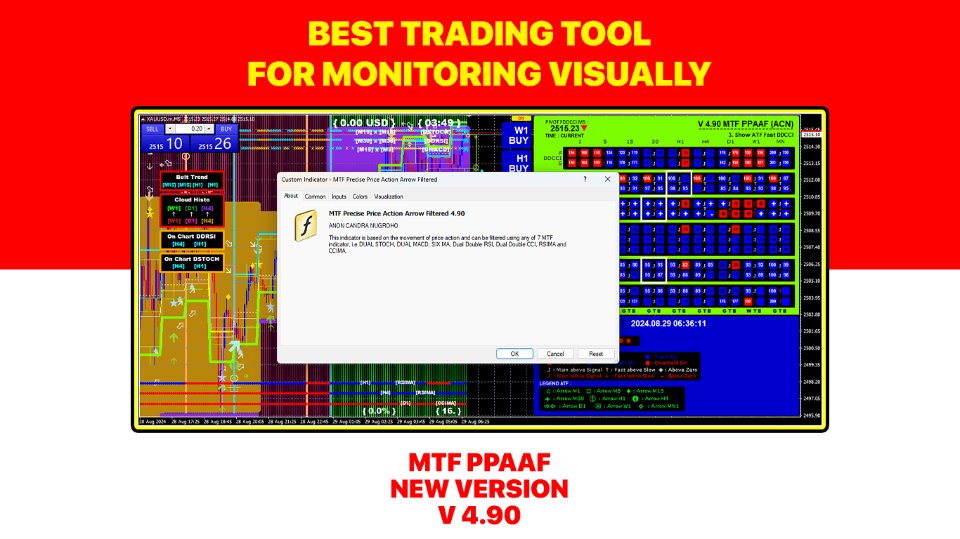
MTF Precise Price Action Arrow Filtered

Wenn Sie oft Trades verlieren, weil Sie nur einen Indikator verwenden, dann probieren Sie dieses Handelstool aus. Dieses Handelstool verwendet mehr als einen Indikator. Ich beobachte oft Händler, die nur den RSI-Indikator verwenden. Sehr oft ist der Markt überverkauft, aber immer noch im Minus, oder der Markt ist überkauft, aber immer noch im Plus. Aus diesem Grund müssen Sie mehr als einen Indikator verwenden. Wir stellen die neue Version V 3.40 MTF PPAAF vor: Multi Time Frame Precise Price Action Arrow Filtered. Dieses Handelsinstrument verwendet verschiedene Indikatoren, um die Richtung der Marktbewegung zu stärken.

Der erste in diesem Handelstool verwendete Indikator ist Dual Stochastic. Hier verwende ich zwei Stochastiken, nämlich Fast Stochastic und Slow Stochastic. Bei Fast Stochastic gibt es eine Fast Stochastic-Hauptlinie und eine Fast Stochastic-Signallinie. Ebenso gibt es beim Slow Stochastic eine Slow Stochastic-Hauptlinie und eine Slow Stochastic-Signallinie. Der Schnittpunkt/die Kreuzung der Hauptlinie und der Signallinie bildet Aufwärts- und Abwärtspfeile.

Der zweite Indikator ist Double RSI, nämlich schneller RSI und langsamer RSI. Der Schnittpunkt der beiden bildet einen Auf- und Ab-Pfeil.

Der dritte Indikator ist Double CCI, nämlich schneller CCI und langsamer CCI. Der Schnittpunkt der beiden bildet einen Auf- und Ab-Pfeil.

Der vierte Indikator ist Dual MACD. Ähnlich wie bei der dualen Stochastik gibt es hier den schnellen MACD und den langsamen MACD. Beim Fast MACD gibt es eine Fast MACD-Hauptlinie und eine Fast MACD-Signallinie. Ebenso gibt es beim Slow MACD eine Slow MACD-Hauptlinie und eine Slow MACD-Signallinie. Der Schnittpunkt der Hauptlinie und der Signallinie bildet Aufwärts- und Abwärtspfeile.

Der fünfte Indikator ist RSIMA. Wie der Name schon sagt, werden hier die Auf- und Abwärtspfeile durch den Schnittpunkt der RSI-Linie mit der Linie des gleitenden Durchschnitts (MA) bestimmt. Wenn RSI > MA, dann zeigt der Pfeil nach oben und umgekehrt.

Der sechste Indikator ist der Four MA. Hier verwende ich vier gleitende Durchschnittslinien, nämlich MA 1,2,3,4. Der Schnittpunkt der Linie MA 1 mit MA 2 und der Linie MA 3 mit MA 4 bildet Aufwärts- und Abwärtspfeile.

Den Ergebnissen meiner Recherche zufolge verlieren viele Händler, weil sie nur einen Indikator verwenden. Deshalb habe ich dieses Handelstool entwickelt. Die sechs oben erläuterten Indikatoren werden die Richtung der Marktbewegung stärken.

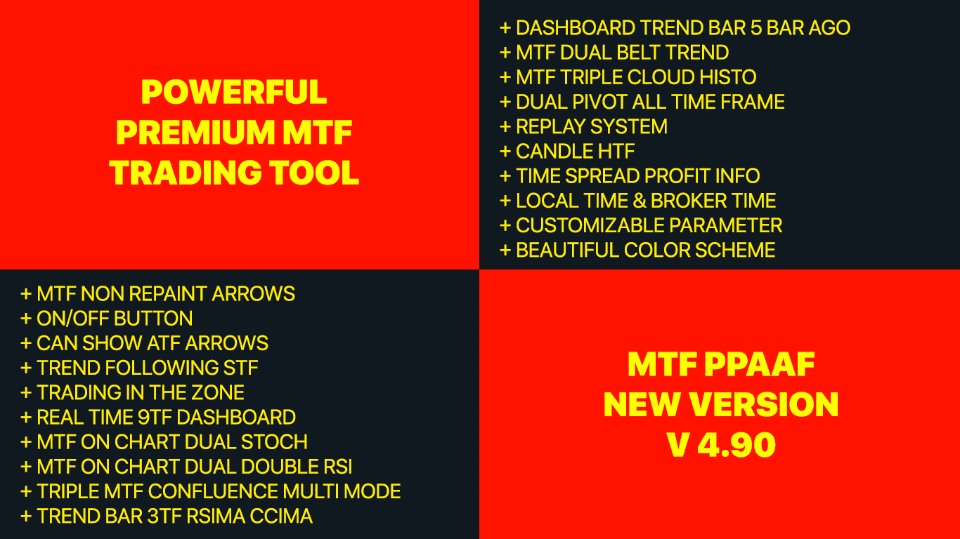
Um Marktbewegungen in Echtzeit zu sehen, habe ich dann verschiedene TOP-Funktionen hinzugefügt:

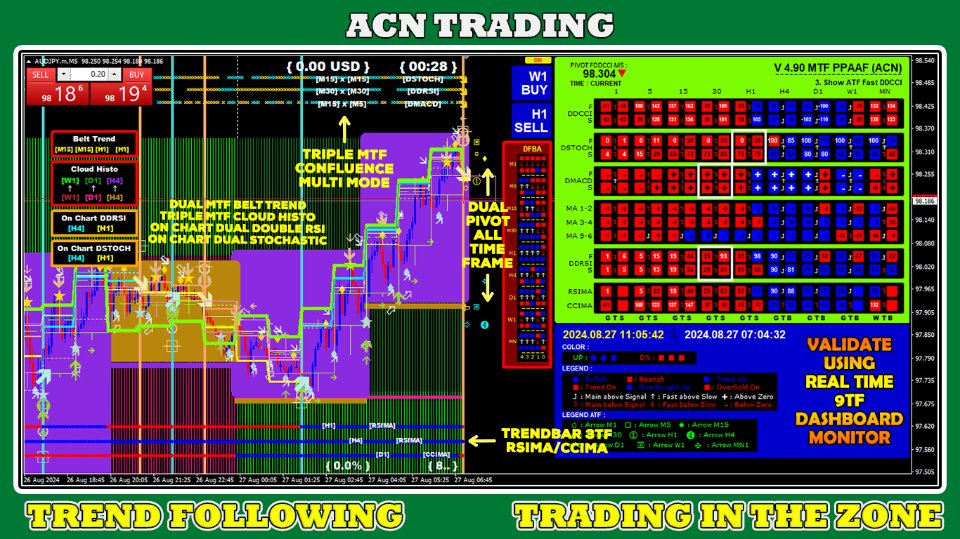
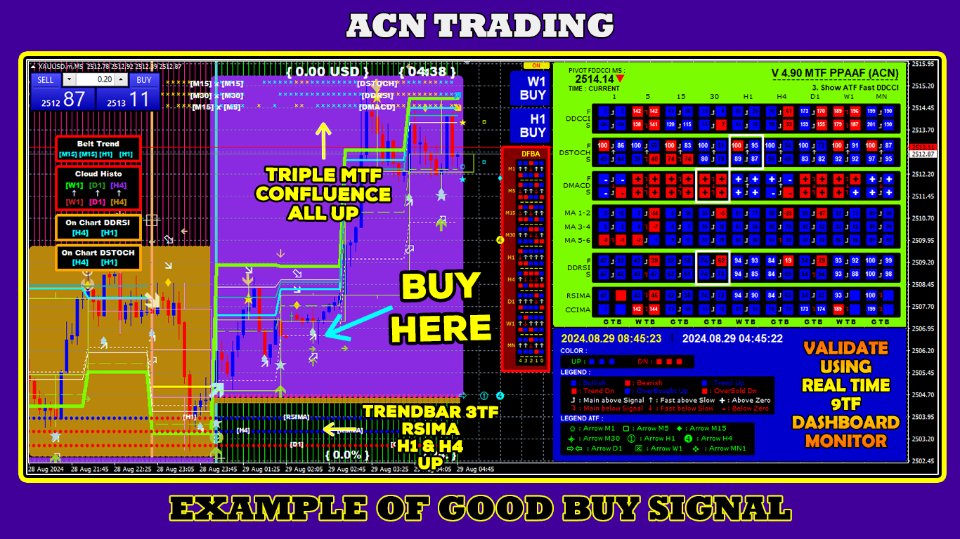
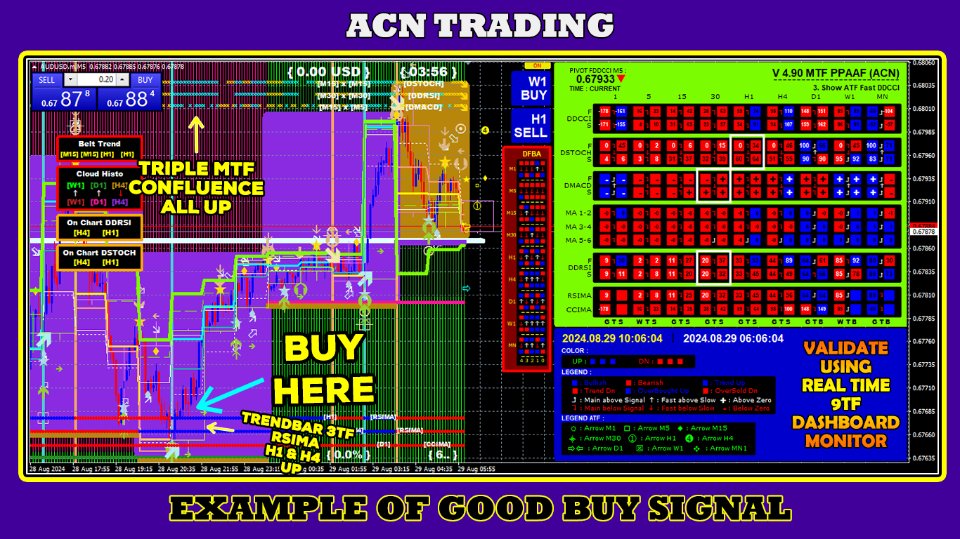
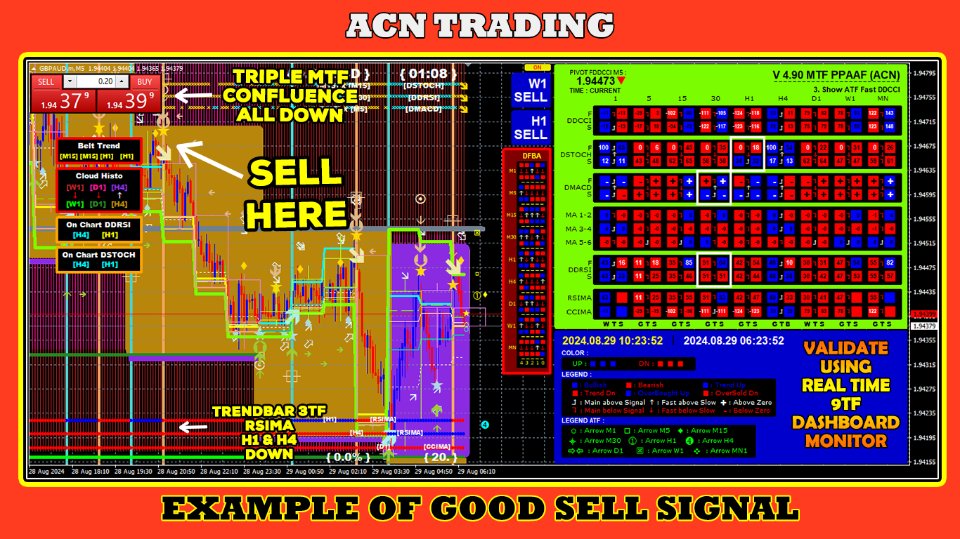
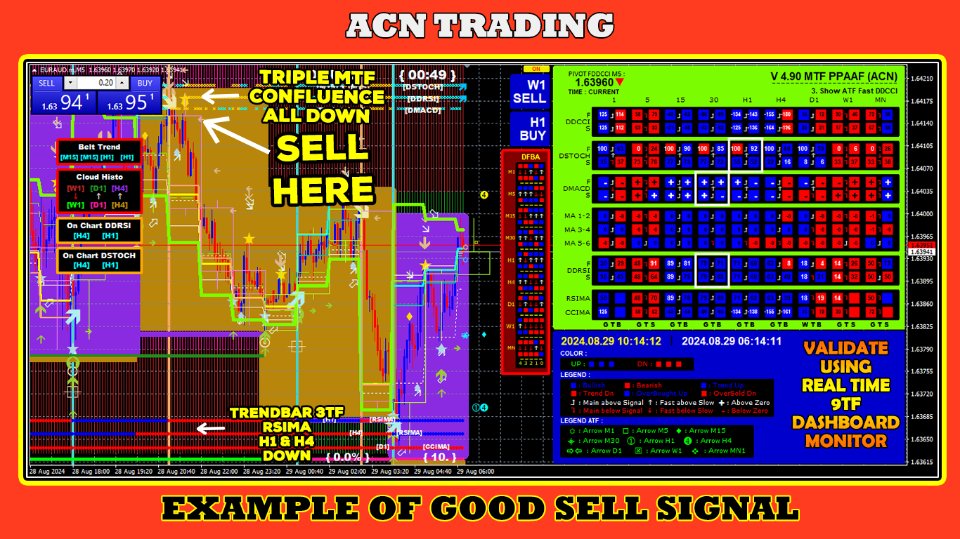
1. Echtzeit-9TF-Dashboard-Monitor. Mit dieser Funktion können Sie Marktbewegungen in Echtzeit vom 1-Minuten-Zeitrahmen bis zum MN1-Zeitrahmen sehen. Im Dashboard können Sie sehen, ob die Hauptlinie größer als die Signallinie ist oder nicht, ob die schnelle RSI-Linie größer als die langsame RSI-Linie ist oder nicht, ob die RSI-Linie ganz oben ist oder nicht usw. Sie Sie können auch sehen, ob die Stochastik-, RSI- und CCI-Werte überkauft oder überverkauft sind. Es ist sehr wichtig, das OBOS-Niveau (überkauft überverkauft) zu kennen.

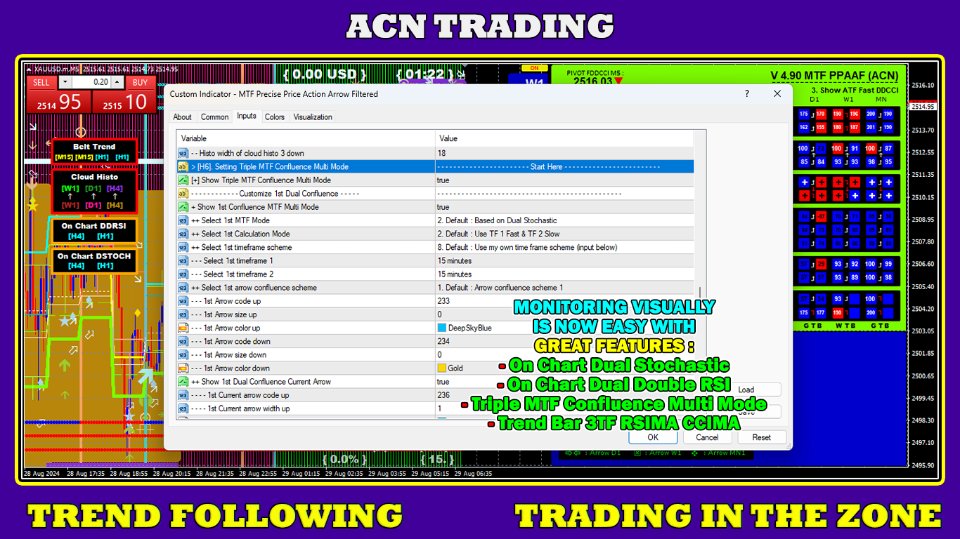
2. Auf Kartenfunktionen. Die visuelle Überwachung ist wichtig. Aus diesem Grund habe ich die Funktionen On-Chart Dual Stochastic, On-Chart Four MA, On-Chart Double RSI und On-Chart True RSIMA hinzugefügt. Zu Ihrer Information: Die Platzierung der Stochastik im Diagrammfenster ist genauer als die Platzierung der Stochastik im Unterfenster. Wenn Sie den Schnittpunkt der Hauptlinie und der Signallinie in Echtzeit im Diagrammfenster beobachten, können Sie Ein- und Ausstiegspunkte sicher bestimmen. Mein Prinzip ist „Niedrig kaufen, teuer verkaufen“. Bitte denken Sie an diesen Grundsatz.

3. Dieses Handelstool kann ATF-Crossover-Pfeile (alle Zeitrahmen) anzeigen:

- ATF Fast stochastic (Modus 1) anzeigen, nämlich Fast stochastic main line x Fast stochastic signal line

- ATF Fast MACD (Modus 2) anzeigen, nämlich Fast MACD-Hauptlinie x Fast MACD-Signallinie

- ATF MA 1x2 anzeigen (Modus 3), nämlich gleitender Durchschnitt 1 x gleitender Durchschnitt 2

- ATF DRSI (Modus 4) anzeigen, nämlich Fast RSI x Slow RSI

- ATF RSIMA (Modus 5) anzeigen, nämlich RSI x MA

- ATF DCCI (Modus 6) anzeigen, nämlich Fast CCI x Slow CCI

- ATF Fast stochastic DRSI (Modus 7) anzeigen, nämlich Fast stochastic main line x Fast stochastic signal line zusammen mit Fast RSI x Slow RSI

- Handel in der Zone (Modus 8), nämlich dem Schnittpunkt der Linie MA 1 mit MA 2 und der Linie MA 3 mit MA 4.

4. Super Trend Arrows (STA). Es gibt zwei STA-Berechnungsmodi. Der erste ist STA, der auf der Kreuzung von RSI und MA basiert. Und zweitens ist die Kreuzung von Fast RSI und Slow RSI.

5. Trendfolge-STF (ausgewählter Zeitrahmen). Hier können Sie den Zeitrahmen ganz nach Ihren Wünschen wählen. Wenn sich zwei Linien kreuzen, erscheint ein Pfeil. Außerdem erscheint der Trendfolgepfeil, wenn die Winkel der beiden Linien alle positiv (nach oben) oder alle negativ (nach unten) sind.

6. 9TF-Trendbalkenfunktion, die auf dem STA-Modus 2 basiert. Es gibt fünf Trendbalken, die Sie beobachten können.

Der Trendbalken ganz rechts ist der neueste Echtzeit-Trendbalken (0). Gefolgt vom vorherigen Trendbalken (1,2,3,4). Dieser Trendbalken ist nützlich, um Richtungsänderungen von Markttrends vom vorherigen Zeitrahmen zum aktuellen Zeitrahmen zu beobachten.

7. Pivot-Ebenen-Funktion. Diese Funktion zeigt Ihnen das Niveau des offenen Kerzenpunkts an, an dem der Crossover stattgefunden hat. Pivot-Ebenen ac

Ich mag S & R nicht, nämlich Support und Resistance.


8. Wiedergabesystem. Mit dieser Funktion können Sie in der Zeit zurückgehen und den Zustand des 9TF-Dashboards an einem bestimmten Tag und zu einer bestimmten Uhrzeit beobachten. Angenommen, Sie möchten analysieren, warum der Markt am 11.10.2023 um 14:21:30 Uhr verkauft. Um diese Funktion zu nutzen, öffnen Sie Ihr Meta Trader 4-Diagramm in einem niedrigeren Zeitrahmen, zum Beispiel M5.


9. Candle HTF (High Time Frame). Mit dieser Funktion können Sie Marktbewegungen im oberen Zeitrahmen (z. B. H1) sehen, wenn Sie den Chart im unteren Zeitrahmen öffnen (ich öffne ihn gerne bei M5).


10. TSPI (Time Spread Profit Info). Mit dieser Funktion können Sie in Echtzeit die aktuelle Zeit, den Spread, den Gewinn/Verlust und den Prozentsatz des Gewinns/Verlustes sehen.


11. Ein-/Aus-Tastenfunktion. Mit dieser Funktion können Sie dieses Handelstool mit nur einem Klick ein- oder ausblenden. Interessant, oder?


12. 20 Dashboard-Farbschemata, aus denen Sie wählen können. Mit dieser Funktion können Sie eine Dashboard-Farbe auswählen, die der Farbe Ihres Diagramms entspricht.


13. Anpassbare Parameter. Alle zur Berechnung der Indikatoren verwendeten Parameter können nach Ihren Wünschen angepasst werden. Sie können die stochastischen Parameter 14,3,3 oder 5,3,3 usw. verwenden. Oder Sie verwenden die Standardeinstellungen.


14. MTF, nämlich Multi Time Frame. Sie können einen Zeitrahmen nach Ihren Wünschen festlegen. Sie möchten beispielsweise die Dual-Stochastic-on-Chart-Funktion für die Zeitrahmen M5 und H1 aktivieren. Du kannst!


15. Nicht neu lackierte Pfeile (NRPA). Wenn sich zu irgendeinem Zeitpunkt zwei Linien schneiden, wird der Kreuzungspfeil angezeigt. Aufgrund der hohen Volatilität kommt es sehr häufig vor, dass sich die beiden Linien in den folgenden Sekunden und Minuten nicht schneiden. Dadurch verschwand der zuvor aufgetauchte Pfeil. Dies ist eine sehr wichtige Funktion. Denken Sie daran, dass bei hoher Volatilität der Pfeil, der zuvor nach oben zeigte, nach unten zeigen kann. Der zuvor aufgetauchte Pfeil könnte augenblicklich verschwinden. Deshalb ist meine Botschaft, die Validierung mithilfe des Echtzeit-9TF-Dashboard-Monitors durchzuführen!


16. Confluence 3TF-Funktion, d. h. 3TF Fast Stochastic Confluence, 3TF Fast MACD Confluence, 3TF MA 1x2 Confluence und 3TF DRSI Confluence. Mit dieser Funktion ist die Beobachtung von 3TF-Schnittpunkten (drei Zeitrahmen) sehr einfach. Das heißt zum Beispiel, wenn die schnelle stochastische Hauptlinie > die schnelle stochastische Signallinie im Zeitrahmen (M5, M15, M30) ist, dann erscheint ein AUFWÄRTS-Pfeil.


17. Konfluenz-Dual-Stochastic und Konfluenz-Dual-MACD. Wenn es bei dieser Funktion in der schnellen Stochastik und in der langsamen Stochastik eine Hauptlinie > Signallinie gibt, erscheint der AUFWÄRTS-Pfeil. Ebenso für Dual-MACD. Dies ist ein wirklich wichtiges Merkmal, um den Schnittpunkt zweier Stochastiken und zweier MACDs im gleichen Zeitrahmen zu beobachten.


18. Trendgürtelfunktion. Diese Funktion dient zusätzlich zur Anzeige zweier gleitender Durchschnitte im Diagramm. Selbstverständlich können Sie einen Zeitrahmen ganz nach Ihren Wünschen festlegen.


Die Verwendung nur eines Handelsindikators ist nicht sehr überzeugend. Deshalb kombinieren wir mehrere Indikatoren, um unsere Analyse der Marktrichtung zu stärken.


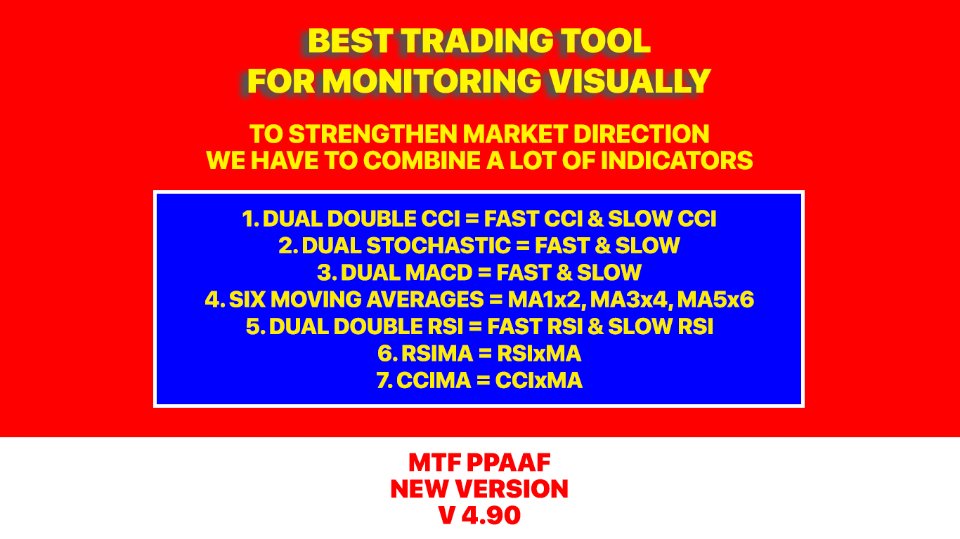
Die Preisaktionsbewegung kann dann mithilfe von 6 Indikatoren gefiltert werden:


RSIOMA

Dual MACD (Neue Version 1.3!)

Dual Stochastic (Neue Version 1.3!)

Doppeltes CCI (Neue Version 2.3!)

Vier gleitende Durchschnitte (Neue Version 1.6! Nicht nur zwei MA)

Doppelter RSI (Neue Version 1.2!)

Die Stärke der Richtung der Preisbewegung kann dann durch Überwachung des Echtzeit-9TF-Dashboards ermittelt werden.


Der 9TF-Dashboard-Monitor zeigt uns die Echtzeitdaten von Four Moving Average, RSIMA, Double RSI, Dual MACD, Dual Stochastic und Double CCI.


Ein-Klick-Schaltfläche, um den Indikator anzuzeigen oder auszublenden

9TF Echtzeit-Dashboard-Monitor

Überwachung von 9TF Four Moving Average, d. h. MA 1x2 und MA 3x4

Überwachung, ob die schnelle MA-Linie über oder unter der langsamen MA-Linie liegt

Überwachung des Winkels von schnellem MA und langsamem MA

Überwachung von 9TF Double RSI, d. h. Fast RSI und Slow RSI

Überwachung, ob die schnelle RSI-Linie über oder unter der langsamen RSI-Linie liegt

Überwachung von 9TF Dual MACD, d. h. schneller MACD (MACD 1) über oder unter langsamem MACD (MACD 2) und oben oder unten

Überwachung, ob die Haupt-MACD-Linie über oder unter der Signal-MACD-Linie liegt

Überwachung von 9TF Dual Stochastic, d. h. Fast Stochastics (Stochastik 1) über oder unter Slow Stochastics (Stochastik 2) und nach oben oder unten

Überwachung, ob die stochastische Hauptlinie über oder unter der stochastischen Signallinie liegt

Überwachung von 9TF Double CCI, d. h. der Position auf der OBOS-Linie und der aktuellen Bewegung

Überwachung von 9TF RSIOMA, d. h. RSI-Linie oberhalb oder unterhalb der MA-Linie

Möglichkeit, Parameter festzulegen und den Zeitrahmen nach Ihren Wünschen auszuwählen

Möglichkeit, Legenden ein-/auszublenden

Möglichkeit, die Anzahl der Balken zu erhöhen/verringern, der Standardwert ist 800 bar

Möglichkeit zur Auswahl von bis zu 20 Dashboard-Farbschemata

Dieser Indikator kann den RSIMA-Pfeil für den von Ihnen gewählten Zeitrahmen anzeigen

Dieser Indikator kann den MACD-Pfeil für den von Ihnen gewählten Zeitrahmen anzeigen

Dieser Indikator kann den stochastischen Pfeil für den von Ihnen gewählten Zeitrahmen anzeigen

Dieser Indikator kann den MA 1x2- und MA 3x4-Pfeil für den von Ihnen gewählten Zeitrahmen anzeigen

Dieser Indikator kann den Doppel-RSI-Pfeil für den von Ihnen gewählten Zeitrahmen anzeigen

Dieser Indikator kann den Doppel-CCI-Pfeil für den von Ihnen gewählten Zeitrahmen anzeigen

Pfeil nicht neu lackieren
Empfohlene Produkte
ROC acceleration-deceleration is the manual system for medium-term scalping. Indicator based on custom ROC system which defines bullish/bearish market and especially  acceleration-deceleration of tendention in the market's main direction. Buy arrow is plotted during bearish market when current trend decelerates and sell  arrow is plotted during bullish market when current trend decelerates. Main Indicator's Features Signals are not repaint,non-late or disappear(exept cases when system recalculat
Ultimate Hero MT4
Smart Forex Lab.
5 (1)
Gebaut für maximale Leistung. Optimiert für Gewinnentnahmen. Einführung einer neuen Option - Testen mit Emulation von Gewinnabhebungen. Ultimate Hero ist ein fortschrittliches Handelswerkzeug, das entwickelt wurde, um Ihre Forex-Gewinne zu maximieren. Diese fortschrittliche Handelssoftware wurde mit der neuesten GPT-4-Technologie entwickelt und verfügt über eine breite Palette an fortschrittlichen Funktionen. Ultimate Hero ist ein Handelsroboter, der eine auf dem Martingale-System basierende Gi
Trend New
Vitalii Zakharuk
Trend New Trend Indicator, shows the signals for entry. Displays both entry points and the trend itself. Shows statistically calculated moments for entering the market with arrows. When using the indicator, it is possible to optimally distribute the risk factor. Settings: Uses all one parameter for settings. Selecting a parameter, it is necessary to visually resemble it so that the appropriate graph has a projection of extremes. Options: Length - the number of bars for calculating the ind
Demand And Supply
Khurram Mustafa
1 (1)
Function Indicate Buy Sell Signals Indicate Strength of Buy Sell Signals This system is for both type of traders (Short & Long Term) Instead of Other Calculations, Parabolic Sar & Awesome are also used In Any time frame this can be use. What is in for Trader? Trading Switch:  Short Term & Long Term Finally, we all knows that Forex Trading needs completely concentrate & proper cash management, So I never promising that my program will never give you loss but I tried well to provide good and respo
FREE
Kilimanjaro EA
Botond Ratonyi
5 (1)
Check out my youtube channel about forex trading robots:  https://www.youtube.com/channel/UCL_p6fuQtNkg-1rRY69t5Ig Message me on telegram if you have any questions:  https://t.me/BRobotTrader H1 TIMEFRAME Updates and improvements(2021.08.12): USE THE SET FILES FROM THE COMMENT SECTION! This is the biggest update in the life of the KILIMANJARO EA, it got new features and NEW engine, plus many new parameters to optimize and play around with. ---It got the official TheNomadTrader
Der Berater tritt in den Markt ein, wenn eine hohe Wahrscheinlichkeit besteht, dass ein Trend beginnt. Der Eingang erfolgt, wenn die Grenzen der Bollinger Streifen durchbrochen werden. Oszillatoren und die Berechnung der ATR-Gangreserve werden ebenfalls verwendet. Für jede Position wird ein Stop-Loss-Verlust als Prozentsatz der Einzahlung festgelegt (in den Einstellungen -2% konservativ, 4-5% riskant) und ein Take-Profit von 5-10 zum Fuß. Jede Position wird von einem Trailing Stop begleitet. Es
PTW NON REPAINT TRADING SYSTEM + HISTOGRAM Non-Repainting ,   Non-Redrawing   and   Non-Lagging  Trading System. Does the following: - Gives Accurate Entry and Exit Points - Scalping, Day and Swing Trading  - 95% Accuracy  - Targets, where to take profits. - Shows Trends, Support and resistance levels - Works on All Brokers - Works on All Currencies, CFDs and Stocks - It does not place trades for you, it only shows you what trades to place. - It works on All Timeframes - It is for Trend or ra
Boost binary option profesional
Sebastian Alejandro Merino Sepulveda
Binarias & Forex (+90% Ratio-Win Next Candle) Espere que el precio llegue a una buena zona (fuerte) sea soporte, resistencia, zona de oferta o demanda, fibonacci level key, cifra redonda. Haciendo lo anterior definitivamente habrá una reversión en el precio y obtendrá su ITM en primera vela dando una efectividad del 100% siguiendo la tendencia. Es muy importante estar atento a las noticias fundamentales en el mercado y estas no afecten tu trading. Sesiones comerciales: cualquiera (24 horas).
1.Determine the trend size based on the chart cycle.   An uptrend near the highest price in a period of time.   A trend down near the lowest price in a period of time. 2.   short-term trends.   Oversold and long;   Overbought, short. 3. Unwind positions based on overbought and oversold and profit points. real-time signal: https://www.mql5.com/zh/signals/1538661?source=Site+Signals+My EA Settings: You need to load EA into the currency pair to trade (M15 time range). The best performing symbol : E
This system never paints.   This system created by using Envolpes bands and reverse bar count.   This indicator is only working in M5 period.   This system is for long term and profitable.   Signals are shown as arrows. as an optional limit orders.   You can set a voice alarm or email notification.   You can fins our other products from link : https://www.mql5.com/en/users/drbastem/seller   Also, you can ask all your questins from email : haskayafx@gmail.com or mobile : +90 530 867 5076 or @Meh
Mongol Indicator2
Sumiyabazar Buyanjargal
It's a variation of mid of HH and LL since it compares the higher of HH or LL against a period and twice the number of bars back to avoid whipsaws. I used to display this against lines on a chart, but made a histogram out of it and it looks interesting. It looks good at gauging trend strength and general turns (see image below). The name of the indicator is BAM, which is an acronym for "Below and Above Mid". Ways to use it: 1. To see general trend on longer TFs (more than 30 ba
This Expert Advisor has Three Trading Strategies: TRADING_STRATEGY_ONE - Intra Day / Short Term Trading Strategy. TRADING_STRATEGY_TWO - Mid Term / Long Term Trading Strategy. TRADING_STRATEGY_THREE - SMART__NEWS__TRADER - High Impact News Trading Strategy With 25 Years NFP History Trading in GBPUSD, EURUSD &  AUDUSD. NOTE: Default Settings Already Optimized For GBPUSD. Other symbols require optimization. Much and careful work has been done to package this E.A. all together. Having tested it w
Premium M15
Raphael Schwietering
Dear Investor, I am a full-time system developer since 2010, having developed thousands of trading systems in the last 11 years. My main goal when developing a strategy is long-term growth. All my systems have to pass strict criteria in terms of backtests, out-of-sample validations on unseen symbols, Monte Carlo simulations on different data feeds, slippage, and increased spreads.  It: Trades the EURUSD M15 with a focus on long-term growth. Opens trades at bar and uses no martingale nor any gri
This trading expert advisors is an clone & upgrade of  "EA Rough Duster ", also trades best on GBPNZD minute 5 timeframe. Maintains a constant account growth and runs best on low spread and commission based accounts. Uses Martingale & perfect hedging to recover unprofitable positions ensuring no loss. Its consistent profit curves,low DrawDowns & risk proves the record for itself in reliability and consistency plus its unique market analysis ensures quick extraction of profits by scalping the mar
The AlgoKing Lightning Bolt Strategy is a trade manager and has multiple indicators built for a complete trading strategy.  Here is a list of indicators built in. Indicators Auto drawn Support and Resistance signals Auto drawn RSI Divergence signals Auto drawn Fibonacci Retracement signals with buy and sell entry lines. Lightning Bolt reversal signals. Auto drawn trend lines. Trade Management Auto take partials at simple moving average targets. Auto take partial and stop losses at Fibonacci re
Mit diesem Handelstool können Sie 15 Märkte gleichzeitig scannen. Einführung eines neuen Handelsindikators 2024: ️ Dashboard Multi-Währung Multi-Time-Frame Stochastic. Es gibt mindestens zwei Gründe, warum ich dieses Handelstool entwickelt habe: Erstens ist es mir langweilig, nur einen Markt zu beobachten. Zweitens möchte ich den Einstieg in einen anderen Markt nicht verpassen. Deshalb möchte ich gleichzeitig auch andere Marktbedingungen kennen. Aus diesem Grund benötige ich einen
Anemone
Sean Christian Hammond
Erstellt mit künstlicher Intelligenz, KI, um sichtbare Verhaltensmuster eines lebenden Organismus in die Trendanalyse einzubeziehen. Die Chaostheorie trifft auf den gleitenden Durchschnitt. Die filtrierende Seeanemone streckt ihre Ranken in ein Meer von Nährstoffen aus, um sich selbst anzureichern. Ich werde Ihre Zeit nicht mit überlangen Beschreibungen verschwenden, das Konzept ist unter diesen Bedingungen verständlich. Es handelt sich um einen anpassbaren periodenrotierenden gleitenden Durchsc
Valentines
Victor Golovkov
Valentines trend is an easy-to-use indicator that hides a powerful calculation math-system "under the hood". Attach the indicator to the chart and set the parameters. Period - period for tracking changes in quotes Amount of Bars - number of last bars to track You do not need to select any numerical parameters. The indicator will do everything for you automatically . Each signal is generated on the current bar, and in order not to miss it, use the built-in alerts and notifications system . The in
The indicator scans for TD Combo signals in multiple timeframes for the all markets filtered and shows the results on Dashboard. Key Features Dashboard can be used for all markets It can scan for signals on MN1, W1, D1, H4, H1, M30, M15 ,M5, M1 timeframes Parameters UseMarketWatch: Set true to copy all symbols available in market watch MarketWatchCount : Set the number of symbols that you want to copy from the market watch list. CustomSymbols: Enter the custom symbols that you want to be availa
The EA uses scalping strategy at night, trading consists of three algorithms and each algorithm works in its own time interval. The EA uses many smart filters to adapt to almost any economic situation. Pending orders are used for the least slippage when trading scalping. The adviser is safe and does not require any settings from the user, just install it on the chart and you are ready. The EA sets a protective stop order, so the trader does not have to worry that the robot will allow significant
Implement
Vitalii Zakharuk
5 (1)
Implement analyzes market dynamics for pivot points. If you want to learn how to spot the correct reversals for consistently likely profitable trading, buy this indicator. Shows favorable moments of entering the market in stripes. Ready-made trading system. The principle of operation of the indicator is to automatically determine the current state of the market when placed on a chart, analyze historical data based on historical data and display instructions for further actions on the trader's
Der R Var Moving Average Indicator ist ein Trendfolgeindikator, der für eingefleischte Trendfolger entwickelt wurde. Es ist ein sehr beliebter Devisenhandelsindikator unter Aktienhändlern sowie Rohstoffhändlern, und seine Popularität ergibt sich aus seiner Fähigkeit, seinen Benutzern echte Signale zum Geldverdienen zu liefern. Der Indikator besteht aus grünen und roten Punkten, die auf einer Sienna-Linie platziert sind. Der grüne Punkt zeigt auf ein bullisches Signal, während der rote Punkt
I speak in Hungarian. Magyarul beszélek benne. Első felvétel. https://www.youtube.com/watch?v=FfqvT-i9TPk&feature=youtu.be (Első felvétel. https://www.youtube.com/watch?v=MapbQrJ0uPU&t=9s   Első felvétel. https://www.youtube.com/watch?v=i2id5O1KPrI Második felvétel. https://www.youtube.com/watch?v=Zp2i7QN-IMc Első felvétel. https://www.youtube.com/watch?v=h7UbTWiM-Lw Második felvétel. https://www.youtube.com/watch?v=y54q4Rasf2A&t=1s Harmadik felvétel. https://www.youtube.com/watch?v=13zYjso
E13 Acid Flux
Dariel Iserne Carrera
4 (1)
Basierend auf einer Kombination von Indikatoren, E13 Acid Fulx ist ein ausgezeichneter Indikator für zu wissen, wann zu kaufen oder zu verkaufen auf einem Vermögenswert und Temporäreität. Der Indikator selbst habe ich als Werkzeug für meine Analyse beim Handel mit Forex verwendet. Es ist ein nützlicher und leicht verständlicher Trendindikator.  Wenn Sie es mit Ihren eigenen Analysen kombinieren, werden Sie sicherlich ein gutes Ergebnis in Ihrer Operation erhalten.
FREE
Wardtrade17
Ahmed Wardan Atik
5 (1)
Your feedback is very important , Please submit your review and contact me to get a settings for other pairs !! This Expert advisor is a very logical, it does not promise irrational wealth as in many advisors offered for sale, it gives an annual profit ranging from 10% to 42%, the expert advisor is intended to work only on one pair, which is the EURUSD Time frame H1 ,  and in only one day, which is Monday  . Just run the expert advisor on the EURUSD pair on Monday and earn a minimum of 10% As
MAs COMBO
Dora Nafwa Mwabini
Dieser Indikator verwendet eine Kombination aus gleitenden Durchschnitten.   Von Anfang an werden Sie in der Lage sein, ein sehr einfaches, aber profitables Strategiemuster zu identifizieren (selbst ein Anfänger-Trader wird es nicht übersehen). Es enthält bereits definierte Eingabeparameter für den Benutzer. Trotz der bereits definierten Parameter können Benutzer NUR die FARBEN ändern, um sie ihren Vorlieben oder ihrem Geschmack anzupassen. Eingebaute Parameter – Sie müssen sich also kein
Strong bear MT4
Elham Bahramirad
Liebe Forex-Trader, Lernen Sie Strong Bear kennen: Revolutionierung des automatisierten Handels mit hochmodernen KI-Technologien im Forex-Markt! "Aktueller Preis mit 75% Rabatt für Erstkäufer!" Verpassen Sie nicht diese hervorragende Rabattmöglichkeit! "Wir freuen uns, Ihnen unseren neuen automatisierten Handelsroboter vorstellen zu können. Dieser fortschrittliche Roboter garantiert ein stressfreies Handelserlebnis, das für alle Kontogrößen geeignet ist, mit einer Anfangsinvestition von nur 1
" Valiant Strong Trend " - Your Ultimate MT4 Signal Indicator Are you ready to elevate your trading game to new heights? Look no further than the "Valiant Strong Trend" MT4 signal indicator, your indispensable tool for navigating the complex world of financial markets. Key Features: Precise Trend Identification : "Valiant Strong Trend" employs advanced algorithms to accurately identify market trends, whether they are bullish or bearish. Say goodbye to guesswork and hello to informed trading deci
ZORRO 3 in 1
Vladimir Pokora
This robot combines three ways of trading and for all uses the same successful money management. All three ways of trading can be used simultaneously or separately. Auto search and trading SR levels and their breakout. News trading - at a specified time placed pending orders for BUY and SELL. Manual opening trades using buttons in the chart. For these your trades will use the same money management as for automated trading. Is recommended ECN broker with minimal spread and with minimal slip and
Fibo Reversals is an indicator which has carefully been put together to attempt to indicate a time period in which an ongoing trend is most probably exhausted and a new trend (actually a reversal trend) inadvertently begins. At this, it should be okay for the manual trader to be on the look out for good trading opportunities. Input Settings Father Fibo  – This Input Determines The Highest Price For The Chosen Input Period. Son Fibo  - This Input Determines The Lowest Price For The Chosen Input
Käufer dieses Produkts erwarben auch
Gann Swing Structure
Kirill Borovskii
5 (1)
This indicator is based on the mathematics of the great trader W.D. Ganna. With its help, you can easily find strong levels by analyzing swings to find the optimal entry point. The indicator works on all instruments and all timeframes. The indicator is fully manual and has control buttons. All you need to do is press the NEW button, a segment will appear, which you can place on any movement, swing or even 1 candle that you want to analyze. By placing the segment, press the OK button. A grid (th
Bomb Bank Signal
Igor Pereira Calil
5 (1)
Bombenbanksignal: Ihr Vertrauensindikator in MetaTrader 4 Bomb Bank Signal ist ein leistungsstarker Indikator für MetaTrader 4, der entwickelt wurde, um die relevantesten Trends auf dem Finanzmarkt zu identifizieren. Wenn Sie nach einem Tool suchen, das Bewegungen genau vorhersieht, ist die Bomb Bank der Verbündete, den Sie brauchen. So funktioniert es: Dieser Indikator kombiniert drei unterschiedliche Methoden – Volumenanalyse, Kerzenschließungen und symmetrischer Trend –, um Kauf- und V
Septermber OFFER 85% OFF next price for unlimited version will be 2500$. This is the only time you can get this institutional and professional indicator at this price for unlimited version. Don't dare to miss this. The tool I am about to introduce to you you can't compare it with other tools due to its strategy and accuracy level in predicting the next price directional movement. This tool is designed for serious traders who have decided to make a difference through trading. Be the next person t
Dear Traders this is my another tool called " Swing Master Indicator ". As the name above the indicator is designed to help you in swing trading by capturing the low and highs of the price. You may us this tool with any trading strategy and style from scalping to position trading. It is made for level of traders including newbies and advanced traders even prop-firms, hedge funds and banks to help them make sold market analysis. I create tools for serious traders who want to make a difference in
This indicator is based on the Gann Signal indicator and acts as a market scanner. All you need to do is fill in the selected currency pairs in the settings and that’s it. Next, the indicator itself will view all these currency pairs and time frames from M5 to D1 simultaneously. When a new signal appears, the indicator will give you an Alert and also draw the letter N where this new signal will be.
Connect Indicator
Sukunthakan Ngernbamrung
Connect Indicator is a tool used for connecting indicators between the MQL market and MT4. The connected indicators are made by our group and can be used for other applications, such as sending messages to the Line application or Telegram application. If you have any questions, please don't hesitate to ask us to receive support. Function and indicator buffer Buffer one is the high price of the previous candle. Buffer two is the high price of the previous candle. Usage To connect indicators to fu
Precautions for subscribing to indicator This indicator only supports the computer version of MT4 Does not support MT5, mobile phones, tablets The indicator only shows the day's entry arrow The previous history arrow will not be displayed (Live broadcast is for demonstration) The indicator is a trading aid Is not a EA automatic trading No copy trading function The indicator only indicates the entry position No exit (target profit)  The entry stop loss point is set at 30-50 PIPS Or the front
MT My Way
Issara Seeboonrueang
Best strategy,  Easy trade ,  Support of version update in the future MT My Way:  "Why are successful traders outnumbered by those who fail? The goal of this project is to find strategic entry points where you can trade against the crowd effectively. For beginners, the approach is simple: enter trades on signals and exit when there’s an opposite signal or a designated exit indicator. Stop Loss can be set at the arrow, with the distance defined by the Arrow Gap. For experienced tra
Moving pivot Average Fibonacci The  indicator compares the selected period with its counterpart from the previous period. The indicator determines the moving Fibonacci levels for the day or any time interval to assess the price movement range from the time average. The indicator helps predict the expected high or low for the day based on historical time data. The pivot line can be considered an average trend line and use it in a variety of trading strategies. If you have any question about t
Der TRANSACTION SPEED ist der hochwertigste Indikator, der anzeigt, wo und wann sich große Aufträge auf dem Markt ansammeln und welche Vorteile dies mit sich bringt. Er erkennt Trendänderungen in einem sehr frühen Stadium. Er ist gleichzeitig ein Indikator und ein Handelssystem. Das Konzept ist einzigartig und unglaublich profitabel. Im Devisenhandel wird das Tick-Volumen irreführenderweise als Volumen bezeichnet. In Wirklichkeit handelt es sich um die Preisveränderung pro Zeiteinheit, was de
NOTE: PRICE WILL RISE VERY SOON. DON'T SKIP THIS OFFER! Dear traders I am glad to introduce the " Market Swing Scanner Board" indicator to you. This indicator was made mainly to be used in combination with the Market Swing Index Indicator. You use the  "Market Swing Scanner Board"  indicator to scan for trading opportunities on the  Market Swing Index Indicator . This tool is designed for serious traders who have decided to make a difference through trading. Be the next person to witness this st
Al in one level
Kundan Kumar Srivastava
5 (1)
This indicator is collection of important dynamic support and resistance giving a trader crystal clear idea , where to sell and where to buy. it completely complements trend lines, support, resistance, and sideways market and allow a trader to make sustainable profits. The thickness of lines suggests its strengths, the thicker the dynamic line, the stronger is rejection or pullback allowing a trader to make multi-fold profit, as they can clearly see them. Introducing Your Ultimate Trading Edge
Robot Choppiness
Diego Mauricio Padilla Mendez
3 (2)
Der Choppines-Roboter wird als Indikator im MT4-Indikatorordner geladen Es wird empfohlen, eine Kerzenzeit von 5 Minuten zu verwenden, die empfohlene Ablaufzeit des Roboters beträgt 5 Minuten. Der Roboter kann so konfiguriert werden, dass er Signale an die Plattformen MT2, MX2 und PRICEPRO sendet. Um Signale zu senden, müssen Sie das Connector-Programm der Plattform verwenden, mit der wir arbeiten möchten. Führen Sie zur Installation auf dem Connector das folgende Verfahren durch (ein Bil

Oni Scalper
Goh Cheng Wai
5 (2)
Dear Onis, This Indicator is used for   GBPUSD, US30 and GOLD on 1-Min Chart . For US30 , Depending on your broker, Minimum Lot Size will differ from 0.01 to 1.0 lots. My Current Account is trading at 1.0 lots at $1 per point . Please check with your Broker what's the Margin Required for your Minimum lot sizes before you trade on your Real account. I have Forward Tested the indicator for around 6 months before releasing it to the public. ( No Demo is available for the Indicator, Strategy
Automatic, live & interactive picture of all trendlines. Assign push, email and sound alerts to the lines of your choice and be informed about price rollback, breakout, rollback after breakout, number of rollbacks, line expiration by double breakout. Correct, drag or delete the lines and interactively tune the line system. https://youtu.be/EJUo9pYiHFA . Chart examples https: //www.mql5.com/en/users/efficientforex Price Interaction Events All events are effective immediately and only after on
The indicator displays the probable ( Support and resistance ) levels. The indicator draws horizontal and trend levels of support and resistance. The indicator settings: Trends - the mode for displaying trend lines or horizontal lines of support and resistance Yes - display trend lines only No - display horizontal lines only UseResource - use the resources built into the indicator. Yes - use the ZigZag indicator from the resources of the product. No - use a custom ZigZag indicator. HistoryBar -
The indicator of a Professional Trader is an arrow indicator for predicting the direction of price movement. I have been working on this indicator since 2014. You can use this indicator as your main indicator, use its entry signals, and use it as your only indicator to find entry points. About the product: Recommended TF [H4-D1-W1]   . The indicator predicts the direction of the next candle. Fits a variety of tools; Flexibility in settings for different instruments and intervals through the
The [GRAFF] III manual trading system is based on multiple MetaTrader (MT4) indicators. Together, the entire PACK of GRAFF III indicators makes an advanced trading tool. The system consists of over 20 different custom-built indicators which have been carefully selected and tested in the long term to produce strong and efficient trading signals. The particular indicators are based on different mathematical formulas, so the entire system is calibrated to remove false signals from its own indicator
You can fins our other products from link : https://www.mql5.com/en/users/drbastem/seller   Also, you can ask all your questins from email : haskayafx@gmail.com or mobile : +90 530 867 5076 or @MehmetBastem    on telegram application This indicator is used to determine the trend. Standard Osma indicator is used. It has the indicator warning system: beep, e-mail and has three types of alerts, including messages to mobile phone. It shows the best performance on the chart of 5 minutes. When the
You can fins our other products from link : https://www.mql5.com/en/users/drbastem/seller   Also, you can ask all your questins from email : haskayafx@gmail.com or mobile : +90 530 867 5076 or @MehmetBastem    on telegram application This indicator is used to determine the trend. Standard Three Moving Average and ADX indicators are used. It has the indicator warning system (audio, e-mail) and three types of alerts, including messages to mobile phone. It shows the best performance on M5. When
This indicator is used to determine the trend. Standard Three Moving Average and ADX indicators are used. It has the indicator warning system (audio, e-mail) and three types of alerts, including messages to mobile phone. It shows the best performance on M5. When the trend value reaches the value set, the warning system is activated. This indicator works only with Forex symbols. Inputs SoundAlarm = true - Sound Alert Sendmail=true - Send an e-mail in case of a buy or sell signal Sendnotificatio
You can fins our other products from link : https://www.mql5.com/en/users/drbastem/seller   Also, you can ask all your questins from email : haskayafx@gmail.com or mobile : +90 530 867 5076 or @MehmetBastem    on telegram application This indicator is used to determine the trend. Standard MACD indicator is used. It has the indicator warning system: beep, e-mail and has three types of alerts, including messages to mobile phone. It shows the best performance on the chart of 5 minutes. When the
Smooth price for Monarch MT4
Konstantin Gruzdev
3.67 (3)
The Smooth Price technical indicator is used for plotting a smoothed line as close to the price of the financial instrument as possible, and serves to eliminate its noise components. The indicator is part of the Monarch trading system, but here it is presented as an independent technical analysis tool. The indicator is based on the cluster digital filter , which, unlike the ClusterSMA , is applied directly to the price time series. Smooth Price does not redraw (except the very last, zero bar) an
Regression Channel Tools" basiert. Durch die Nutzung dieses Tools können Trader eine außergewöhnliche Kontrolle über ihren Chart-Regression-Kanal erlangen und fundiertere Handelsentscheidungen treffen. Das Regression Channel Tool ist ein leistungsstarkes Instrument im Werkzeugkasten eines Traders. Es soll wertvolle Einblicke in Preisentwicklungen und potenzielle Unterstützungs- und Widerstandsniveaus bieten. Das Tool eignet sich besonders gut zur Visualisierung von Korrekturwellen innerhalb eine
A simplistic indicator informing a user on RSI divergence by sending messages to mobile device and email. The indicator draws 2 vertical lines, marking two RSI extrema that formed the divergence. You get the alert, open the charts and make a decision. The indicator does not show past divergences, thus when you attach it to a chart for the first time you see nothing. Graphics and alerts will appear as soon as divergences do. Drop it in Tester to see how it works. Parameters: RSIPeriod - number of
Green Wall Arrows
Daniel Luchinger
1 (1)
The Name Green Wall : Arrows hits a lot of TP, by changing the idea of non using SL as something bad, but instead use Small TP and a lot of free Margin and Patience. Use micro TP and a lot of Free Margin with this indicator on Forex. It also can be used with Binary Options. This strategy is intended to be traded Manually. This Indicator runs on Open Bar, arrows will delete when price are against it. The only Indicator Parameter is Alerts true/false, all the rest is included inside the code. Arro
Golden Monowave
Ahmed Mohamed Ali
Golden Monowave is monowave indicator, the monowave theory is one of Elliott wave approach and one of most complicate and accurate method. Golden Monowave can shortcut many major steps to identify and describe the monowave. It works on any timeframe and with any trading instrument, including currencies, indices, futures, etc. Input Parameters initial_Bars - set the initial number of bars to calculate. wave_color - select the color of the wave. label_color - select the color of labels. temp_lab
Ticks Size
Viktor Kolmakov
This indicator displays in a separate window the difference between the number of points which increased the price, and the number of points that decreased the price during the time interval specified in the settings. The time interval for calculation is expressed as the number of bars of the chart the indicator is attached to. This approach allows you to evaluate the movement direction (growth or fall) of the instrument's price, the strength of the movement and the size of the movement in point
NostradamusMT4
Andrey Spiridonov
1 (1)
NostradamusMT4 is a powerful indicator from the set of professional trader. The indicator is based on Andrei Spiridonov's original price calculation method (ESTIMATED PRICE) for the current candle price. Advantages The indicator does not redraw. It works on any timeframes. Works with any trading instruments. Perfectly suitable for scalping and trading binary options. Parameters Color - color of the ESTIMATED PRICE FUTURE line. How to work with the indicator The indicator forms the ESTIMATE
Weitere Produkte dieses Autors
[V 1.00] MTF NRPA 5 Moving Average RTD wurde veröffentlicht! Pfeil-Echtzeit-Dashboard ohne Neulackierung. Wenn Sie nach dem besten Indikator für den gleitenden Durchschnitt suchen, sind Sie hier genau richtig. Im Allgemeinen werden zwei gleitende Durchschnitte festgelegt, da der Schnittpunkt der beiden gleitenden Durchschnitte (der Crossover) die Richtung des nächsten Preistrends bestimmt. Wenn sich der schnelle gleitende Durchschnitt mit dem langsam gleitenden Durchschnitt schneidet und sc
Die Analyse mehrerer Zeitrahmen eines Währungspaares in einem Fenster kann Sie verwirren. Um mehrere Zeiträume zu analysieren, benötigen Sie zuverlässige Indikatoren. Einer von ihnen verwendet die 9TF-MACD-Kurve. Ich habe Tag und Nacht daran gearbeitet, Code zu erstellen, der einfach, aber zuverlässig ist und alle neun Zeitrahmen in nur einem Indikator abdeckt. Schauen wir uns einige der Vorteile dieses Indikators an: Buntes Histogramm. Die Farbe der Kurve in jedem Zeitrahmen untersch
Die Analyse mehrerer Zeitrahmen eines Währungspaares in einem Fenster kann Sie verwirren. Um mehrere Zeiträume zu analysieren, benötigen Sie zuverlässige Indikatoren. Einer von ihnen verwendet 9TF STOCH RSI. Ich habe Tag und Nacht daran gearbeitet, Code zu erstellen, der einfach, aber zuverlässig ist und alle neun Zeitrahmen in nur einem Indikator abdeckt. Schauen wir uns einige der Vorteile dieses Indikators an: Buntes Histogramm. Die Farbe der Kurve in jedem Zeitrahmen unterscheidet
Analyzing multiple time frames of a currency pair in one window can make you confused. To analyze multiple time frames, you need reliable indicators. One of them is using 9TF RSI MA . I've been working day and night to create code that is simple but reliable and covers all nine time frames in just one indicator .  Let's look at some of the advantages of this indicator: Colorful histogram . The color of the curve in each timeframe is different from one another.  Arrows indicating the crossing of
Analyzing multiple time frames of a currency pair in one window can make you confused. To analyze multiple time frames, you need reliable indicators. One of them is using 9TF MACD Limited Bar . I've been working day and night to create code that is simple but reliable and covers all nine time frames in just one indicator .  Attention! When first installed, the indicator does not look intact. Changing the timeframe will solve the problem. Let's look at some of the advantages of this indicator: C
Analyzing multiple time frames of a currency pair in one window can make you confused. To analyze multiple time frames, you need reliable indicators. One of them is using 9TF STOCH RSI LIMITED BAR . I've been working day and night to create code that is simple but reliable and covers all nine time frames in just one indicator .  Attention! When first installed, the indicator does not look intact. Changing the timeframe will solve the problem. Let's look at some of the advantages of this indicat
Die Analyse mehrerer Zeitrahmen eines Währungspaares in einem Fenster kann Sie verwirren. Um mehrere Zeiträume zu analysieren, benötigen Sie zuverlässige Indikatoren. Einer von ihnen verwendet 9TF Double RSI Double MA. Ich habe Tag und Nacht daran gearbeitet, Code zu erstellen, der einfach, aber zuverlässig ist und alle neun Zeitrahmen in nur einem Indikator abdeckt. Schauen wir uns einige der Vorteile dieses Indikators an: Doppeltes RSI, d.h. RSI schneller & RSI langsamer. Doppelter
Die Analyse mehrerer Zeitrahmen eines Währungspaares in einem Fenster kann Sie verwirren. Um mehrere Zeiträume zu analysieren, benötigen Sie zuverlässige Indikatoren. Einer von ihnen verwendet 9TF Double CCI Double MA. Ich habe Tag und Nacht daran gearbeitet, Code zu erstellen, der einfach, aber zuverlässig ist und alle neun Zeitrahmen in nur einem Indikator abdeckt. Schauen wir uns einige der Vorteile dieses Indikators an: Doppeltes CCI, d.h. CCI schneller & CCI langsamer. Doppelter
Ein genauer CCI-Indikator ist verfügbar. Dashboard Trendleiste Smart Level 9TF Double CCI. Doppelter CCI, d.h. Fast CCI & Slow CCI Warum brauchen Sie ein zweites CCI? Die Verwendung zusätzlicher Indikatoren wird uns im Live-Handel mehr überzeugen 9TF Fast CCI-Kurve 9TF Langsame CCI-Kurve 9TF Echtzeit-CCI-Winkel 9TF Echtzeit-CCI-Wert 9TF Echtzeit-CCI-Richtung/Phase 9TF Trendleiste Neuer Algorithmus bei der Berechnung des Trendbalkens An / aus Schalter. Sehr nützlich, um den Indikator mit nur e
Ein genauer RSI-Indikator ist verfügbar. Dashboard Trendleiste Smart Level 9TF Double RSI. Doppelter RSI, d.h. schneller RSI & langsamer RSI Warum brauchen Sie einen zweiten RSI? Die Verwendung zusätzlicher Indikatoren wird uns im Live-Handel mehr überzeugen 9TF Schnelle RSI-Kurve 9TF Langsame RSI-Kurve 9TF Echtzeit-RSI-Winkel 9TF Echtzeit-RSI-Wert 9TF Echtzeit RSI Richtung/Phase 9TF Trendleiste Neuer Algorithmus bei der Berechnung des Trendbalkens An / aus Schalter. Sehr nützlich, um den Ind
Ein genauer MACD-Indikator ist verfügbar. Dashboard Trend Bar Smart Level 9TF Double MACD. Dual MACD, d.h. schnell (MACD 1) & langsam (MACD 2) Warum brauchen Sie einen zweiten MACD? Die Verwendung zusätzlicher Indikatoren wird uns im Live-Handel mehr überzeugen 9TF Fast MACD 1-Kurve 9TF Langsame MACD 2-Kurve 9TF MACD-Winkel in Echtzeit 9TF MACD-Wert in Echtzeit 9TF-Echtzeit-MACD-RichtungEin genauer MACD-Indikator ist verfügbar. Dashboard Trend Bar Smart Level 9TF Double MACD. Dual MACD, d.h
Ein genauer stochastischer Indikator ist verfügbar. Dashboard Trend Bar Smart Level 9TF Dual Stochastic. Dual Stochastic, d. h. Fast Stochastic & Slow Stochastic Warum brauchen Sie die zweite Stochastik? Die Verwendung zusätzlicher Indikatoren wird uns im Live-Handel mehr überzeugen 9TF Fast Stochastic-Kurve 9TF Langsame stochastische Kurve 9TF Stochastischer Winkel in Echtzeit 9TF Echtzeit-Stochastikwert 9TF Echtzeit Stochastische Richtung/Phase 9TF Trendleiste Neuer Algorithmus bei der Bere
[V 1.00] MTF NRPA 5 RSI RTD wurde veröffentlicht! Pfeil-Echtzeit-Dashboard ohne Neulackierung. Wenn Sie es satt haben, verschiedene RSI-Indikatoren zu verwenden, aber feststellen, dass diese ungenau sind, dann probieren Sie dieses eine Tool aus. Normalerweise installieren Leute nur 1 RSI, um den OBOS-Level in einem bestimmten Zeitraum zu bestimmen. Die schlechte Nachricht ist, dass Sie die OBOS-Werte und -Trends nicht in verschiedenen Zeiträumen gleichzeitig sehen können. Deshalb habe ich d
Introducing the advanced trading tools of 2023. MTF PPAAF Model S. This is sub window version of my best trading tool : MTF Precise Price Action Arrow Filtered.  Click here to learn more about MTF PPAAF . This trading tool is equipped with various powerful features : MTF = Multi Time Frame = Time Frame can be changed. On/off button. Non Repaint Arrows.  Customizable parameter, color etc.  Can show all time frame (ATF) crossover arrows of fast stochastic main line & fast stochastic signal line (
If you are curious about the position of the stochastic, RSI, CCI curve, whether it is at the OBOS level or not, then this trading tool is for you. Introducing the advanced trading tools of 2024. ATF Trend Following Trend Bar OBOS. This indicator is similar to MTF PPAAF Model S but have two layers.  Click here to learn more about MTF PPAAFS . This trading tool is equipped with various powerful features : MTF = Multi Time Frame = Time Frame can be changed. On/off button. Customizable parameter,
Hallo Händler. Ich stelle Ihnen mein bestes Trading-Tool vor. MTF PPAAF Modell T. Multi-Time-Frame Präzise Preisaktion, gefiltertes Modell T.  Dieses Handelstool ist meine beste Arbeit nach Jahren der Entwicklung verschiedener Handelstools. Warum ist dieses Handelstool das beste und zuverlässigste?  1. Dieses Tool verwendet 6 Indikatoren:  Doppelter CCI = schneller CCI x langsamer CCI Dual Stochastik = schnelle Stochastik (schnelle stochastische Hauptlinie x schnelle stochas
Mit diesem Handelstool können Sie 15 Märkte gleichzeitig scannen. Einführung eines neuen Handelsindikators 2024: ️ Dashboard Multi-Währung Multi-Time-Frame Stochastic. Es gibt mindestens zwei Gründe, warum ich dieses Handelstool entwickelt habe: Erstens ist es mir langweilig, nur einen Markt zu beobachten. Zweitens möchte ich den Einstieg in einen anderen Markt nicht verpassen. Deshalb möchte ich gleichzeitig auch andere Marktbedingungen kennen. Aus diesem Grund benötige ich einen
Mit diesem Handelstool können Sie 15 Märkte gleichzeitig scannen. Wir stellen vor: der neue Handelsindikator 2024: ️ Dashboard, mehrere Währungen, mehrere Zeitrahmen, doppelter CCI. Es gibt mindestens zwei Gründe, warum ich dieses Handelstool erstellt habe: Erstens langweilt es mich, immer nur einen Markt zu beobachten. Zweitens möchte ich den Einstiegsmoment in einem anderen Markt nicht verlieren. Deshalb möchte ich gleichzeitig andere Marktbedingungen kennen. Aus diesem Grund brauche ich
Mit diesem Handelstool können Sie 15 Märkte gleichzeitig scannen. Einführung eines neuen Handelsindikators 2024: ️ Dashboard für mehrere Währungen und mehrere Zeitrahmen, doppelter RSI. Es gibt mindestens zwei Gründe, warum ich dieses Handelstool entwickelt habe: Erstens ist es mir langweilig, nur einen Markt zu beobachten. Zweitens möchte ich den Einstieg in einen anderen Markt nicht verpassen. Deshalb möchte ich gleichzeitig auch andere Marktbedingungen kennen. Aus diesem Grund b
Auswahl:
Keine Bewertungen
Antwort auf eine Rezension
Version 5.10 2024.09.20
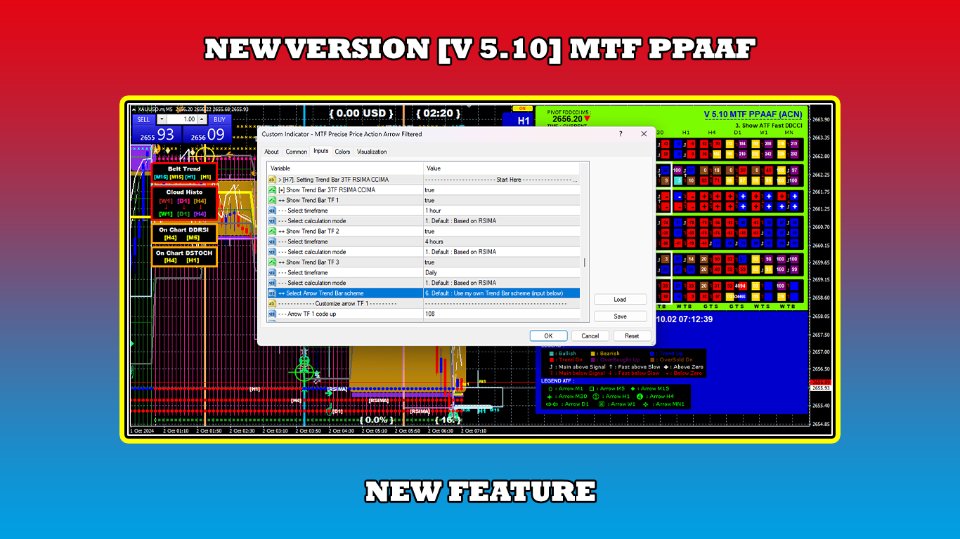
In this new Version V 5.10 :
- Adding Trend Bar 3TF RSIMA CCIMA arrows scheme
Version 5.0 2024.09.10
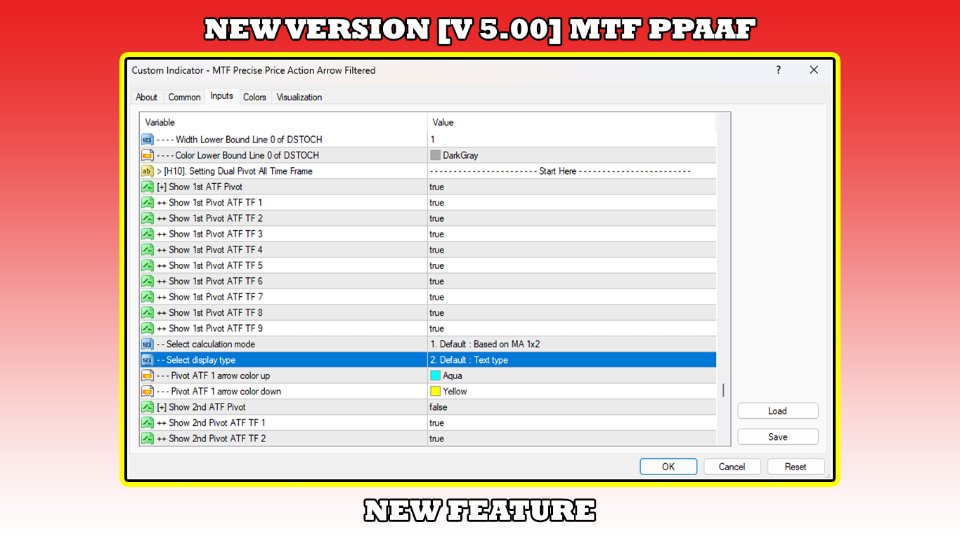
In this new Version V 5.00 :
- Replay system applicable to Dual Pivot ATF
- Adding display type to Dual Pivot ATF
Version 4.90 2024.08.26
In this new Version V 4.90 :
- Adding Dual Double CCI
- Adding DCCI calculation mode
Version 4.80 2024.08.13
In this new Version V 4.80 :
- Deconstruct from the beginning
- Adding CCIMA indicator
- Adding triple MTF cloud histo
- Adding triple MTF confluence multi mode
- Adding trend bar 3TF RSIMA/CCIMA
- Adding dual pivot all time frame
- Adding color level scheme
- Customizing on chart feature
- Optimizing the loading time
Version 4.70 2024.04.03
In this new Version V 4.70 :
- Fixing pivot value horizontal line trading in the zone
- Customizing Dual MTF Cloud Histo
Version 4.60 2024.03.29
In this new Version V 4.60 :
- Changing MTF Belt Trend to Dual MTF Belt Trend
- Adding trend following feature to MTF Belt Trend
- Adding time frame scheme True RSIMA
- Customizing On Chart Dual DRSI
- Customizing On Chart Dual Stochastic
- Customizing On Chart True RSIMA
Version 4.50 2024.03.18
In this new Version V 4.50 :

- Deleting Super Trend Arrows (only dashboard available with lines and trend bar) to optimize the rendering time
- Deleting Trend Bar 3TF of SRCM (Stoch,RSI,CCI,MACD)
- Deleting Trend Bar 3TF of MA5 x MA6
- Deleting confluence 3TF of Stochastic
- Deleting confluence 3TF of MACD
- Deleting confluence 3TF of MA1 x MA2
- Deleting confluence 3TF of DRSI
- Deleting confluence Dual Stoch
- Deleting confluence Dual MACD
- Adding MTF Belt Trend
- Adding Dual MTF Cloud Histo
- Adding 3TF True RSIMA lines
- Adding 3TF True RSIMA trend bar
- Adding 3TF True RSIMA dashboard
- Adding horizontal line trading in the zone
- Adding pivot value horizontal line trading in the zone
- Fixing vertical lines trading in the zone
- Total mode right now is 13 (previously 9)
Version 4.40 2024.02.02
In this new Version V 4.40 :
- Adding trend bar feature of True RSIMA
- Adding dashboard feature of True RSIMA
- Adding vertical lines feature of trading in the zone
- Adding current time and broker time feature
- Modifying trend bar 3 time frame
- Fixing dashboard monitor position
- Fixing price index location
Version 4.30 2024.01.25
In this new Version V 4.30 :
- Fixing histogram of MTF Belt Trend
Version 4.20 2024.01.25
In this new Version V 4.20 :
- Fixing OBOS level of ATF dashboard
- Adding calculation mode of TB TRD FOL 3TF, i.e DCCI and FDMACD
- Adding histogram to MTF belt trend
Version 4.10 2024.01.10
In this new Version V 4.10 :
- Fixing ATF Stochastic and ATF MACD
- Fixing algorithm of confluence 3TF
- Fixing algorithm of STF Dual Stochastic and Dual MACD
Version 4.0 2024.01.03
In this new Version 4.00 :
- Adding background color to trend bar 3TF
- Adding Mode 8 : Show ATF MA 1x2 DRSI
- Adding timeframe scheme of trading in the zone
- Adding timeframe scheme of trend following STF
- Adding timeframe scheme of trend bar trend following 3TF
- Fixing dashboard of RSIMA
Version 3.90 2023.12.22
In this new Version 3.90 :
- Deleting favorite arrows
- Adding MTF Trendbar Trend Following 3 Time Frame FDSTOCH/DRSI
- Adding MTF Trendbar Average 3 Time Frame FDSTOCH/DRSI
- Adding MTF Trendbar Trend Following 3 Time Frame MA5 x MA6
- Adding MTF Trendbar Average 3 Time Frame MA5 x MA6
- Fixing status quo of trading in the zone
Version 3.80 2023.11.20
In this new version V 3.80 :
- I fixed the 1 minute RSIMA dashboard
- I limited the number of favorite arrow mode to three
Version 3.70 2023.11.16
In this new version V 3.70 :
- I fixed the RSIMA dashboard
- I added favorite arrow calculation modes
Version 3.60 2023.11.13
In this new version V 3.60 :
- I added favorite arrow feature
- I set up trading in the zone interface
- I added W1 timeframe scheme for trend following STF arrows
Version 3.50 2023.11.06
In this new version V 3.50 :
- I changed the symbol for MACD above zero and MACD below zero level.
- I changed the code of square STF trend following.
Version 3.40 2023.10.30
In this new Version 3.40 :
- I limited the number of candle high time frame
- I added arrow size option to trend following STF arrows
Version 3.30 2023.10.25
In this new Version 3.30 :
- I fixed the on off button sound
- I added trend bar 9TF of STA mode 2 from current time frame (0) to previous 5 bar ago (5)
- I fixed on chart dual stochastic channel
- I fixed dashboard position
- I modified algorithm in STA mode 1 & mode 2
- I added time frame scheme for trend following STF
Version 3.20 2023.10.19
In this new Version 3.20 :
- I changed the dashboard font so it looks clear
Version 3.10 2023.09.25
In this new Version 3.10 :
- Reduce total mode to only 8, i.e show all time frame crossover arrows and trading in the zone
- Modifying parameter setting
- Can show all time frame crossover arrows of fast CCI and slow CCI, i.e DCCI
- Modify the status for mode 8
- Can show trend following selected time frame of fast stochastic, RSI 1x2, CCI 1x2, fast macd and RSIxMA outside the modes.
Version 3.0 2023.09.06
In this new Version 3.00 :
- Modifying STA algorithm both for calculation mode 1 and mode 2
- Modifying dashboard color scheme
- Modifying parameter setting
Version 2.90 2023.09.04
In this new Version 2.90, I added new features :
- Adding Mode 29 : Show ATF Fast Stoch DRSI. With this feature monitoring all time frame arrows of stochastic and RSI is easy.
- Adding STA Calculation Mode. The first mode is based on crossover of RSI & MA and the second mode is based on crossover of fast RSI & slow RSI.
Version 2.80 2023.08.30
In this new Version 2.80, I added new feature :
- Adding Time Spread Profit Info (TSPI) indicator
Version 2.70 2023.08.21
In this new Version 2.70, I make monitoring visually Stoch RSI easy :
- Modifying on chart dual stochastic
- Modifying on chart double rsi
- Modifying on chart rsioma
- Modifying color level
Version 2.60 2023.08.13
In this new Version 2.60, I added new feature :
- Adding STF belt trend
- Fixing on chart range
- Changing arrow code DRSI and DCCI
Version 2.50 2023.07.31
In this new Version 2.50, I added new feature :
- Adding confluence of 3TF MA 1x2
- Changing arrow code for trend following double CCI
- Changing arrow code for trend following double RSI
Version 2.40 2023.07.25
In this new Version 2.40, I added new features :
- Adding confluence of 3TF Fast DSTOCH
- adding confluence of 3TF Fast DMACD
- Adding trend following STF of DRSI
- Adding STA monitor, i.e (from top to bottom) H1,H4,D1,W1,MN1
Version 2.30 2023.07.18
In this new Version 2.30, I added new features :
- Added mode 28 : show trading in the zone
- Added 9TF double CCI dashboard monitor
- Added selected timeframe of double CCI crossover arrows
- Added STA monthly arrows
- Added three new dashboard color scheme
- Fixing STA, dual stochastic & dual MACD algorithm
Version 2.20 2023.07.11
In this new Version 2.20, I added new features :
- Added upper bound 100 & lower bound 0 for on chart dual stochastic
- Added upper bound 100 & lower bound 0 for on chart double rsi
- Fixing trading in the zone four MA
- Added timeframe scheme for four MA
- Fixing RSIMA dashboard
Version 2.10 2023.07.04
In this new Version 2.10 :
- Fixing DRSI arrow TF MN1
- Fixing color super trend arrows
- Fixing arrow MA 3 x MA 4
- Added timeframe scheme D1,W1,MN1 for conflux DRSI
Version 2.0 2023.07.03
In this new Version 2.00, I added new features :
- Added confluence arrows of 3 timeframe double RSI
- Added 12 timeframe scheme to choose from for confluence of double RSI
- Fixing algorithm for trend following dual stoch and dual macd
Version 1.90 2023.06.26
In this new Version 1.90, I added new features :
- Added super trend arrows higher timeframe
- Added MACD above or below zero level into dashboard
- Fixing MTF feature
Version 1.80 2023.06.20
In this new Version 1.80, I've made a lot of changes :
- Change the appearance of the dashboard from a circle to a square shape.
- Fixing color OBOS of slow stochastic and slow drsi.
- Added feature on chart slow stochastic.
- Added feature pivot value of all time frame of Fast Stoch.
- Added feature pivot value of all time frame of Fast MACD.
- Added feature pivot value of all time frame of MA 1,2.
- Added feature pivot value of all time frame of Double RSI.
- Added feature pivot value of all time frame of RSIMA.
- Added feature MTF candle high time frame.
- Ability to change/shift the starting time to monitor in real time 9TF dashboard.
Version 1.70 2023.06.02
In this new Version 1.70, I've added the ability to monitor visually :
- On chart stochastic makes it easy for us to observe the movement of stochastic main line and stochastic signal line along the OBOS channel.
- On chart four MA makes it easy for us to observe the movement of MA 1 cross MA 2 and MA 3 cross MA 4.
- On chart double RSI makes it easy for us to observe the movement of RSI fast line and RSI slow line along the OBOS channel.
- On chart true RSIMA makes it easy for us to observe the movement of RSI line and MA line along the OBOS channel.
This on chart double RSI or on chart true RSIMA will make monitoring RSI divergence much more accurate than installing RSIMA on sub window.
And also I changed the appearance of the 10 dashboard color scheme to be more attractive.
Version 1.60 2023.05.23
In this new Version 1.60, I've made trading in the zone much more easy :
- Added four MA dashboard monitor (not just two MA!)
- Added four MA lines on chart (by default : MA 1x2 on current timeframe and MA 3x4 on M30)
- Customizable four MA lines
- Button can be located on sub window
Version 1.50 2023.05.03
In this new Version 1.50, I've made a lot of reconstruction :
- Total mode up to 27
- New feature : Show Trend Following ATF TWOMA Filtered By Trend Following Selected TF of FAST STOCH
- New feature : Show Trend Following ATF TWOMA Filtered By Trend Following Selected TF of FAST MACD
- New feature : Show Trend Following ATF TWOMA Filtered By Trend Following Selected TF of DRSI
- New feature : Show Trend Following ATF TWOMA Filtered By Trend Following Selected TF of RSIMA
- Trend following = non repaint arrows!
- Fixing algorithm of button
- Adding color level type
Version 1.40 2023.04.11
In this new Version 1.40, I've made a lot of reconstruction :
- Total mode up to 23
- New feature : Show Trend Following All Timeframe of Two MA
- New feature : Show Trend Following All Timeframe of Double RSI
- New feature : Show Trend Following All Timeframe of RSIMA
- New feature : Show Trend Following Selected Timeframe of Two MA
- New feature : Show Trend Following Selected Timeframe of Double RSI
- New feature : Show Trend Following Selected Timeframe of RSIMA
- New feature : Show Trend Following Selected Timeframe of Dual Stoch
- New feature : Show Trend Following Selected Timeframe of Dual MACD
- Trend following = non repaint arrows!
- Fixing algorithm of mode 21 : Show Selected TF of STOCH,MACD,TWOMA,DRSI Filtered By Trend Following RSIMA
- Parameter values can be hide/show
Version 1.30 2023.03.30
In this new Version 1.30, I've made a lot of reconstruction :
- Added dual stochastics dashboard monitor (fast stoch = stochastic 1 and slow stoch = stochastic 2)
- Added dual macd dashboard monitor (fast macd = macd 1 and slow macd = macd 2)
- Fixing MA Phase of RSIMA
- Change arrow code
- New feature : showing trend following arrows of stochastics and macd
- Dashboard monitor can be hide
Version 1.20 2023.03.12
In this new Version 1.20, I've made a lot of reconstruction :
- Fixing daily arrow of MACD
- Fixing arrow of RSIMA
- New algo in determining the up and down arrows
- New feature : showing arrows of Stochastic, MACD, Two MA and RSIMA at once
- Adding the RSIMA 9TF dashboard monitor
- Beautify the dashboard monitor
Version 1.10 2023.02.27
New version 1.10 with new feature available:
- Adding the ability to filter price action by all time frame (ATF) Two Moving Average
- Adding the ability to filter price action by all time frame (ATF) Double RSI
- Adding the value of Stochastic on all time frame
- Adding the value of CCI on all time frame