• Genel bakış
  • İncelemeler
  • Yorumlar
  • Yenilikler

MTF Precise Price Action Arrow Filtered

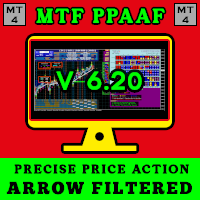
Yalnızca tek bir gösterge kullandığınız için sık sık işlem kaybediyorsanız bu işlem aracını deneyin. Bu ticaret aracı birden fazla gösterge kullanır. Yalnızca RSI göstergesini kullanan tüccarları sıklıkla gözlemliyorum. Çoğu zaman piyasa aşırı satıştadır ancak hala aşağıdadır veya piyasa aşırı alımdadır ancak hala yüksektir. Bu nedenle birden fazla gösterge kullanmanız gerekir. Yeni sürüm V 3.40 MTF PPAAF ile tanışın: Çoklu Zaman Çerçevesi Hassas Fiyat Eylem Oku Filtrelendi. Bu ticaret aracı, piyasa hareketinin yönünü güçlendirmek için çeşitli göstergeler kullanır.

Bu ticaret aracında kullanılan ilk gösterge Dual Stokastik'tir. Burada Hızlı Stokastik ve Yavaş Stokastik olmak üzere iki Stokastik kullanıyorum. Hızlı Stokastik'te Hızlı Stokastik bir ana hat ve Hızlı Stokastik sinyal hattı vardır. Aynı şekilde Slow Stochastic'te de Slow Stochastic ana hattı ve Slow Stochastic sinyal hattı bulunmaktadır. Ana hat ile sinyal hattının kesişimi/geçişi yukarı ve aşağı okları oluşturacaktır.

İkinci gösterge Çift RSI'dir, yani hızlı RSI ve yavaş RSI. İkisinin kesişimi yukarı ve aşağı bir ok oluşturacaktır.

Üçüncü gösterge Çift CCI, yani hızlı CCI ve yavaş CCI'dır. İkisinin kesişimi yukarı ve aşağı bir ok oluşturacaktır.

Dördüncü gösterge Çift MACD'dir. Çift Stokastik'e benzer şekilde burada Hızlı MACD ve Yavaş MACD var. Fast MACD'de bir Hızlı MACD ana hattı ve bir Hızlı MACD sinyal hattı bulunmaktadır. Aynı şekilde Yavaş MACD'de de Yavaş MACD ana hattı ve Yavaş MACD sinyal hattı bulunmaktadır. Ana hat ile sinyal hattının kesişimi yukarı ve aşağı okları oluşturacaktır.

Beşinci gösterge RSIMA'dır. Adından da anlaşılacağı gibi burada yukarı ve aşağı oklar, RSI çizgisinin hareketli ortalama (MA) çizgisiyle kesişmesiyle belirlenir. RSI > MA ise ok yukarıdır ve bunun tersi de geçerlidir.

Altıncı gösterge Dört MA'dır. Burada MA 1,2,3,4 olmak üzere dört hareketli ortalama çizgisi kullanıyorum. MA 1 çizgisinin MA 2 ile ve MA 3 çizgisinin MA 4 ile kesişimi yukarı ve aşağı okları oluşturacaktır.

Araştırmamın sonuçlarına göre birçok yatırımcı yalnızca tek bir gösterge kullandığı için kaybediyor. Bu yüzden bu ticaret aracını yarattım. Yukarıda anlattığım altı gösterge piyasa hareketinin yönünü güçlendirecektir.

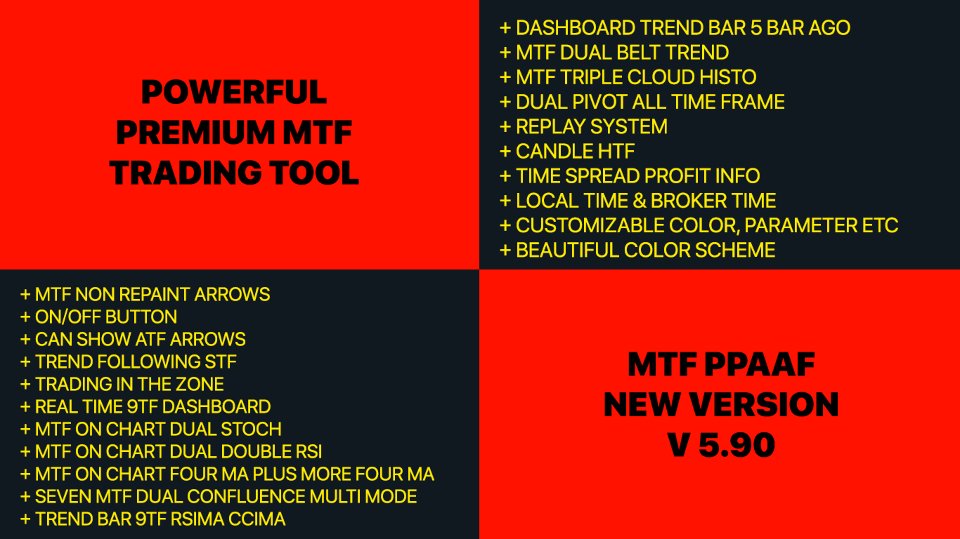
Daha sonra piyasa hareketlerini gerçek zamanlı olarak görmek için çeşitli EN İYİ özellikleri ekledim:

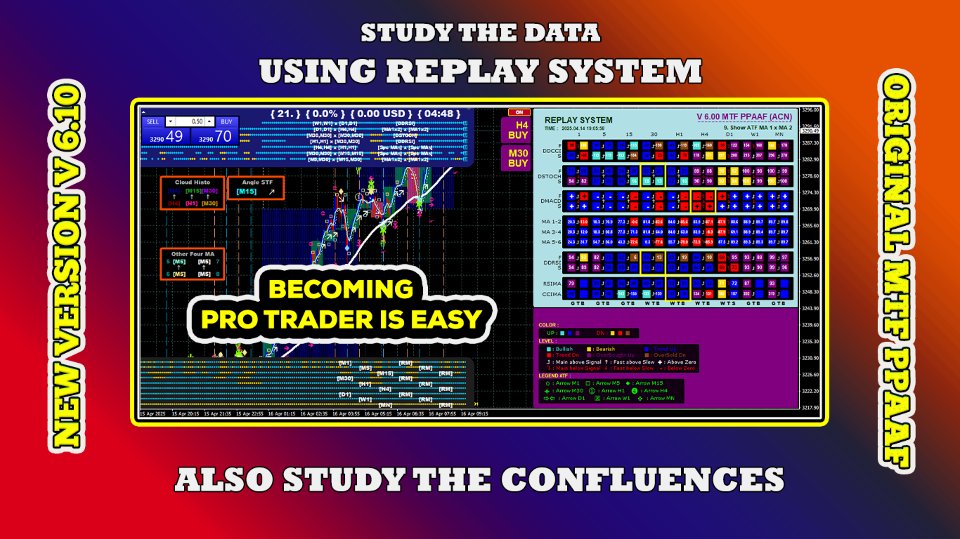
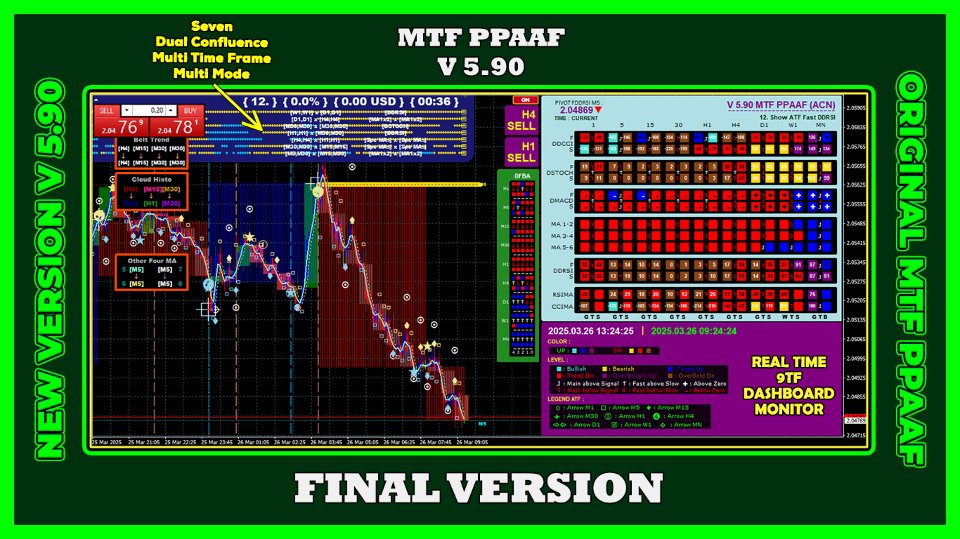
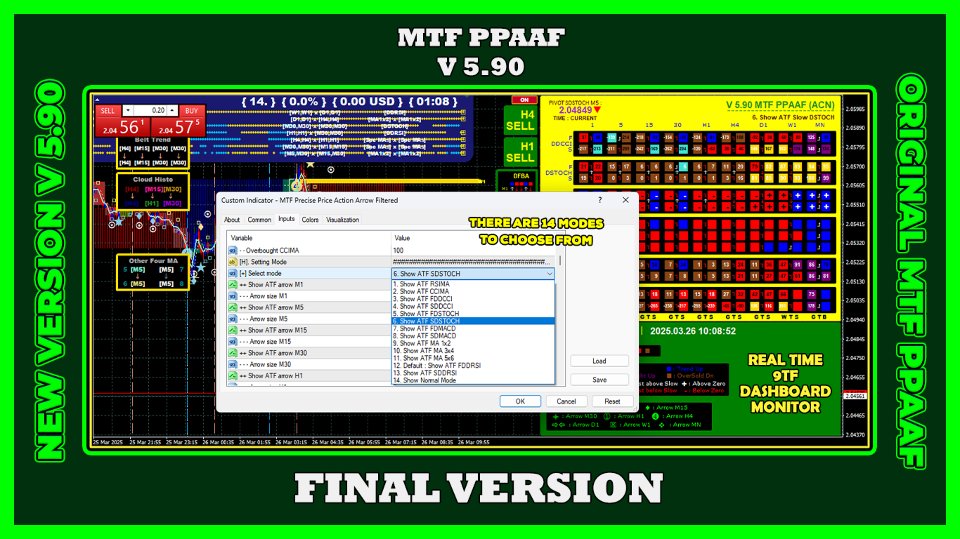
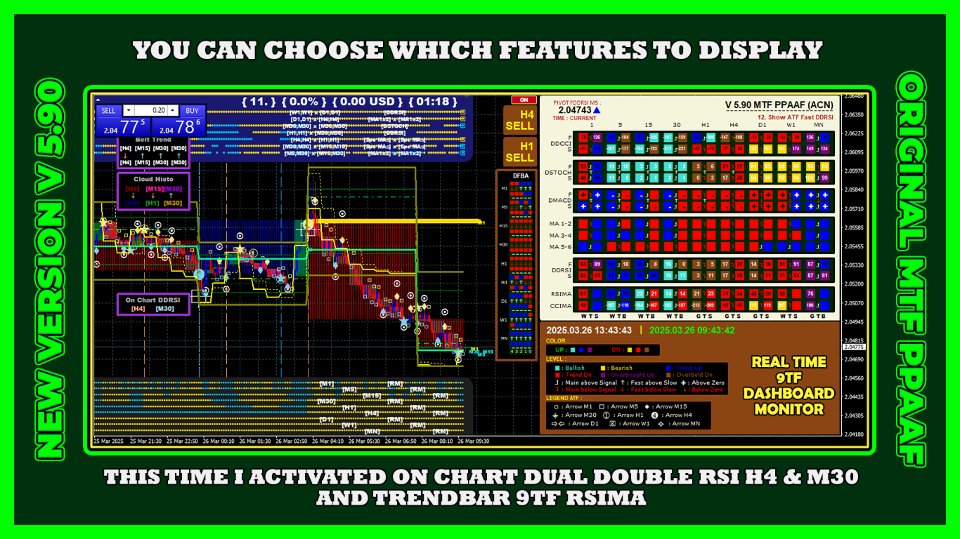
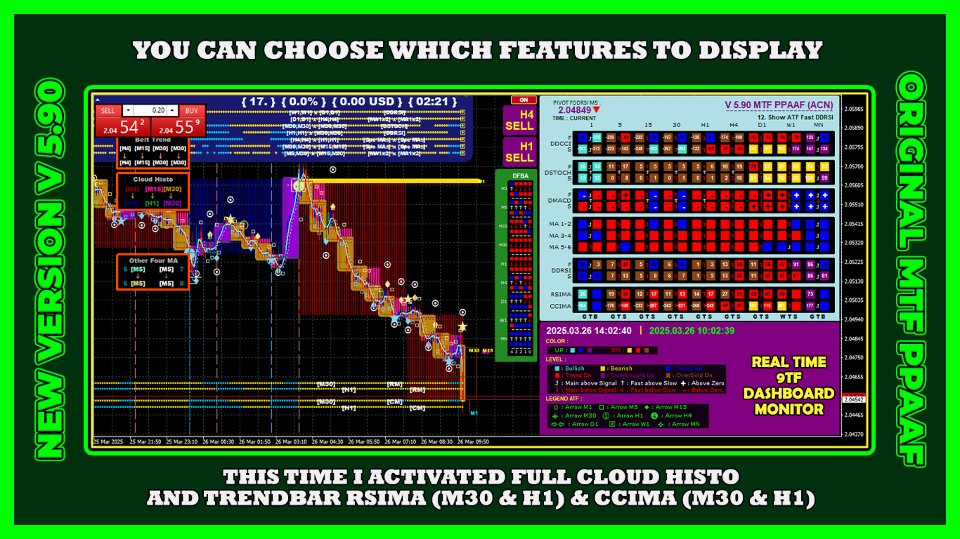
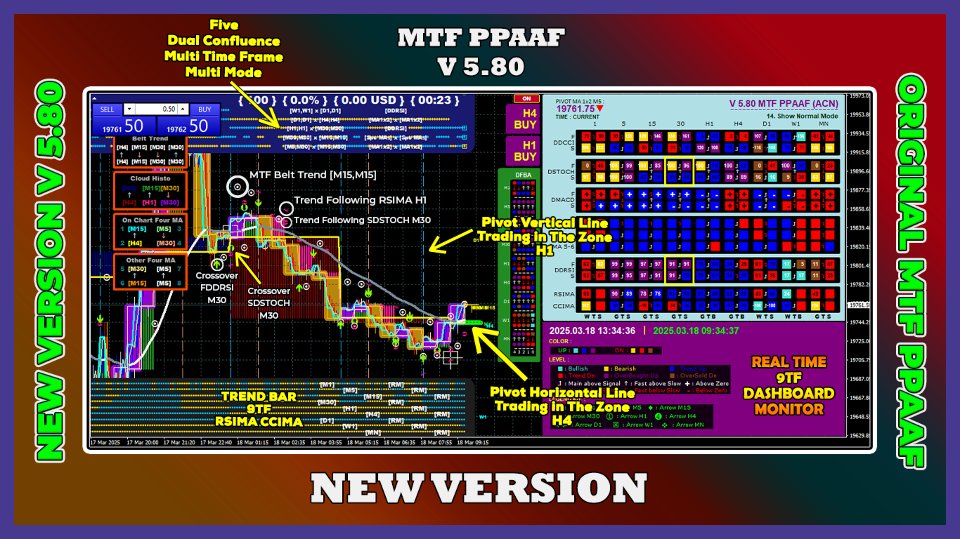
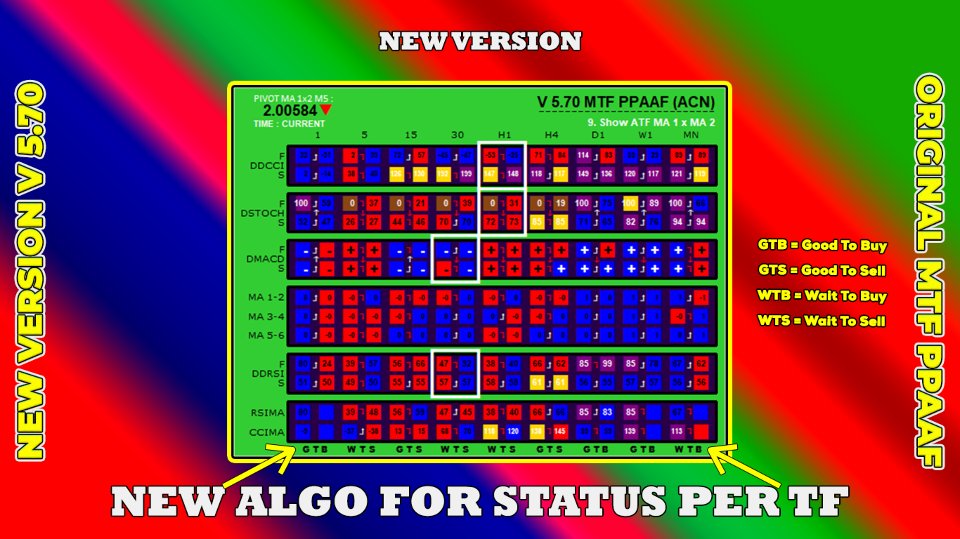
1. Gerçek zamanlı 9TF gösterge paneli monitörü. Bu özellik sayesinde 1 dakikalık zaman diliminden başlayarak MN1 zaman dilimine kadar piyasa hareketlerini gerçek zamanlı olarak göreceksiniz. Kontrol panelinde ana hattın sinyal hattından büyük olup olmadığını, hızlı RSI hattının yavaş RSI hattından büyük olup olmadığını, RSI hattının tamamen açık olup olmadığını vb. görebileceksiniz. Stokastik, RSI ve CCI seviyelerinin aşırı alım veya aşırı satım olup olmadığını da görebilirsiniz. OBOS (aşırı alım aşırı satım) seviyesini bilmek çok önemlidir.

2. Grafik özelliklerinde. Görsel olarak izlemek önemlidir. Bu sebeple On Chart Dual Stochastic, On Chart Four MA, On Chart Double RSI ve On Chart True RSIMA özelliklerini ekledim. Bilginiz olsun diye söylüyorum, stokastikleri grafik penceresine yerleştirmek, stokastikleri alt pencereye yerleştirmekten daha doğrudur. Harita penceresinde ana hat ile sinyal hattının kesişimini gerçek zamanlı olarak gözlemlemek, giriş ve çıkış noktalarını belirleme konusunda kendinize güvenmenizi sağlayacaktır. Prensibim düşükten al yüksekten satmaktır. Lütfen bu prensibi unutmayın.

3. Bu ticaret aracı ATF (tüm zaman dilimi) geçiş oklarını görüntüleyebilir:

- ATF Hızlı stokastik (mod 1), yani Hızlı stokastik ana hattı x Hızlı stokastik sinyal hattını göster

- ATF Hızlı MACD'yi (mod 2), yani Hızlı MACD ana hattı x Hızlı MACD sinyal hattını göster

- ATF MA 1x2'yi (mod 3) göster, yani hareketli ortalama 1 x hareketli ortalama 2

- ATF DRSI'yi (mod 4), yani Hızlı RSI x Yavaş RSI'yi göster

- ATF RSIMA'yı (mod 5), yani RSI x MA'yı göster

- ATF DCCI'yi (mod 6) göster, yani Hızlı CCI x Yavaş CCI

- ATF Hızlı stokastik DRSI'yi (mod 7), yani Hızlı stokastik ana hat x Hızlı stokastik sinyal hattını Hızlı RSI x Yavaş RSI ile birlikte gösterin

- Bölgede ticaret (mod 8), yani MA 1 hattının MA 2 ile ve MA 3 hattının MA 4 ile kesişimi.

4. Süper Trend Okları (STA). İki STA hesaplama modu vardır. Birincisi, RSI ve MA'nın çaprazlamasına dayanan STA'dır. İkincisi ise Hızlı RSI'nın Yavaş RSI ile geçişidir.

5. Trend Takip STF (seçilen zaman dilimi). Burada isteklerinize göre zaman dilimini seçebilirsiniz. İki çizgi birbirini keserse bir ok belirir. Ayrıca, iki çizginin açılarının tamamı pozitif (YUKARI) veya tamamı negatif (Aşağı) ise trend takip oku görünecektir.

6. STA modunu temel alan 9TF Trend Çubuğu özelliği 2. Gözlemleyebileceğiniz beş trend çubuğu vardır.

En sağdaki trend çubuğu, en son gerçek zamanlı trend çubuğudur (0). Bunu önceki trend çubuğu (1,2,3,4) takip eder. Bu trend çubuğu, önceki zaman diliminden mevcut zaman dilimine kadar piyasa trendlerinin yönündeki değişiklikleri gözlemlemek için kullanışlıdır.

7. Pivot seviyeleri özelliği. Bu özellik size geçişin gerçekleştiği açık mum noktası seviyesini gösterecektir. Pivot seviyeleri ac

S&R, yani Destek ve Direnç gibi.


8. Tekrar Sistemi. Bu özellik sayesinde, belirli bir gün ve saatte 9TF kontrol panelinin durumunu gözlemleyerek zamanda geriye gidebilirsiniz. Diyelim ki piyasanın 11.10.2023 14:21:30'da neden satış yaptığını analiz etmek istiyorsunuz. Bu özelliği kullanmak için Meta Trader 4 grafiğinizi daha düşük bir zaman diliminde, örneğin M5'te açın.


9. Mum HTF (Yüksek Zaman Çerçevesi). Bu özellik sayesinde grafiği daha düşük zaman diliminde açtığınızda (ben M5'te açmayı seviyorum) yüksek zaman dilimindeki (örneğin H1) piyasa hareketlerini görebilirsiniz.


10. TSPI (Zaman Yayılımı Kâr Bilgisi). Bu özellik sayesinde anlık zamanı, spreadi, kar/zararı ve kar/zarar yüzdesini gerçek zamanlı olarak görebilirsiniz.


11. Açma/kapama butonu özelliği. Bu özellik sayesinde, bu ticaret aracını tek tıklamayla gösterebilir veya gizleyebilirsiniz. İlginç değil mi?


12. Aralarından seçim yapabileceğiniz 20 gösterge paneli renk şeması. Bu özellik sayesinde grafiğinizin rengiyle eşleşen bir gösterge tablosu rengi seçebilirsiniz.


13. Özelleştirilebilir parametre. Göstergelerin hesaplanmasında kullanılan tüm parametreler isteğinize göre ayarlanabilir. Stokastik parametreler 14,3,3 veya 5,3,3 vb.'yi kullanabilirsiniz. Ya da varsayılan ayarları kullanabilirsiniz.


14. MTF, yani Çoklu Zaman Çerçevesi. İsteğinize göre bir zaman dilimi belirleyebilirsiniz. Örneğin, M5 ve H1 zaman dilimlerinde grafik üzerinde ikili stokastik özelliğini etkinleştirmek istiyorsunuz. Yapabilirsiniz!


15. Yeniden Boyanmayan Oklar (NRPA). İki çizgi herhangi bir zamanda kesişirse çapraz ok görünecektir. Çoğu zaman, yüksek oynaklık nedeniyle, takip eden saniye ve dakikalarda iki çizgi kesişmez. Sonuç olarak, daha önce ortaya çıkan ok daha sonra ortadan kayboldu. Bu çok önemli bir özelliktir. Yüksek volatilite sırasında daha önce yukarı olan okun aşağı dönüşebileceğini unutmayın. Daha önce ortaya çıkan ok bir anda kaybolabilir. Bu yüzden mesajım, gerçek zamanlı 9TF kontrol paneli monitörünü kullanarak doğrulama yapmaktır!


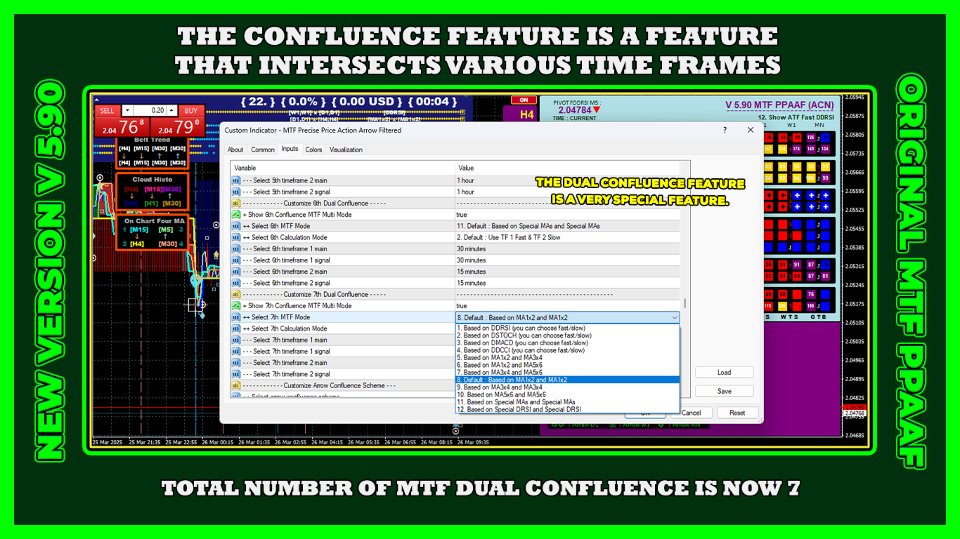
16. Confluence 3TF özelliği, yani 3TF Fast Stokastik izdiham, 3TF Hızlı MACD izdiham, 3TF MA 1x2 izdiham ve 3TF DRSI izdiham. Bu özelliği ile 3TF (üç zaman dilimi) kesişimlerini gözlemlemek çok kolaydır. Bu, örneğin, zaman çerçevesindeki (M5, M15, M30) hızlı stokastik ana çizgi > hızlı stokastik sinyal çizgisi ise bir YUKARI okunun görüneceği anlamına gelir.


17. Birleşik ikili Stokastik ve birleşik ikili MACD. Bu özellik sayesinde hızlı stokastikte ve yavaş stokastikte ana hat > sinyal çizgisi varsa YUKARI oku görünür. Aynı şekilde çift MACD için de. Bu, aynı zaman diliminde iki stokastik ve iki MACD'nin kesişimini gözlemlemek için gerçekten önemli bir özelliktir.


18. Trend kemeri özelliği. Bu özellik, grafikte iki hareketli ortalamanın görüntülenmesine ek olarak sunulmaktadır. Elbette isteğinize göre bir zaman dilimi belirleyebilirsiniz.


Yalnızca bir ticaret göstergesinin kullanılması pek ikna edici değildir. Bu nedenle piyasanın yönüne ilişkin analizimizi güçlendirmek için çeşitli göstergeleri birleştiriyoruz.


Fiyat hareketi hareketi daha sonra 6 göstergeden herhangi biri kullanılarak filtrelenebilir:


RSİYOMA

Çift MACD (Yeni sürüm 1.3!)

Çift Stokastik (Yeni sürüm 1.3!)

Çift CCI (Yeni sürüm 2.3!)

Dört Hareketli Ortalama (Yeni versiyon 1.6! Sadece iki ma değil)

Çift RSI (Yeni sürüm 1.2!)

Fiyat eylemi hareketinin yönünün gücü, gerçek zamanlı 9TF kontrol panelinin izlenmesiyle sonuçlandırılabilir.


9TF gösterge paneli monitörü bize Dört Hareketli Ortalama, RSIMA, Çift RSI, Çift MACD, Çift Stokastik ve Çift CCI'nın gerçek zamanlı verilerini gösterir.


Göstergeyi göstermek veya gizlemek için tek tıklama düğmesi

9TF gerçek zamanlı gösterge paneli monitörü

9TF Dört Hareketli Ortalamanın İzlenmesi, yani MA 1x2 ve MA 3x4

Hızlı MA hattının yavaş MA hattının üstünde mi yoksa altında mı olduğunun izlenmesi

Hızlı MA ve yavaş MA açısının izlenmesi

9TF Çift RSI'nin (Hızlı RSI ve Yavaş RSI) İzlenmesi

Hızlı RSI çizgisinin yavaş RSI çizgisinin üstünde mi altında mı olduğunu izleme

9TF Çift MACD'nin izlenmesi, yani Hızlı MACD'nin (MACD 1) Yavaş MACD'nin (MACD 2) üstünde veya altında olması ve yukarı veya aşağı olması

Ana MACD çizgisinin sinyal MACD çizgisinin üstünde mi yoksa altında mı olduğunun izlenmesi

9TF İkili Stokastik, yani Hızlı Stokastiklerin (Stokastik 1) Yavaş Stokastiklerin (Stokastik 2) üstünde veya altında ve yukarı veya aşağı olduğunu izleme

Ana Stokastik çizginin Stokastik çizginin üstünde mi yoksa altında mı sinyal verdiğini izleme

9TF Double CCI'nın izlenmesi, yani OBOS hattındaki konum ve mevcut hareket

9TF RSIOMA'nın izlenmesi, yani MA çizgisinin üstünde veya altında RSI çizgisi

Parametreyi ayarlayabilme ve zaman dilimini dilediğiniz gibi seçebilme

Efsaneyi gösterme/gizleme yeteneği

Çubuk sayısını artırma/azaltma yeteneği, varsayılan değer 800 bardır

20'ye kadar kontrol paneli renk şeması seçebilme yeteneği

Bu gösterge seçtiğiniz zaman dilimi için RSIMA okunu görüntüleyebilir

Bu gösterge seçtiğiniz zaman dilimi için MACD okunu görüntüleyebilir

Bu gösterge seçtiğiniz zaman dilimi için Stokastik okunu görüntüleyebilir

Bu gösterge, seçtiğiniz zaman dilimi için MA 1x2 ve MA 3x4 okunu görüntüleyebilir

Bu gösterge seçtiğiniz zaman dilimi için Çift RSI okunu görüntüleyebilir

Bu gösterge seçtiğiniz zaman dilimi için Çift CCI okunu görüntüleyebilir

Yeniden boyanmayan ok
Önerilen ürünler
ROC acceleration-deceleration is the manual system for medium-term scalping. Indicator based on custom ROC system which defines bullish/bearish market and especially  acceleration-deceleration of tendention in the market's main direction. Buy arrow is plotted during bearish market when current trend decelerates and sell  arrow is plotted during bullish market when current trend decelerates. Main Indicator's Features Signals are not repaint,non-late or disappear(exept cases when system recalculat
Check out my youtube channel about forex trading robots:  https://www.youtube.com/channel/UCL_p6fuQtNkg-1rRY69t5Ig Message me on telegram if you have any questions:  https://t.me/BRobotTrader H1 TIMEFRAME Updates and improvements(2021.08.12): USE THE SET FILES FROM THE COMMENT SECTION! This is the biggest update in the life of the KILIMANJARO EA, it got new features and NEW engine, plus many new parameters to optimize and play around with. ---It got the official TheNomadTrader Dynamic e
Trend New
Vitalii Zakharuk
Trend New Trend Indicator, shows the signals for entry. Displays both entry points and the trend itself. Shows statistically calculated moments for entering the market with arrows. When using the indicator, it is possible to optimally distribute the risk factor. Settings: Uses all one parameter for settings. Selecting a parameter, it is necessary to visually resemble it so that the appropriate graph has a projection of extremes. Options: Length - the number of bars for calculating the indica
Mongol Indicator2
Sumiyabazar Buyanjargal
It's a variation of mid of HH and LL since it compares the higher of HH or LL against a period and twice the number of bars back to avoid whipsaws. I used to display this against lines on a chart, but made a histogram out of it and it looks interesting. It looks good at gauging trend strength and general turns (see image below). The name of the indicator is BAM, which is an acronym for "Below and Above Mid". Ways to use it: 1. To see general trend on longer TFs (more than 30 bars back).
PTW NON REPAINT TRADING SYSTEM + HISTOGRAM Non-Repainting ,   Non-Redrawing   and   Non-Lagging  Trading System. Does the following: - Gives Accurate Entry and Exit Points - Scalping, Day and Swing Trading  - 95% Accuracy  - Targets, where to take profits. - Shows Trends, Support and resistance levels - Works on All Brokers - Works on All Currencies, CFDs and Stocks - It does not place trades for you, it only shows you what trades to place. - It works on All Timeframes - It is for Trend or ran
Demand And Supply
Khurram Mustafa
1 (1)
Function Indicate Buy Sell Signals Indicate Strength of Buy Sell Signals This system is for both type of traders (Short & Long Term) Instead of Other Calculations, Parabolic Sar & Awesome are also used In Any time frame this can be use. What is in for Trader? Trading Switch:  Short Term & Long Term Finally, we all knows that Forex Trading needs completely concentrate & proper cash management, So I never promising that my program will never give you loss but I tried well to provide good and respo
FREE
This system never paints.   This system created by using Envolpes bands and reverse bar count.   This indicator is only working in M5 period.   This system is for long term and profitable.   Signals are shown as arrows. as an optional limit orders.   You can set a voice alarm or email notification.   You can fins our other products from link : https://www.mql5.com/en/users/drbastem/seller   Also, you can ask all your questins from email : haskayafx@gmail.com or mobile : +90 530 867 5076 or @Meh
Built for maximum performance. Optimized for profit withdrawals. Introducing a new option - testing with emulation of profit withdrawals. Ultimate Hero is an advanced trading tool designed to maximize your forex profits. This advanced trading software is created using the latest GPT-4 technology and has a wide range of advanced features. Ultimate Hero is a trading bot that uses a grid trading strategy based on the Martingale system. It is designed to provide stable returns by placing multiple t
Using multiple timeframes for analysis with Multi Timeframe Average Directional Index  can provide several significant benefits for traders: Comprehensive Market View: By applying Mtf ADX Standard across different timeframes, traders gain a broader perspective on market dynamics. This allows them to identify trends, patterns, and potential reversal points that might be more apparent or consistent across various scales. Enhanced Pattern Recognition: Multiple timeframes help in identifying repeati
FREE
Primus Trading Engine is a trading system that combines price action,ratio based indicators & custom indicators to create this leading indicator with a multi-timeframe approach to give you high probability trade setups for forex,CFD cash/futures,metals & binary option to assist in making predictions on what is MOST likely to happen in the market Main Chart Features Price Action Signal-Arrow displayed on a specific bar;NOT buy/sell arrow;DOES NOT repaint;Bullish arrow on a bullish bar,price is l
Valentines
Victor Golovkov
Valentines trend is an easy-to-use indicator that hides a powerful calculation math-system "under the hood". Attach the indicator to the chart and set the parameters. Period - period for tracking changes in quotes Amount of Bars - number of last bars to track You do not need to select any numerical parameters. The indicator will do everything for you automatically . Each signal is generated on the current bar, and in order not to miss it, use the built-in alerts and notifications system . The in
This trading expert advisors is an clone & upgrade of  "EA Rough Duster ", also trades best on GBPNZD minute 5 timeframe. Maintains a constant account growth and runs best on low spread and commission based accounts. Uses Martingale & perfect hedging to recover unprofitable positions ensuring no loss. Its consistent profit curves,low DrawDowns & risk proves the record for itself in reliability and consistency plus its unique market analysis ensures quick extraction of profits by scalping the mar
The AlgoKing Lightning Bolt Strategy is a trade manager and has multiple indicators built for a complete trading strategy.  Here is a list of indicators built in. Indicators Auto drawn Support and Resistance signals Auto drawn RSI Divergence signals Auto drawn Fibonacci Retracement signals with buy and sell entry lines. Lightning Bolt reversal signals. Auto drawn trend lines. Trade Management Auto take partials at simple moving average targets. Auto take partial and stop losses at Fibonacci ret
Bu işlem aracıyla aynı anda 15 piyasayı tarayabilirsiniz. Karşınızda yeni ticaret göstergesi 2024: ️ Kontrol Paneli Çoklu Para Birimi Çoklu Zaman Çerçevesi Stokastik. Bu ticaret aracını oluşturmamın en az iki nedeni var: Öncelikle tek piyasayı gözlemlemekten sıkıldım. İkincisi, başka bir pazara giriş anını kaybetmek istemiyorum. Bu yüzden aynı zamanda diğer piyasa koşullarını da bilmek istiyorum. Bu nedenle birden fazla piyasanın koşullarını aynı anda tarayabilecek bir tarayıcıya ihtiyac
Reversal Overlap Bot is an automated trading strategy. No technical indicators are used in the work. At the beginning of trading, the first order is placed in a certain direction (at your option). When you open a new candle, this order is closed if it is in profit. Otherwise, the next order opens in the opposite direction. Orders are closed when profit is reached. If there are unprofitable orders on the chart, the robot will close one of them. When closing loss-making orders, the profit covers t
Testing Trade
Glory Orluike Echonwere
The indicator is a 15-minute signal indicator for all types of traders. Meaning, you could make lots of profits trading two different signals in one indicator. NOTE: Both indicators are channels for achieving the same result. RED ARROW -- Sell Signal BLUE ARROW -- Buy Signal Purchase now to be part of our community. We offer standard chart setups for both novice and intermediate traders. Trade with ease!
FREE
The indicator scans for TD Combo signals in multiple timeframes for the all markets filtered and shows the results on Dashboard. Key Features Dashboard can be used for all markets It can scan for signals on MN1, W1, D1, H4, H1, M30, M15 ,M5, M1 timeframes Parameters UseMarketWatch: Set true to copy all symbols available in market watch MarketWatchCount : Set the number of symbols that you want to copy from the market watch list. CustomSymbols: Enter the custom symbols that you want to be availa
E13 Acid Flux
Dariel Iserne Carrera
4 (1)
Based on a combination of indicators, E13 Acid Fulx is an excellent indicator for knowing when to buy or sell on any asset and temporaryity. The indicator myself I have used it as a tool for my analysis when trading Forex. It is a useful and easy-to-understand trend indicator.  If you combine it with your own analyses you will surely get a good result in your operation.
FREE
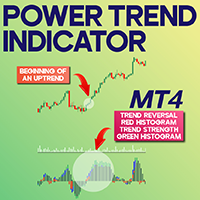
Power Trend Indicator for MetaTrader 4 The Power Trend Indicator for MetaTrader 4 is designed to assess both the momentum and direction of price movements. This MT4 indicator presents the trend strength using a four-color-coded system, allowing traders to spot weak momentum phases and anticipate potential trend initiations. Its visual feedback is valuable for recognizing shifts in market sentiment and detecting trend transitions. Red signals indicate reversals, blue suggests mild trends, while g
FREE
Synapse Trader: Ticarette yeni ufuklar açan bir sinir ağı Piyasayı sadece analiz etmekle kalmayıp, her gün öğrenen ve değişen piyasa koşullarına uyum sağlayan bir akıllı asistan haline gelen bir danışman hayal edin.   Synapse Trader , gelişmiş sinir ağı teknolojisine dayanan benzersiz bir araçtır ve piyasadaki en ince sinyalleri bile yakalayabilir. Bu sadece bir Uzman Danışman değil,   düşünen, tahmin eden ve gelişen bir canlı sinir ağıdır . Özel Teklif: Synapse Trader EA , tatil dönemi boyunca
Boost binary option profesional
Sebastian Alejandro Merino Sepulveda
Binarias & Forex (+90% Ratio-Win Next Candle) Espere que el precio llegue a una buena zona (fuerte) sea soporte, resistencia, zona de oferta o demanda, fibonacci level key, cifra redonda. Haciendo lo anterior definitivamente habrá una reversión en el precio y obtendrá su ITM en primera vela dando una efectividad del 100% siguiendo la tendencia. Es muy importante estar atento a las noticias fundamentales en el mercado y estas no afecten tu trading. Sesiones comerciales: cualquiera (24 horas).
The algorithm of the advisor calculates the important support and resistance levels. Next, the Expert Advisor calculates the probability of price movement "to" or "away" from this price level. Support: https://www.mql5.com/en/channels/TrendHunter If a high probability of price movement in the desired direction is determined, the advisor opens a deal. Each trade is protected by a stop loss. Dangerous trading methods are not used. Recommended instruments (5M): GBPUSD, EURUSD, USDJPY, USDCAD. Ad
1.Determine the trend size based on the chart cycle.   An uptrend near the highest price in a period of time.   A trend down near the lowest price in a period of time. 2.   short-term trends.   Oversold and long;   Overbought, short. 3. Unwind positions based on overbought and oversold and profit points. real-time signal: https://www.mql5.com/zh/signals/1538661?source=Site+Signals+My EA Settings: You need to load EA into the currency pair to trade (M15 time range). The best performing symbol : E
Gelişmiş Endeks Keskin Nişancı Robotumuzu tanıtıyoruz. Scalping ve Swing algoritması, yüksek olasılıklı giriş ve çıkış noktalarını tespit etmek için oluşturulmuştur ve her işlemin M5 Zaman Çerçevesi ve 1M Zaman Çerçevesi içinde en yüksek başarı şansıyla yürütülmesini sağlar. Scalping ve Swing Robot ile kullanılacak en iyi çift USTEC, US30, S&P 500, Gbpusd'dir. Bu robot, grafikleri manuel olarak izlemek zorunda kalmadan hızlı fiyat hareketlerinden yararlanmak isteyen ve scalping yöntemini/Swing Y
Anemone
Sean Christian Hammond
Canlı bir organizmanın görünür davranış kalıplarının trend analizine dahil edilmesi için yapay zeka, AI kullanılarak oluşturuldu. Kaos Teorisi, Hareketli Ortalama ile buluşuyor. Deniz Anemonu'nu besleyen filtre, kendini zenginleştirmek için dallarını bir besin denizine uzatır. Aşırı uzun açıklamalarla zamanınızı boşa harcamayacağım, kavram bu terimlerle anlaşılabilir. Sizin tarafınızdan belirtilen bir zaman girişinde Basit, Üstel, Ağırlıklı ve Yumuşatılmış arasında geçiş yapan özelleştirilebilir
This robot combines three ways of trading and for all uses the same successful money management. All three ways of trading can be used simultaneously or separately. Auto search and trading SR levels and their breakout. News trading - at a specified time placed pending orders for BUY and SELL. Manual opening trades using buttons in the chart. For these your trades will use the same money management as for automated trading. Is recommended ECN broker with minimal spread and with minimal slip and
Merhaba tüccarlar. En iyi ticaret aracımla tanışın. MTF PPAAF Modeli T. Çoklu Zaman Çerçevesi Hassas fiyat eylem oku filtreli Model T.  Bu ticaret aracı, yıllar boyunca çeşitli ticaret araçları yaptıktan sonra yaptığım en iyi çalışmadır. Bu ticaret aracı neden en iyi ve güvenilirdir?  1. Bu araç 6 gösterge kullanır:  Çift CCI = hızlı CCI x yavaş CCI İkili Stokastik = hızlı Stokastik (hızlı Stokastik ana hat x hızlı Stokastik sinyal hattı) ve yavaş Stokastik (yavaş Stokastik ana hat
Grafikleri yapılandıran ve döngüsel fiyat hareketlerini belirleyen teknik bir gösterge. Herhangi bir grafik üzerinde çalışabilirim. Birkaç çeşit bildirim var. Grafiğin kendisinde ek oklar var. Tarihe yeniden bakmadan, mumun kapanışına dair çalışmalar. M5 ve üzeri TF önerilir. Kullanımı ve yapılandırması kolay parametreler. Farklı parametrelere sahip 2 indikatörü kullanırken, bunları diğer indikatörler olmadan da kullanabilirsiniz. 2 giriş parametresi vardır Döngüsellik ve Sinyal Süresi Bu 2 pa
I speak in Hungarian. Magyarul beszélek benne. Első felvétel. https://www.youtube.com/watch?v=FfqvT-i9TPk&feature=youtu.be (Első felvétel. https://www.youtube.com/watch?v=MapbQrJ0uPU&t=9s   Első felvétel. https://www.youtube.com/watch?v=i2id5O1KPrI Második felvétel. https://www.youtube.com/watch?v=Zp2i7QN-IMc Első felvétel. https://www.youtube.com/watch?v=h7UbTWiM-Lw Második felvétel. https://www.youtube.com/watch?v=y54q4Rasf2A&t=1s Harmadik felvétel. https://www.youtube.com/watch?v=13zYjsoe6
***Importanr_1*** USE : All Time Frame M1,M5,M15,M30,H1,H4,D1,W1,MN Lot size , Slippage > 1,000 for BTCUSD and Magic number can be adjusted. XAUUSD (GOLD) ,EURUSD,USDJPY,GBPUSD,AUDUSD,GBPJPY,USDCHF,USDCAD,BTCUSD +++Set Parameter+++ 1.Set Fixed Lot = 0.01  ( Lot size 0.0 = Martingale system ) 2.Set Slippage = 1,000-10,000 ( For XAUUSD,ฺBTCUSD) 3.Set Max Spread =  100-1,000 ( For XAUUSD,ฺBTCUSD) ***Importanr_2*** Forex Trading Warning: Forex trading carries a high level of risk and may not
Bu ürünün alıcıları ayrıca şunları da satın alıyor
This is a mini version(One pair) of Advanced Detector of Trend Reversal and Continuance known as TrueTrendStarM(TTSm25). It is a sensitive and Predictive indicator of Price Trends for Professional traders. ( WEEKEND DISCOUNT OFF !!! )( ATTENTION BUYERS:- PLEASE CONTACT ME FOR HOW BEST TO USE THE INDICATOR FOR MAXIMUM PROFITS )    It detects high odds changes in Price Trend direction long before other indicator detects it. I have been working on it since 2019.    This is possible due to fract
Trade Invest Pro - Kripto para dünyasında patron! Bu gösterge kripto para ticareti için idealdir! Trade Invest Pro üzerinde çalışmak yarım yılımızı aldı! Ama boşuna değil! Şimdi sadece destek yakınında doğru sinyaller - direnç seviyeleri! İkili opsiyonlar için m5 m15 zaman dilimlerinde kendini iyi gösterdi! İsteğe bağlı olarak, m30 ve daha fazlası için forex için yapılandırılabilir! Haberlere iyi tepki veriyor! boyamaz! ve programdan kaybolmaz! Kırmızı ok göründüğü anda, düşüş için bir
İŞLEM HIZI, piyasada büyük emirlerin nerede ve ne zaman biriktiğini ve bunun faydalarını gösteren en kaliteli göstergedir. Trend değişikliklerini çok erken aşamada tespit eder. Aynı anda hem bir gösterge hem de bir ticaret sistemidir. Konsept benzersiz ve inanılmaz derecede karlı. Forex'te tik hacmi oldukça yanıltıcı bir şekilde hacim olarak adlandırılır. Aslında, fiilen İŞLEM HIZI olan birim zaman başına fiyat değişimidir. Bu gösterge, Forex'teki hacim fikrini mantıksal olarak doğru şekilde t
Dark Sniper
Dmitriy Kashevich
Dark Sniper pointer indicator.  Complete absence of redrawing   The percentage of correct indicator forecasts depends on your settings; the default is period 7 (performed better) The arrow indicates the direction of the next candle and the possible direction of the trend in the future.  Suitable for small timeframes m1 and m5  It is recommended to open transactions from 1 to 2 candles.  The signal appears on the current candle. Open a trade on the next one since the signal is being generat
Magic M2
Tuan Anh Dao
4.5 (8)
------ GOOD LUCK   -----   (Telegram: @MagicBinary) The indicator allows you to trade binary options. T his indicator give high winning ratio with over 20 years of backtesting  The recommended time frame is М1 and the expiration time is 3, 5 minutes. The indicator suitable for Auto and Manual trading. A possible signal is specified as a arrows above/under a candle. You can entry current candle /intrabar or can wait until candle close Arrows are not re-painted Trade sessions: Any/ Rec
Risk Reward ratio indicator for MT4  BING Risk Reward indicator is a powerful, basic, very needed tool for every trader. Clearly visualize Open Price , Stop Loss , and Top Profit levels on your graphs with easy-to-see colors and trendlines. Does BING Risk Reward show alerts? Of course! BING Risk Reward Indicator offers all Alerts available for the MT4 platform(Email, Popups, Sound, and Push). It shows alerts on Open Price , Stop Loss , and Top Profit. That way, besides easily seeing what is go
Automatic, live & interactive picture of all trendlines. Assign push, email and sound alerts to the lines of your choice and be informed about price rollback, breakout, rollback after breakout, number of rollbacks, line expiration by double breakout. Correct, drag or delete the lines and interactively tune the line system. https://youtu.be/EJUo9pYiHFA . Chart examples https: //www.mql5.com/en/users/efficientforex Price Interaction Events All events are effective immediately and only after one
The indicator displays the probable ( Support and resistance ) levels. The indicator draws horizontal and trend levels of support and resistance. The indicator settings: Trends - the mode for displaying trend lines or horizontal lines of support and resistance Yes - display trend lines only No - display horizontal lines only UseResource - use the resources built into the indicator. Yes - use the ZigZag indicator from the resources of the product. No - use a custom ZigZag indicator. HistoryBar -
The indicator of a Professional Trader is an arrow indicator for predicting the direction of price movement. I have been working on this indicator since 2014. You can use this indicator as your main indicator, use its entry signals, and use it as your only indicator to find entry points. About the product: Recommended TF [H4-D1-W1]   . The indicator predicts the direction of the next candle. Fits a variety of tools; Flexibility in settings for different instruments and intervals through the MO
The [GRAFF] III manual trading system is based on multiple MetaTrader (MT4) indicators. Together, the entire PACK of GRAFF III indicators makes an advanced trading tool. The system consists of over 20 different custom-built indicators which have been carefully selected and tested in the long term to produce strong and efficient trading signals. The particular indicators are based on different mathematical formulas, so the entire system is calibrated to remove false signals from its own indicator
You can fins our other products from link : https://www.mql5.com/en/users/drbastem/seller   Also, you can ask all your questins from email : haskayafx@gmail.com or mobile : +90 530 867 5076 or @MehmetBastem    on telegram application This indicator is used to determine the trend. Standard Osma indicator is used. It has the indicator warning system: beep, e-mail and has three types of alerts, including messages to mobile phone. It shows the best performance on the chart of 5 minutes. When the
You can fins our other products from link : https://www.mql5.com/en/users/drbastem/seller   Also, you can ask all your questins from email : haskayafx@gmail.com or mobile : +90 530 867 5076 or @MehmetBastem    on telegram application This indicator is used to determine the trend. Standard Three Moving Average and ADX indicators are used. It has the indicator warning system (audio, e-mail) and three types of alerts, including messages to mobile phone. It shows the best performance on M5. When
This indicator is used to determine the trend. Standard Three Moving Average and ADX indicators are used. It has the indicator warning system (audio, e-mail) and three types of alerts, including messages to mobile phone. It shows the best performance on M5. When the trend value reaches the value set, the warning system is activated. This indicator works only with Forex symbols. Inputs SoundAlarm = true - Sound Alert Sendmail=true - Send an e-mail in case of a buy or sell signal Sendnotification
You can fins our other products from link : https://www.mql5.com/en/users/drbastem/seller   Also, you can ask all your questins from email : haskayafx@gmail.com or mobile : +90 530 867 5076 or @MehmetBastem    on telegram application This indicator is used to determine the trend. Standard MACD indicator is used. It has the indicator warning system: beep, e-mail and has three types of alerts, including messages to mobile phone. It shows the best performance on the chart of 5 minutes. When the
Smooth price for Monarch MT4
Konstantin Gruzdev
3.67 (3)
The Smooth Price technical indicator is used for plotting a smoothed line as close to the price of the financial instrument as possible, and serves to eliminate its noise components. The indicator is part of the Monarch trading system, but here it is presented as an independent technical analysis tool. The indicator is based on the cluster digital filter , which, unlike the ClusterSMA , is applied directly to the price time series. Smooth Price does not redraw (except the very last, zero bar) an
Pan PrizMA CD Phase is an analogue of the МetaТrader 5 indicator , and is an option based on the Pan PrizMA indicator. Details . Averaging by a quadric-quartic polynomial increases the smoothness of lines, adds momentum and rhythm. Extrapolation by the sinusoid function near a constant allows adjusting the delay or lead of signals. The value of the phase - wave status parameter (which is close in meaning to the trigonometric phase or the angle of the radius-vector rotation in the trigonometric p
Green Wall Arrows
Daniel Luchinger
1 (1)
The Name Green Wall : Arrows hits a lot of TP, by changing the idea of non using SL as something bad, but instead use Small TP and a lot of free Margin and Patience. Use micro TP and a lot of Free Margin with this indicator on Forex. It also can be used with Binary Options. This strategy is intended to be traded Manually. This Indicator runs on Open Bar, arrows will delete when price are against it. The only Indicator Parameter is Alerts true/false, all the rest is included inside the code. Arro
Golden Monowave is monowave indicator, the monowave theory is one of Elliott wave approach and one of most complicate and accurate method. Golden Monowave can shortcut many major steps to identify and describe the monowave. It works on any timeframe and with any trading instrument, including currencies, indices, futures, etc. Input Parameters initial_Bars - set the initial number of bars to calculate. wave_color - select the color of the wave. label_color - select the color of labels. temp_labe
Ticks Size
Viktor Kolmakov
This indicator displays in a separate window the difference between the number of points which increased the price, and the number of points that decreased the price during the time interval specified in the settings. The time interval for calculation is expressed as the number of bars of the chart the indicator is attached to. This approach allows you to evaluate the movement direction (growth or fall) of the instrument's price, the strength of the movement and the size of the movement in point
NostradamusMT4
Andrey Spiridonov
1 (1)
NostradamusMT4 is a powerful indicator from the set of professional trader. The indicator is based on Andrei Spiridonov's original price calculation method (ESTIMATED PRICE) for the current candle price. Advantages The indicator does not redraw. It works on any timeframes. Works with any trading instruments. Perfectly suitable for scalping and trading binary options. Parameters Color - color of the ESTIMATED PRICE FUTURE line. How to work with the indicator The indicator forms the ESTIMATED P
BinaryIndicator is a highly accurate indicator for trading binary options. It shows excellent results in scalping. This indicator is based in multifactor analysis of trend indicators, as well as confirmation oscillators, which in the end gives an increased accuracy of signals. Advantages of the indicator Increased accuracy of signals. Excellent results when trading binary options with a short expiration time from M30 to M1 . It works on any timeframes. Works with any trade symbols. Parameters
FutureTrade
Andrey Spiridonov
3 (2)
FutureTrade is one of the few indicators that predicts the price right on the price chart. The indicator calculation algorithm is based on the fast Fourier transform. Given the oscillatory behavior of the price, the Fourier function predicts its future behavior. The indicator should be attached in the usual way to a chart with the trading instrument specified symbol and with the M15 timeframe. This timeframe is the most optimal for working with any symbols. Once started, the indicator calculates
BinaryScalping
Andrey Spiridonov
BinaryScalping is a professional indicator for trading binary options and scalping. The algorithm of the indicator is based on the calculation of pivot points for each time period separately, the location of the price of the trading instrument relative to the pivot points is analyzed and the probability of a trading operation is calculated. The indicator has a built-in filter of trading signals based on the global trend. The indicator is installed in the usual way and works with any trading inst
This is the FXTraderariel PowerTrend . It compute a trendfollowing system based on it own algorithm. It gives you a buy or sell signal based on the trend. It based on the Supertrend, but our Version is not repainting. Furthermoore we added some Improvements and you can get an Arrow, Push or Alert when the trend changes. Depending on the settings it and trading style, it can be used for scalping or long-term trading . The indicator can be used on every time frame , but we advise to use it on H1
This is the complete REX package. It consists of the lite, pro and ULTRA version.  Perfect for beginners and intermediates. REX complete is 100% non repaint. The strategy is based on a mix of different strategies, statistics, including pivot points, oscillators and patterns.  As the trading idea consists of a variety of some classic indicators like Momentum, Williams Percent Range, CCI, Force Index, WPR, DeMarker, CCI, RSI and Stochastic, it is clear that the fundamental indicators have being u
BinaryUniversal is a signal indicator for binary options and Forex. In its work, the indicator uses a complex algorithm for generating signals. Before forming a signal, the indicator analyzes volatility, candlestick patterns, important support and resistance levels. The indicator has the ability to adjust the accuracy of the signals, which makes it possible to apply this indicator for both aggressive and conservative trading. The indicator is set in the usual way, it works on any time period and
Sweet Waffle
Christophe Godart
The arrows are calculated with: -     2 Parabolic  parameters -     2 ADX parameters -     4 Stochastic parameters We recommend to combine it with Parabolic, ZigZag or Elliot waves indicator. Always trade the trend! If you make sure to draw your trend lines and support/resistance zones you will just have to wait for the signal to appear. Take the trade. For Binary Options it is advisable to set the expiry time to 5-15 min in M1 chart. THIS INDICATOR IS ZERO REPAINT Best assets to trade: - EUR
Let´s try to make some real money! Call me profit addicted. I thought why not try to make THE dream come reality. With discipline, a clear strategy and this indicator I focus on entering the perfect trades. This indicator is very easy to use as you will get perfect entry points for Put or Call trades. The arrows are calculated with: -     Momentum  parameters -     Candle stick patterns -     Fundamental Price action We recommend to combine it with Parabolic, ZigZag or Elliot waves indicator
SystemPro
Andrey Spiridonov
SystemPro - a professional indicator, is a full-fledged, self-sufficient author's strategy for working in the Forex market. A unique algorithm for analyzing the foreign exchange market is based on the calculation of reference points for three different time periods. Thus, the indicator simultaneously analyzes the long-term, medium-term and short-term price behavior before issuing a signal. The indicator is set in the usual way and works with any trade symbols. Advantages of the indicator It is
Yazarın diğer ürünleri
[V 1.00] MTF NRPA 5 RSI RTD yayınlandı! Yeniden boyanmayan ok gerçek zamanlı pano. Çeşitli RSI göstergelerini kullanmaktan sıkıldıysanız ancak bunların hatalı olduğunu düşünüyorsanız, bu aracı deneyin. Genellikle insanlar bir zaman diliminde OBOS seviyesini belirlemek için yalnızca 1 RSI kurarlar. Kötü haber şu ki, aynı anda çeşitli zaman dilimlerinde OBOS seviyelerini ve trendlerini göremiyorsunuz. Bu ticaret aracını bu yüzden geliştirdim. İşte nasıl açıklandığı: Bu ticaret aracında beş RS
[V 1.00] MTF NRPA 5 Hareketli Ortalama RTD yayınlandı! Yeniden boyanmayan ok gerçek zamanlı pano. En iyi hareketli ortalama göstergesini arıyorsanız, doğru sayfadasınız. Genellikle insanlar iki hareketli ortalama kuracaktır çünkü iki hareketli ortalamanın kesişimi (çaprazlama) bir sonraki fiyat eğiliminin yönünü belirleyecektir. Hızlı hareket eden ortalama, yavaş hareket eden ortalama ile kesişiyorsa ve hızlı> yavaş ise, trend yukarıdır. Tersine, hızlı hareket eden ortalama, yavaş hareket ede
Bir döviz çiftinin birden fazla zaman dilimini tek bir pencerede analiz etmek kafanızı karıştırabilir. Birden çok zaman dilimini analiz etmek için güvenilir göstergelere ihtiyacınız vardır. Bunlardan biri 9TF MACD Eğrisi kullanıyor. Basit ama güvenilir ve dokuz zaman dilimini tek bir göstergede kapsayan bir kod oluşturmak için gece gündüz çalışıyorum. Bu göstergenin bazı avantajlarına bakalım: Renkli histogram. Her zaman dilimindeki eğrinin rengi birbirinden farklıdır. MACD ana hattı ve si
Bir döviz çiftinin birden fazla zaman dilimini tek bir pencerede analiz etmek kafanızı karıştırabilir. Birden çok zaman dilimini analiz etmek için güvenilir göstergelere ihtiyacınız vardır. Bunlardan biri 9TF STOCH RSI kullanıyor. Basit ama güvenilir ve dokuz zaman dilimini tek bir göstergede kapsayan bir kod oluşturmak için gece gündüz çalışıyorum. Bu göstergenin bazı avantajlarına bakalım: Renkli histogram. Her zaman dilimindeki eğrinin rengi birbirinden farklıdır. STOCHASTIC ana hat ve
Analyzing multiple time frames of a currency pair in one window can make you confused. To analyze multiple time frames, you need reliable indicators. One of them is using 9TF RSI MA . I've been working day and night to create code that is simple but reliable and covers all nine time frames in just one indicator .  Let's look at some of the advantages of this indicator: Colorful histogram . The color of the curve in each timeframe is different from one another.  Arrows indicating the crossing of
Analyzing multiple time frames of a currency pair in one window can make you confused. To analyze multiple time frames, you need reliable indicators. One of them is using 9TF MACD Limited Bar . I've been working day and night to create code that is simple but reliable and covers all nine time frames in just one indicator .  Attention! When first installed, the indicator does not look intact. Changing the timeframe will solve the problem. Let's look at some of the advantages of this indicator: C
Analyzing multiple time frames of a currency pair in one window can make you confused. To analyze multiple time frames, you need reliable indicators. One of them is using 9TF STOCH RSI LIMITED BAR . I've been working day and night to create code that is simple but reliable and covers all nine time frames in just one indicator .  Attention! When first installed, the indicator does not look intact. Changing the timeframe will solve the problem. Let's look at some of the advantages of this indicat
Bir döviz çiftinin birden fazla zaman dilimini tek bir pencerede analiz etmek kafanızı karıştırabilir. Birden çok zaman dilimini analiz etmek için güvenilir göstergelere ihtiyacınız vardır. Bunlardan biri 9TF Double RSI Double MA kullanıyor. Basit ama güvenilir ve dokuz zaman dilimini tek bir göstergede kapsayan bir kod oluşturmak için gece gündüz çalışıyorum. Bu göstergenin bazı avantajlarına bakalım: Çift RSI, yani RSI daha hızlı ve RSI daha yavaş. Çift MA, yani MA daha hızlı ve MA daha
Bir döviz çiftinin birden fazla zaman dilimini tek bir pencerede analiz etmek kafanızı karıştırabilir. Birden çok zaman dilimini analiz etmek için güvenilir göstergelere ihtiyacınız vardır. Bunlardan biri 9TF Double CCI Double MA kullanıyor. Basit ama güvenilir ve dokuz zaman dilimini tek bir göstergede kapsayan bir kod oluşturmak için gece gündüz çalışıyorum. Bu göstergenin bazı avantajlarına bakalım: Çift CCI, yani CCI daha hızlı ve CCI daha yavaş. Çift MA, yani MA daha hızlı ve MA daha
Doğru bir CCI göstergesi mevcuttur. Pano Trend Çubuğu Smart Level 9TF Double CCI. Çift CCI, yani Hızlı CCI ve Yavaş CCI Neden ikinci CCİ'ye ihtiyacınız var? Ek göstergeler kullanmak, canlı ticarette bizi daha fazla ikna edecektir. 9TF Hızlı CCI eğrisi 9TF Yavaş CCI eğrisi 9TF gerçek zamanlı CCI açısı 9TF gerçek zamanlı CCI değeri 9TF gerçek zamanlı CCI yönü/fazı 9TF Eğilim Çubuğu Trend çubuğunun hesaplanmasında yeni algoritma Açma/Kapama Düğmesi. Tek bir tıklamayla göstergeyi göstermek/gizleme
Doğru bir RSI göstergesi mevcuttur. Pano Trend Çubuğu Akıllı Seviye 9TF Çift RSI. Çift RSI, yani Hızlı RSI ve Yavaş RSI Neden ikinci RSI'ya ihtiyacınız var? Ek göstergeler kullanmak, canlı ticarette bizi daha fazla ikna edecektir. 9TF Hızlı RSI eğrisi 9TF Yavaş RSI eğrisi 9TF gerçek zamanlı RSI açısı 9TF gerçek zamanlı RSI değeri 9TF gerçek zamanlı RSI yönü/fazı 9TF Eğilim Çubuğu Trend çubuğunun hesaplanmasında yeni algoritma Açma/Kapama Düğmesi. Tek bir tıklamayla göstergeyi göstermek/gizleme
Doğru bir MACD göstergesi mevcuttur. Gösterge Tablosu Trend Çubuğu Akıllı Seviye 9TF Çift MACD. Çift MACD, yani Hızlı (MACD 1) ve Yavaş (MACD 2) Neden ikinci MACD'ye ihtiyacınız var? Ek göstergeler kullanmak, canlı ticarette bizi daha fazla ikna edecektir. 9TF Hızlı MACD 1 eğrisi 9TF Yavaş MACD 2 eğrisi 9TF gerçek zamanlı MACD açısı 9TF gerçek zamanlı MACD değeri 9TF gerçek zamanlı MACD yönüDoğru bir MACD göstergesi mevcuttur. Gösterge Tablosu Trend Çubuğu Akıllı Seviye 9TF Çift MACD. Çift MA
Doğru bir Stokastik gösterge mevcuttur. Pano Trend Çubuğu Smart Level 9TF Dual Stokastik. İkili Stokastik, yani Hızlı Stokastik ve Yavaş Stokastik Neden ikinci Stokastik'e ihtiyacınız var? Ek göstergeler kullanmak, canlı ticarette bizi daha fazla ikna edecektir. 9TF Hızlı Stokastik eğri 9TF Yavaş Stokastik eğri 9TF gerçek zamanlı Stokastik açı 9TF gerçek zamanlı Stokastik değer 9TF gerçek zamanlı Stokastik yön/faz 9TF Eğilim Çubuğu Trend çubuğunun hesaplanmasında yeni algoritma Açma/Kapama Düğ
Introducing the advanced trading tools of 2023. MTF PPAAF Model S. This is sub window version of my best trading tool : MTF Precise Price Action Arrow Filtered.  Click here to learn more about MTF PPAAF . This trading tool is equipped with various powerful features : MTF = Multi Time Frame = Time Frame can be changed. On/off button. Non Repaint Arrows.  Customizable parameter, color etc.  Can show all time frame (ATF) crossover arrows of fast stochastic main line & fast stochastic signal line (
If you are curious about the position of the stochastic, RSI, CCI curve, whether it is at the OBOS level or not, then this trading tool is for you. Introducing the advanced trading tools of 2024. ATF Trend Following Trend Bar OBOS. This indicator is similar to MTF PPAAF Model S but have two layers.  Click here to learn more about MTF PPAAFS . This trading tool is equipped with various powerful features : MTF = Multi Time Frame = Time Frame can be changed. On/off button. Customizable parameter,
Merhaba tüccarlar. En iyi ticaret aracımla tanışın. MTF PPAAF Modeli T. Çoklu Zaman Çerçevesi Hassas fiyat eylem oku filtreli Model T.  Bu ticaret aracı, yıllar boyunca çeşitli ticaret araçları yaptıktan sonra yaptığım en iyi çalışmadır. Bu ticaret aracı neden en iyi ve güvenilirdir?  1. Bu araç 6 gösterge kullanır:  Çift CCI = hızlı CCI x yavaş CCI İkili Stokastik = hızlı Stokastik (hızlı Stokastik ana hat x hızlı Stokastik sinyal hattı) ve yavaş Stokastik (yavaş Stokastik ana hat
Bu işlem aracıyla aynı anda 15 piyasayı tarayabilirsiniz. Karşınızda yeni ticaret göstergesi 2024: ️ Kontrol Paneli Çoklu Para Birimi Çoklu Zaman Çerçevesi Stokastik. Bu ticaret aracını oluşturmamın en az iki nedeni var: Öncelikle tek piyasayı gözlemlemekten sıkıldım. İkincisi, başka bir pazara giriş anını kaybetmek istemiyorum. Bu yüzden aynı zamanda diğer piyasa koşullarını da bilmek istiyorum. Bu nedenle birden fazla piyasanın koşullarını aynı anda tarayabilecek bir tarayıcıya ihtiyac
Bu işlem aracıyla aynı anda 15 piyasayı tarayabilirsiniz. Karşınızda yeni ticaret göstergesi 2024: ️ Dashboard Çoklu Para Birimi Çoklu Zaman Çerçevesi Çift CCI. Bu ticaret aracını oluşturmamın en az iki nedeni var: Öncelikle tek piyasayı gözlemlemekten sıkıldım. İkincisi, başka bir pazara giriş anını kaybetmek istemiyorum. Bu yüzden aynı zamanda diğer piyasa koşullarını da bilmek istiyorum. Bu nedenle birden fazla piyasanın koşullarını aynı anda tarayabilecek bir tarayıcıya ihtiyacım var
Bu işlem aracıyla aynı anda 15 piyasayı tarayabilirsiniz. Karşınızda yeni ticaret göstergesi 2024: ️ Kontrol Paneli Çoklu Para Birimi Çoklu Zaman Çerçevesi Çift RSI. Bu ticaret aracını oluşturmamın en az iki nedeni var: Öncelikle tek piyasayı gözlemlemekten sıkıldım. İkincisi, başka bir pazara giriş anını kaybetmek istemiyorum. Bu yüzden aynı zamanda diğer piyasa koşullarını da bilmek istiyorum. Bu nedenle birden fazla piyasanın koşullarını aynı anda tarayabilecek bir tarayıcıya ihtiyacı
Filtrele:
İnceleme yok
İncelemeye yanıt
Sürüm 6.20 2025.04.22
In this new Version V 6.20 :
- Minor changes
Sürüm 6.10 2025.04.17
In this new Version V 6.10 :
- Minor changes
Sürüm 6.0 2025.04.14
In this new Version V 6.00 :
- Adding arrow angle STF (the default is TF M15)
- Customizing arrow distance of Belt Trend
- Customizing digit and color of angle value MA
- Adding timeframe and calculation mode for arrow trend following (setting H4)
- Optimization
Sürüm 5.90 2025.03.26
In this new Version V 5.90 :
- Total number of trend bar MTF Dual Confluence Multi Mode is now 7
Sürüm 5.80 2025.03.18
In this new Version V 5.80 :
- Adding special MAs & special DRSI
- Optimizes performance when installed with the best combo MTF PPAAF Model T
- Quint MTF Dual Confluence Multi Mode
Sürüm 5.70 2025.01.31
In this new Version V 5.70 :
- New algo of status per TF
- Customizing arrow Trend Bar 9TF RSIMA CCIMA
- Adding triple confluence of MA1x2, MA3x4, MA5x6
- Adding new mode to dual pivot ATF
Sürüm 5.60 2025.01.15
In this new Version V 5.60 :
- Adding single line feature for on chart four MA
- Adding arrow angle RSI CCI scheme
Sürüm 5.50 2024.12.31
In this new Version V 5.50 :
- Adding Another On Chart Four MA feature
- Adding MTF Angle RSI CCI feature
- New algo Dual Pivot ATF
Sürüm 5.40 2024.12.18
In this new Version V 5.40 :
- Fixing trading in the zone (TITZ)
- TITZ applied to pivot horizontal line and vertical line
- Customizing on chart four MA feature
Sürüm 5.30 2024.11.28
In this new Version V 5.30 :
- Fixing belt trend arrows
- Adding belt trend calculation mode
Sürüm 5.20 2024.11.20
In this new Version V 5.20 :
- Adding calculation mode for trading in the zone (vertical and horizontal)
- Adding Trend Bar 9TF RSIMA CCIMA (complete!)
Sürüm 5.10 2024.09.20
In this new Version V 5.10 :
- Adding Trend Bar 3TF RSIMA CCIMA arrows scheme
Sürüm 5.0 2024.09.10
In this new Version V 5.00 :
- Replay system applicable to Dual Pivot ATF
- Adding display type to Dual Pivot ATF
Sürüm 4.90 2024.08.26
In this new Version V 4.90 :
- Adding Dual Double CCI
- Adding DCCI calculation mode
Sürüm 4.80 2024.08.13
In this new Version V 4.80 :
- Deconstruct from the beginning
- Adding CCIMA indicator
- Adding triple MTF cloud histo
- Adding triple MTF confluence multi mode
- Adding trend bar 3TF RSIMA/CCIMA
- Adding dual pivot all time frame
- Adding color level scheme
- Customizing on chart feature
- Optimizing the loading time
Sürüm 4.70 2024.04.03
In this new Version V 4.70 :
- Fixing pivot value horizontal line trading in the zone
- Customizing Dual MTF Cloud Histo
Sürüm 4.60 2024.03.29
In this new Version V 4.60 :
- Changing MTF Belt Trend to Dual MTF Belt Trend
- Adding trend following feature to MTF Belt Trend
- Adding time frame scheme True RSIMA
- Customizing On Chart Dual DRSI
- Customizing On Chart Dual Stochastic
- Customizing On Chart True RSIMA
Sürüm 4.50 2024.03.18
In this new Version V 4.50 :

- Deleting Super Trend Arrows (only dashboard available with lines and trend bar) to optimize the rendering time
- Deleting Trend Bar 3TF of SRCM (Stoch,RSI,CCI,MACD)
- Deleting Trend Bar 3TF of MA5 x MA6
- Deleting confluence 3TF of Stochastic
- Deleting confluence 3TF of MACD
- Deleting confluence 3TF of MA1 x MA2
- Deleting confluence 3TF of DRSI
- Deleting confluence Dual Stoch
- Deleting confluence Dual MACD
- Adding MTF Belt Trend
- Adding Dual MTF Cloud Histo
- Adding 3TF True RSIMA lines
- Adding 3TF True RSIMA trend bar
- Adding 3TF True RSIMA dashboard
- Adding horizontal line trading in the zone
- Adding pivot value horizontal line trading in the zone
- Fixing vertical lines trading in the zone
- Total mode right now is 13 (previously 9)
Sürüm 4.40 2024.02.02
In this new Version V 4.40 :
- Adding trend bar feature of True RSIMA
- Adding dashboard feature of True RSIMA
- Adding vertical lines feature of trading in the zone
- Adding current time and broker time feature
- Modifying trend bar 3 time frame
- Fixing dashboard monitor position
- Fixing price index location
Sürüm 4.30 2024.01.25
In this new Version V 4.30 :
- Fixing histogram of MTF Belt Trend
Sürüm 4.20 2024.01.25
In this new Version V 4.20 :
- Fixing OBOS level of ATF dashboard
- Adding calculation mode of TB TRD FOL 3TF, i.e DCCI and FDMACD
- Adding histogram to MTF belt trend
Sürüm 4.10 2024.01.10
In this new Version V 4.10 :
- Fixing ATF Stochastic and ATF MACD
- Fixing algorithm of confluence 3TF
- Fixing algorithm of STF Dual Stochastic and Dual MACD
Sürüm 4.0 2024.01.03
In this new Version 4.00 :
- Adding background color to trend bar 3TF
- Adding Mode 8 : Show ATF MA 1x2 DRSI
- Adding timeframe scheme of trading in the zone
- Adding timeframe scheme of trend following STF
- Adding timeframe scheme of trend bar trend following 3TF
- Fixing dashboard of RSIMA
Sürüm 3.90 2023.12.22
In this new Version 3.90 :
- Deleting favorite arrows
- Adding MTF Trendbar Trend Following 3 Time Frame FDSTOCH/DRSI
- Adding MTF Trendbar Average 3 Time Frame FDSTOCH/DRSI
- Adding MTF Trendbar Trend Following 3 Time Frame MA5 x MA6
- Adding MTF Trendbar Average 3 Time Frame MA5 x MA6
- Fixing status quo of trading in the zone
Sürüm 3.80 2023.11.20
In this new version V 3.80 :
- I fixed the 1 minute RSIMA dashboard
- I limited the number of favorite arrow mode to three
Sürüm 3.70 2023.11.16
In this new version V 3.70 :
- I fixed the RSIMA dashboard
- I added favorite arrow calculation modes
Sürüm 3.60 2023.11.13
In this new version V 3.60 :
- I added favorite arrow feature
- I set up trading in the zone interface
- I added W1 timeframe scheme for trend following STF arrows
Sürüm 3.50 2023.11.06
In this new version V 3.50 :
- I changed the symbol for MACD above zero and MACD below zero level.
- I changed the code of square STF trend following.
Sürüm 3.40 2023.10.30
In this new Version 3.40 :
- I limited the number of candle high time frame
- I added arrow size option to trend following STF arrows
Sürüm 3.30 2023.10.25
In this new Version 3.30 :
- I fixed the on off button sound
- I added trend bar 9TF of STA mode 2 from current time frame (0) to previous 5 bar ago (5)
- I fixed on chart dual stochastic channel
- I fixed dashboard position
- I modified algorithm in STA mode 1 & mode 2
- I added time frame scheme for trend following STF
Sürüm 3.20 2023.10.19
In this new Version 3.20 :
- I changed the dashboard font so it looks clear
Sürüm 3.10 2023.09.25
In this new Version 3.10 :
- Reduce total mode to only 8, i.e show all time frame crossover arrows and trading in the zone
- Modifying parameter setting
- Can show all time frame crossover arrows of fast CCI and slow CCI, i.e DCCI
- Modify the status for mode 8
- Can show trend following selected time frame of fast stochastic, RSI 1x2, CCI 1x2, fast macd and RSIxMA outside the modes.
Sürüm 3.0 2023.09.06
In this new Version 3.00 :
- Modifying STA algorithm both for calculation mode 1 and mode 2
- Modifying dashboard color scheme
- Modifying parameter setting
Sürüm 2.90 2023.09.04
In this new Version 2.90, I added new features :
- Adding Mode 29 : Show ATF Fast Stoch DRSI. With this feature monitoring all time frame arrows of stochastic and RSI is easy.
- Adding STA Calculation Mode. The first mode is based on crossover of RSI & MA and the second mode is based on crossover of fast RSI & slow RSI.
Sürüm 2.80 2023.08.30
In this new Version 2.80, I added new feature :
- Adding Time Spread Profit Info (TSPI) indicator
Sürüm 2.70 2023.08.21
In this new Version 2.70, I make monitoring visually Stoch RSI easy :
- Modifying on chart dual stochastic
- Modifying on chart double rsi
- Modifying on chart rsioma
- Modifying color level
Sürüm 2.60 2023.08.13
In this new Version 2.60, I added new feature :
- Adding STF belt trend
- Fixing on chart range
- Changing arrow code DRSI and DCCI
Sürüm 2.50 2023.07.31
In this new Version 2.50, I added new feature :
- Adding confluence of 3TF MA 1x2
- Changing arrow code for trend following double CCI
- Changing arrow code for trend following double RSI
Sürüm 2.40 2023.07.25
In this new Version 2.40, I added new features :
- Adding confluence of 3TF Fast DSTOCH
- adding confluence of 3TF Fast DMACD
- Adding trend following STF of DRSI
- Adding STA monitor, i.e (from top to bottom) H1,H4,D1,W1,MN1
Sürüm 2.30 2023.07.18
In this new Version 2.30, I added new features :
- Added mode 28 : show trading in the zone
- Added 9TF double CCI dashboard monitor
- Added selected timeframe of double CCI crossover arrows
- Added STA monthly arrows
- Added three new dashboard color scheme
- Fixing STA, dual stochastic & dual MACD algorithm
Sürüm 2.20 2023.07.11
In this new Version 2.20, I added new features :
- Added upper bound 100 & lower bound 0 for on chart dual stochastic
- Added upper bound 100 & lower bound 0 for on chart double rsi
- Fixing trading in the zone four MA
- Added timeframe scheme for four MA
- Fixing RSIMA dashboard
Sürüm 2.10 2023.07.04
In this new Version 2.10 :
- Fixing DRSI arrow TF MN1
- Fixing color super trend arrows
- Fixing arrow MA 3 x MA 4
- Added timeframe scheme D1,W1,MN1 for conflux DRSI
Sürüm 2.0 2023.07.03
In this new Version 2.00, I added new features :
- Added confluence arrows of 3 timeframe double RSI
- Added 12 timeframe scheme to choose from for confluence of double RSI
- Fixing algorithm for trend following dual stoch and dual macd
Sürüm 1.90 2023.06.26
In this new Version 1.90, I added new features :
- Added super trend arrows higher timeframe
- Added MACD above or below zero level into dashboard
- Fixing MTF feature
Sürüm 1.80 2023.06.20
In this new Version 1.80, I've made a lot of changes :
- Change the appearance of the dashboard from a circle to a square shape.
- Fixing color OBOS of slow stochastic and slow drsi.
- Added feature on chart slow stochastic.
- Added feature pivot value of all time frame of Fast Stoch.
- Added feature pivot value of all time frame of Fast MACD.
- Added feature pivot value of all time frame of MA 1,2.
- Added feature pivot value of all time frame of Double RSI.
- Added feature pivot value of all time frame of RSIMA.
- Added feature MTF candle high time frame.
- Ability to change/shift the starting time to monitor in real time 9TF dashboard.
Sürüm 1.70 2023.06.02
In this new Version 1.70, I've added the ability to monitor visually :
- On chart stochastic makes it easy for us to observe the movement of stochastic main line and stochastic signal line along the OBOS channel.
- On chart four MA makes it easy for us to observe the movement of MA 1 cross MA 2 and MA 3 cross MA 4.
- On chart double RSI makes it easy for us to observe the movement of RSI fast line and RSI slow line along the OBOS channel.
- On chart true RSIMA makes it easy for us to observe the movement of RSI line and MA line along the OBOS channel.
This on chart double RSI or on chart true RSIMA will make monitoring RSI divergence much more accurate than installing RSIMA on sub window.
And also I changed the appearance of the 10 dashboard color scheme to be more attractive.
Sürüm 1.60 2023.05.23
In this new Version 1.60, I've made trading in the zone much more easy :
- Added four MA dashboard monitor (not just two MA!)
- Added four MA lines on chart (by default : MA 1x2 on current timeframe and MA 3x4 on M30)
- Customizable four MA lines
- Button can be located on sub window
Sürüm 1.50 2023.05.03
In this new Version 1.50, I've made a lot of reconstruction :
- Total mode up to 27
- New feature : Show Trend Following ATF TWOMA Filtered By Trend Following Selected TF of FAST STOCH
- New feature : Show Trend Following ATF TWOMA Filtered By Trend Following Selected TF of FAST MACD
- New feature : Show Trend Following ATF TWOMA Filtered By Trend Following Selected TF of DRSI
- New feature : Show Trend Following ATF TWOMA Filtered By Trend Following Selected TF of RSIMA
- Trend following = non repaint arrows!
- Fixing algorithm of button
- Adding color level type
Sürüm 1.40 2023.04.11
In this new Version 1.40, I've made a lot of reconstruction :
- Total mode up to 23
- New feature : Show Trend Following All Timeframe of Two MA
- New feature : Show Trend Following All Timeframe of Double RSI
- New feature : Show Trend Following All Timeframe of RSIMA
- New feature : Show Trend Following Selected Timeframe of Two MA
- New feature : Show Trend Following Selected Timeframe of Double RSI
- New feature : Show Trend Following Selected Timeframe of RSIMA
- New feature : Show Trend Following Selected Timeframe of Dual Stoch
- New feature : Show Trend Following Selected Timeframe of Dual MACD
- Trend following = non repaint arrows!
- Fixing algorithm of mode 21 : Show Selected TF of STOCH,MACD,TWOMA,DRSI Filtered By Trend Following RSIMA
- Parameter values can be hide/show
Sürüm 1.30 2023.03.30
In this new Version 1.30, I've made a lot of reconstruction :
- Added dual stochastics dashboard monitor (fast stoch = stochastic 1 and slow stoch = stochastic 2)
- Added dual macd dashboard monitor (fast macd = macd 1 and slow macd = macd 2)
- Fixing MA Phase of RSIMA
- Change arrow code
- New feature : showing trend following arrows of stochastics and macd
- Dashboard monitor can be hide
Sürüm 1.20 2023.03.12
In this new Version 1.20, I've made a lot of reconstruction :
- Fixing daily arrow of MACD
- Fixing arrow of RSIMA
- New algo in determining the up and down arrows
- New feature : showing arrows of Stochastic, MACD, Two MA and RSIMA at once
- Adding the RSIMA 9TF dashboard monitor
- Beautify the dashboard monitor
Sürüm 1.10 2023.02.27
New version 1.10 with new feature available:
- Adding the ability to filter price action by all time frame (ATF) Two Moving Average
- Adding the ability to filter price action by all time frame (ATF) Double RSI
- Adding the value of Stochastic on all time frame
- Adding the value of CCI on all time frame