• Übersicht
  • Bewertungen
  • Diskussion
  • Neue Funktionen

MTF Precise Price Action Arrow Filtered

Wenn Sie oft Trades verlieren, weil Sie nur einen Indikator verwenden, dann probieren Sie dieses Handelstool aus. Dieses Handelstool verwendet mehr als einen Indikator. Ich beobachte oft Händler, die nur den RSI-Indikator verwenden. Sehr oft ist der Markt überverkauft, aber immer noch im Minus, oder der Markt ist überkauft, aber immer noch im Plus. Aus diesem Grund müssen Sie mehr als einen Indikator verwenden. Wir stellen die neue Version V 3.40 MTF PPAAF vor: Multi Time Frame Precise Price Action Arrow Filtered. Dieses Handelsinstrument verwendet verschiedene Indikatoren, um die Richtung der Marktbewegung zu stärken.

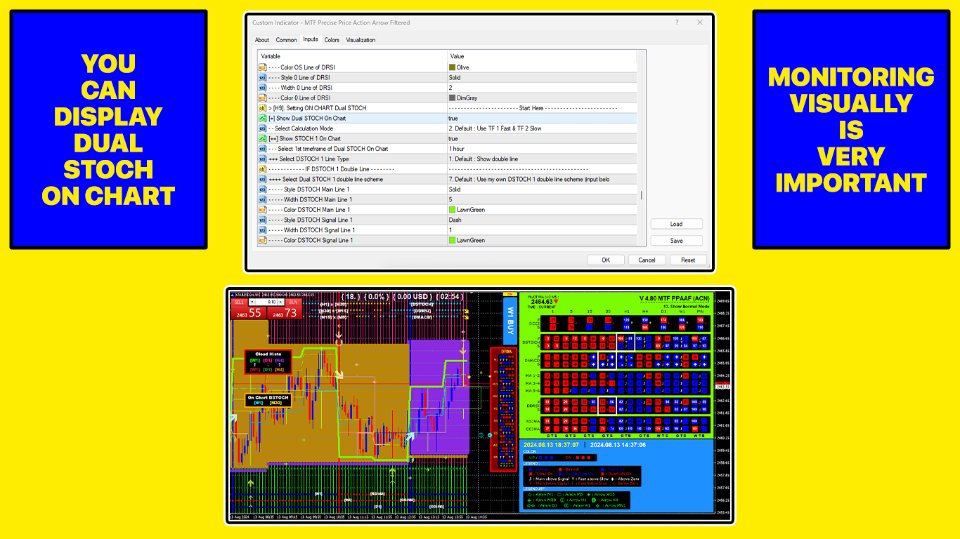
Der erste in diesem Handelstool verwendete Indikator ist Dual Stochastic. Hier verwende ich zwei Stochastiken, nämlich Fast Stochastic und Slow Stochastic. Bei Fast Stochastic gibt es eine Fast Stochastic-Hauptlinie und eine Fast Stochastic-Signallinie. Ebenso gibt es beim Slow Stochastic eine Slow Stochastic-Hauptlinie und eine Slow Stochastic-Signallinie. Der Schnittpunkt/die Kreuzung der Hauptlinie und der Signallinie bildet Aufwärts- und Abwärtspfeile.

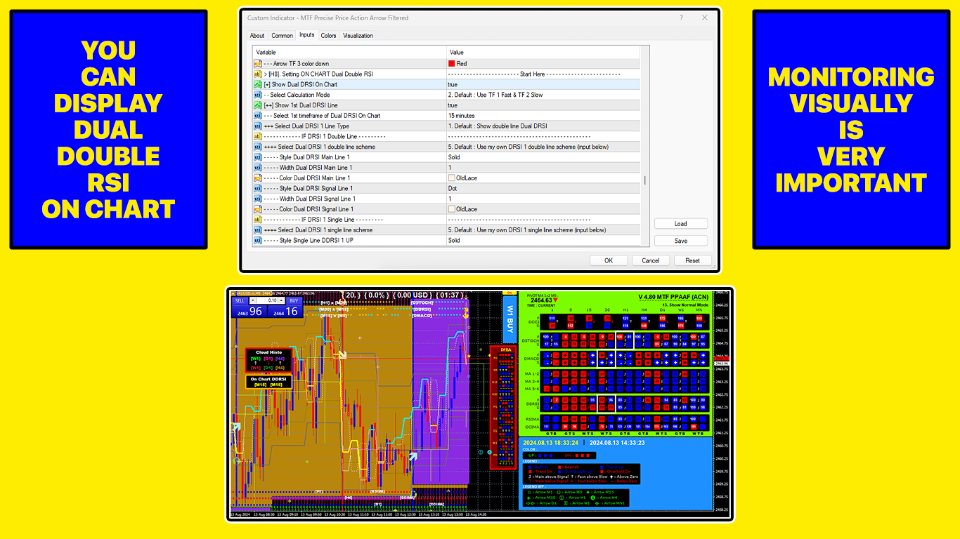
Der zweite Indikator ist Double RSI, nämlich schneller RSI und langsamer RSI. Der Schnittpunkt der beiden bildet einen Auf- und Ab-Pfeil.

Der dritte Indikator ist Double CCI, nämlich schneller CCI und langsamer CCI. Der Schnittpunkt der beiden bildet einen Auf- und Ab-Pfeil.

Der vierte Indikator ist Dual MACD. Ähnlich wie bei der dualen Stochastik gibt es hier den schnellen MACD und den langsamen MACD. Beim Fast MACD gibt es eine Fast MACD-Hauptlinie und eine Fast MACD-Signallinie. Ebenso gibt es beim Slow MACD eine Slow MACD-Hauptlinie und eine Slow MACD-Signallinie. Der Schnittpunkt der Hauptlinie und der Signallinie bildet Aufwärts- und Abwärtspfeile.

Der fünfte Indikator ist RSIMA. Wie der Name schon sagt, werden hier die Auf- und Abwärtspfeile durch den Schnittpunkt der RSI-Linie mit der Linie des gleitenden Durchschnitts (MA) bestimmt. Wenn RSI > MA, dann zeigt der Pfeil nach oben und umgekehrt.

Der sechste Indikator ist der Four MA. Hier verwende ich vier gleitende Durchschnittslinien, nämlich MA 1,2,3,4. Der Schnittpunkt der Linie MA 1 mit MA 2 und der Linie MA 3 mit MA 4 bildet Aufwärts- und Abwärtspfeile.

Den Ergebnissen meiner Recherche zufolge verlieren viele Händler, weil sie nur einen Indikator verwenden. Deshalb habe ich dieses Handelstool entwickelt. Die sechs oben erläuterten Indikatoren werden die Richtung der Marktbewegung stärken.

Um Marktbewegungen in Echtzeit zu sehen, habe ich dann verschiedene TOP-Funktionen hinzugefügt:

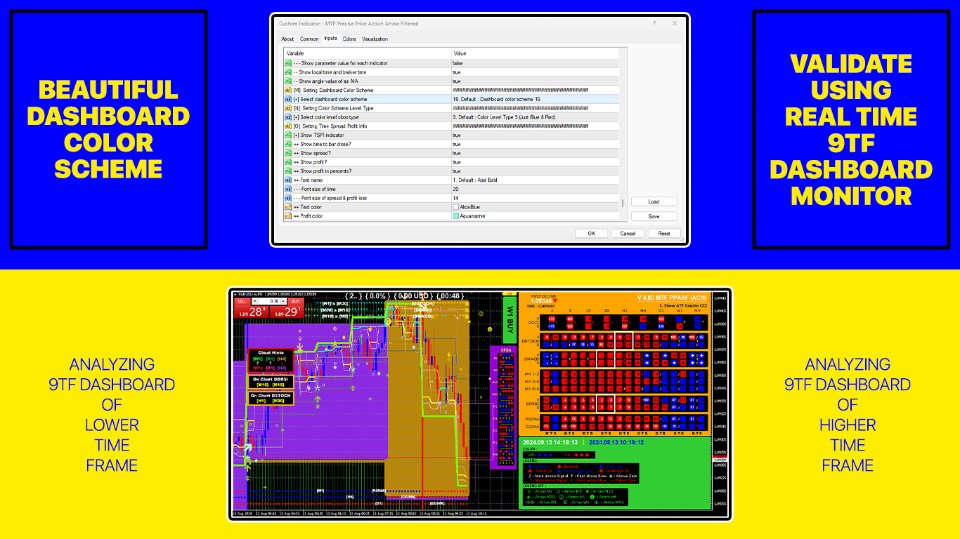
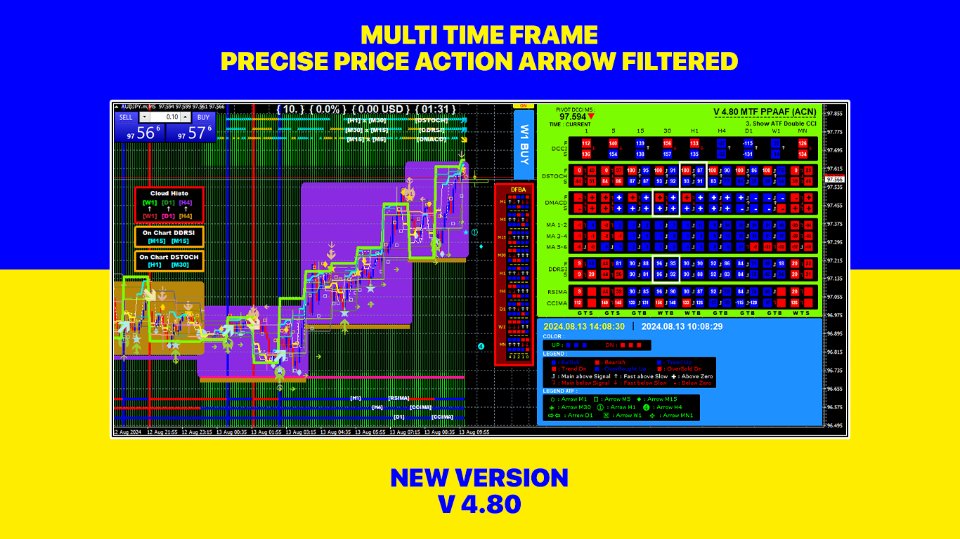
1. Echtzeit-9TF-Dashboard-Monitor. Mit dieser Funktion können Sie Marktbewegungen in Echtzeit vom 1-Minuten-Zeitrahmen bis zum MN1-Zeitrahmen sehen. Im Dashboard können Sie sehen, ob die Hauptlinie größer als die Signallinie ist oder nicht, ob die schnelle RSI-Linie größer als die langsame RSI-Linie ist oder nicht, ob die RSI-Linie ganz oben ist oder nicht usw. Sie Sie können auch sehen, ob die Stochastik-, RSI- und CCI-Werte überkauft oder überverkauft sind. Es ist sehr wichtig, das OBOS-Niveau (überkauft überverkauft) zu kennen.

2. Auf Kartenfunktionen. Die visuelle Überwachung ist wichtig. Aus diesem Grund habe ich die Funktionen On-Chart Dual Stochastic, On-Chart Four MA, On-Chart Double RSI und On-Chart True RSIMA hinzugefügt. Zu Ihrer Information: Die Platzierung der Stochastik im Diagrammfenster ist genauer als die Platzierung der Stochastik im Unterfenster. Wenn Sie den Schnittpunkt der Hauptlinie und der Signallinie in Echtzeit im Diagrammfenster beobachten, können Sie Ein- und Ausstiegspunkte sicher bestimmen. Mein Prinzip ist „Niedrig kaufen, teuer verkaufen“. Bitte denken Sie an diesen Grundsatz.

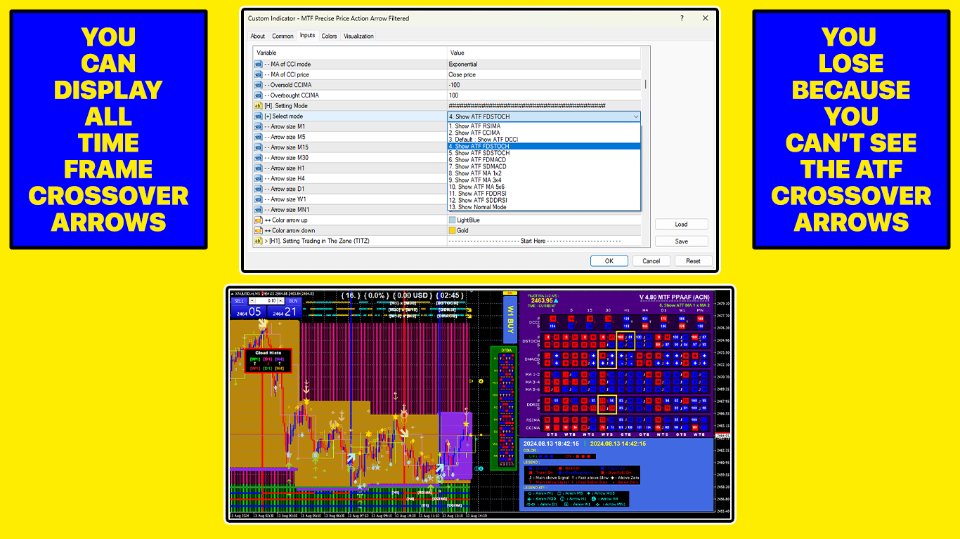
3. Dieses Handelstool kann ATF-Crossover-Pfeile (alle Zeitrahmen) anzeigen:

- ATF Fast stochastic (Modus 1) anzeigen, nämlich Fast stochastic main line x Fast stochastic signal line

- ATF Fast MACD (Modus 2) anzeigen, nämlich Fast MACD-Hauptlinie x Fast MACD-Signallinie

- ATF MA 1x2 anzeigen (Modus 3), nämlich gleitender Durchschnitt 1 x gleitender Durchschnitt 2

- ATF DRSI (Modus 4) anzeigen, nämlich Fast RSI x Slow RSI

- ATF RSIMA (Modus 5) anzeigen, nämlich RSI x MA

- ATF DCCI (Modus 6) anzeigen, nämlich Fast CCI x Slow CCI

- ATF Fast stochastic DRSI (Modus 7) anzeigen, nämlich Fast stochastic main line x Fast stochastic signal line zusammen mit Fast RSI x Slow RSI

- Handel in der Zone (Modus 8), nämlich dem Schnittpunkt der Linie MA 1 mit MA 2 und der Linie MA 3 mit MA 4.

4. Super Trend Arrows (STA). Es gibt zwei STA-Berechnungsmodi. Der erste ist STA, der auf der Kreuzung von RSI und MA basiert. Und zweitens ist die Kreuzung von Fast RSI und Slow RSI.

5. Trendfolge-STF (ausgewählter Zeitrahmen). Hier können Sie den Zeitrahmen ganz nach Ihren Wünschen wählen. Wenn sich zwei Linien kreuzen, erscheint ein Pfeil. Außerdem erscheint der Trendfolgepfeil, wenn die Winkel der beiden Linien alle positiv (nach oben) oder alle negativ (nach unten) sind.

6. 9TF-Trendbalkenfunktion, die auf dem STA-Modus 2 basiert. Es gibt fünf Trendbalken, die Sie beobachten können.

Der Trendbalken ganz rechts ist der neueste Echtzeit-Trendbalken (0). Gefolgt vom vorherigen Trendbalken (1,2,3,4). Dieser Trendbalken ist nützlich, um Richtungsänderungen von Markttrends vom vorherigen Zeitrahmen zum aktuellen Zeitrahmen zu beobachten.

7. Pivot-Ebenen-Funktion. Diese Funktion zeigt Ihnen das Niveau des offenen Kerzenpunkts an, an dem der Crossover stattgefunden hat. Pivot-Ebenen ac

Ich mag S & R nicht, nämlich Support und Resistance.


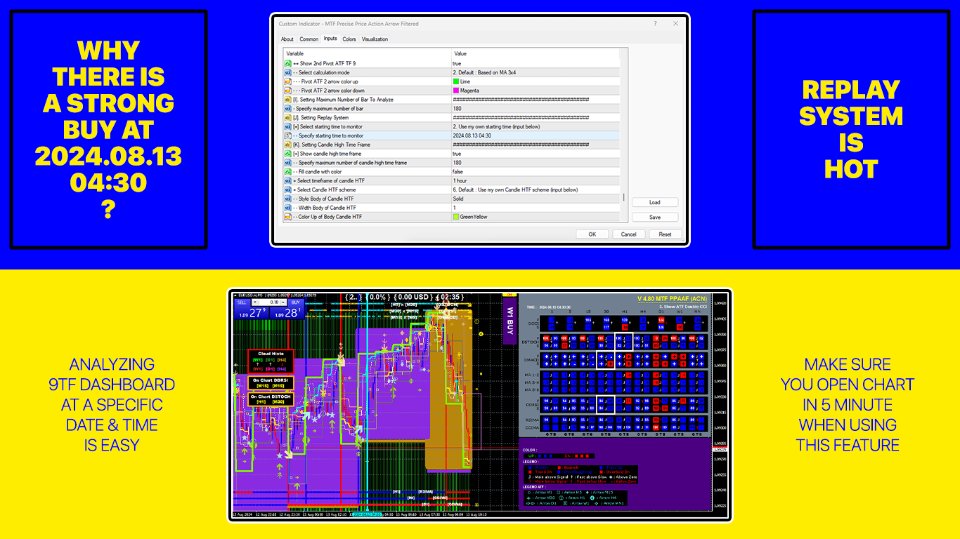
8. Wiedergabesystem. Mit dieser Funktion können Sie in der Zeit zurückgehen und den Zustand des 9TF-Dashboards an einem bestimmten Tag und zu einer bestimmten Uhrzeit beobachten. Angenommen, Sie möchten analysieren, warum der Markt am 11.10.2023 um 14:21:30 Uhr verkauft. Um diese Funktion zu nutzen, öffnen Sie Ihr Meta Trader 4-Diagramm in einem niedrigeren Zeitrahmen, zum Beispiel M5.


9. Candle HTF (High Time Frame). Mit dieser Funktion können Sie Marktbewegungen im oberen Zeitrahmen (z. B. H1) sehen, wenn Sie den Chart im unteren Zeitrahmen öffnen (ich öffne ihn gerne bei M5).


10. TSPI (Time Spread Profit Info). Mit dieser Funktion können Sie in Echtzeit die aktuelle Zeit, den Spread, den Gewinn/Verlust und den Prozentsatz des Gewinns/Verlustes sehen.


11. Ein-/Aus-Tastenfunktion. Mit dieser Funktion können Sie dieses Handelstool mit nur einem Klick ein- oder ausblenden. Interessant, oder?


12. 20 Dashboard-Farbschemata, aus denen Sie wählen können. Mit dieser Funktion können Sie eine Dashboard-Farbe auswählen, die der Farbe Ihres Diagramms entspricht.


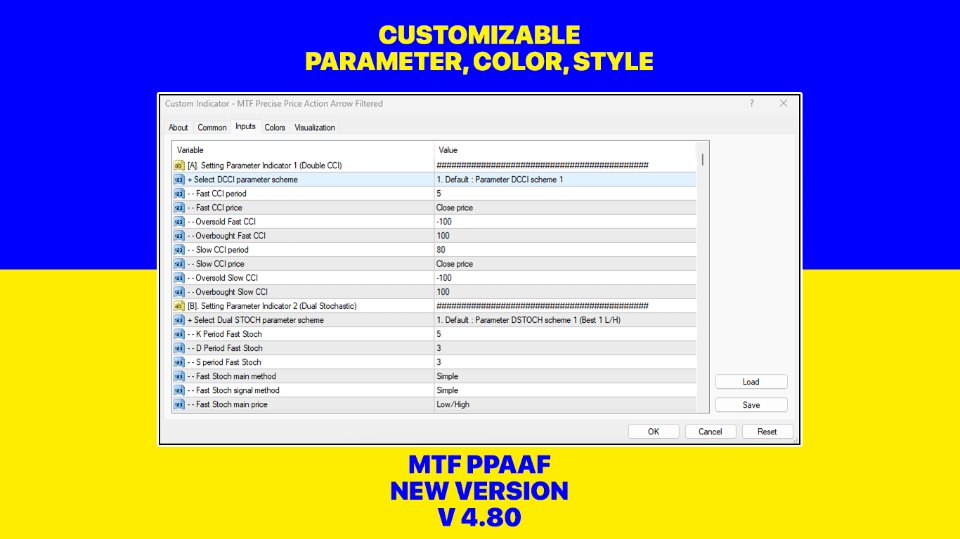
13. Anpassbare Parameter. Alle zur Berechnung der Indikatoren verwendeten Parameter können nach Ihren Wünschen angepasst werden. Sie können die stochastischen Parameter 14,3,3 oder 5,3,3 usw. verwenden. Oder Sie verwenden die Standardeinstellungen.


14. MTF, nämlich Multi Time Frame. Sie können einen Zeitrahmen nach Ihren Wünschen festlegen. Sie möchten beispielsweise die Dual-Stochastic-on-Chart-Funktion für die Zeitrahmen M5 und H1 aktivieren. Du kannst!


15. Nicht neu lackierte Pfeile (NRPA). Wenn sich zu irgendeinem Zeitpunkt zwei Linien schneiden, wird der Kreuzungspfeil angezeigt. Aufgrund der hohen Volatilität kommt es sehr häufig vor, dass sich die beiden Linien in den folgenden Sekunden und Minuten nicht schneiden. Dadurch verschwand der zuvor aufgetauchte Pfeil. Dies ist eine sehr wichtige Funktion. Denken Sie daran, dass bei hoher Volatilität der Pfeil, der zuvor nach oben zeigte, nach unten zeigen kann. Der zuvor aufgetauchte Pfeil könnte augenblicklich verschwinden. Deshalb ist meine Botschaft, die Validierung mithilfe des Echtzeit-9TF-Dashboard-Monitors durchzuführen!


16. Confluence 3TF-Funktion, d. h. 3TF Fast Stochastic Confluence, 3TF Fast MACD Confluence, 3TF MA 1x2 Confluence und 3TF DRSI Confluence. Mit dieser Funktion ist die Beobachtung von 3TF-Schnittpunkten (drei Zeitrahmen) sehr einfach. Das heißt zum Beispiel, wenn die schnelle stochastische Hauptlinie > die schnelle stochastische Signallinie im Zeitrahmen (M5, M15, M30) ist, dann erscheint ein AUFWÄRTS-Pfeil.


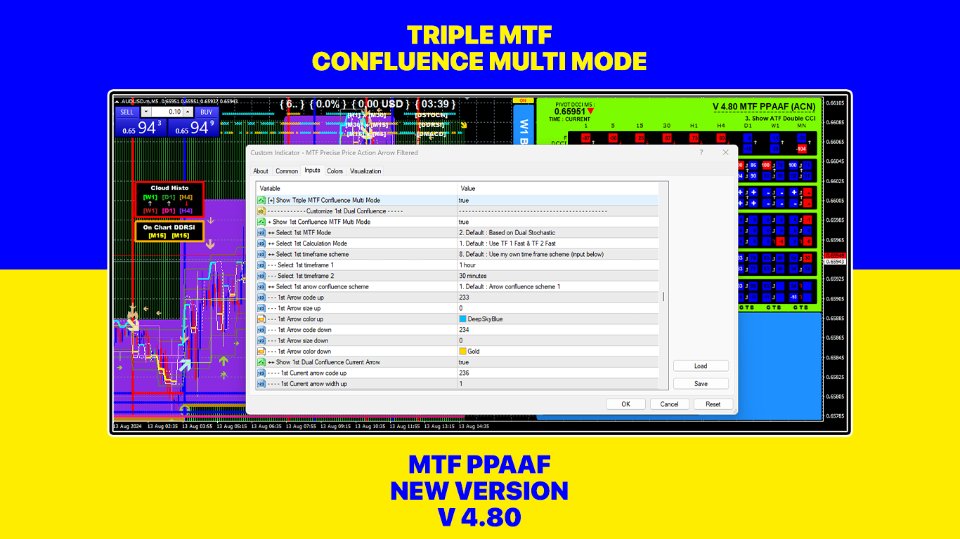
17. Konfluenz-Dual-Stochastic und Konfluenz-Dual-MACD. Wenn es bei dieser Funktion in der schnellen Stochastik und in der langsamen Stochastik eine Hauptlinie > Signallinie gibt, erscheint der AUFWÄRTS-Pfeil. Ebenso für Dual-MACD. Dies ist ein wirklich wichtiges Merkmal, um den Schnittpunkt zweier Stochastiken und zweier MACDs im gleichen Zeitrahmen zu beobachten.


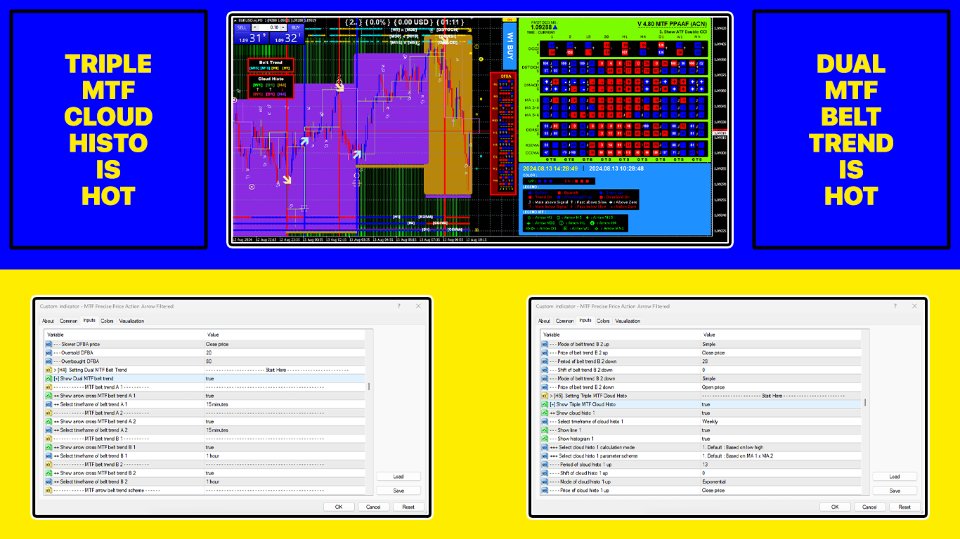
18. Trendgürtelfunktion. Diese Funktion dient zusätzlich zur Anzeige zweier gleitender Durchschnitte im Diagramm. Selbstverständlich können Sie einen Zeitrahmen ganz nach Ihren Wünschen festlegen.


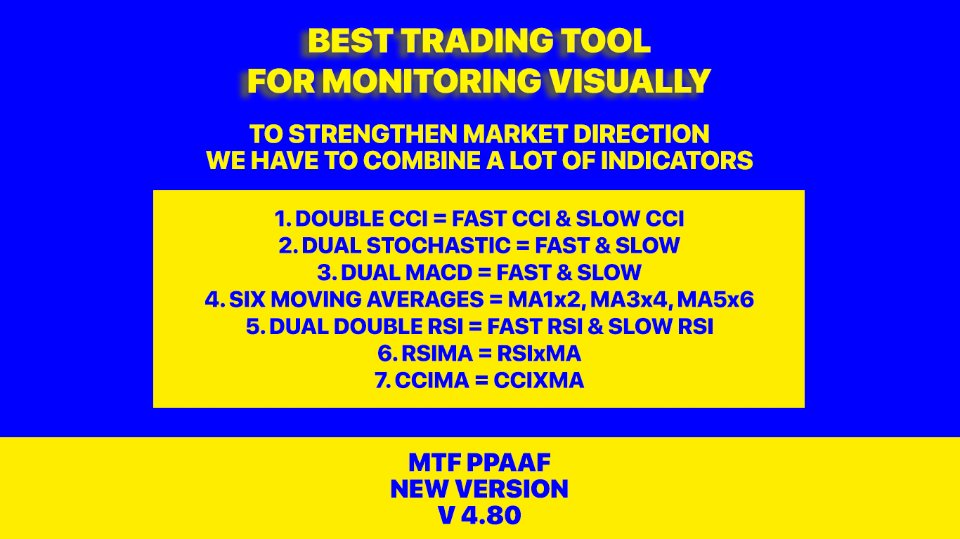
Die Verwendung nur eines Handelsindikators ist nicht sehr überzeugend. Deshalb kombinieren wir mehrere Indikatoren, um unsere Analyse der Marktrichtung zu stärken.


Die Preisaktionsbewegung kann dann mithilfe von 6 Indikatoren gefiltert werden:


RSIOMA

Dual MACD (Neue Version 1.3!)

Dual Stochastic (Neue Version 1.3!)

Doppeltes CCI (Neue Version 2.3!)

Vier gleitende Durchschnitte (Neue Version 1.6! Nicht nur zwei MA)

Doppelter RSI (Neue Version 1.2!)

Die Stärke der Richtung der Preisbewegung kann dann durch Überwachung des Echtzeit-9TF-Dashboards ermittelt werden.


Der 9TF-Dashboard-Monitor zeigt uns die Echtzeitdaten von Four Moving Average, RSIMA, Double RSI, Dual MACD, Dual Stochastic und Double CCI.


Ein-Klick-Schaltfläche, um den Indikator anzuzeigen oder auszublenden

9TF Echtzeit-Dashboard-Monitor

Überwachung von 9TF Four Moving Average, d. h. MA 1x2 und MA 3x4

Überwachung, ob die schnelle MA-Linie über oder unter der langsamen MA-Linie liegt

Überwachung des Winkels von schnellem MA und langsamem MA

Überwachung von 9TF Double RSI, d. h. Fast RSI und Slow RSI

Überwachung, ob die schnelle RSI-Linie über oder unter der langsamen RSI-Linie liegt

Überwachung von 9TF Dual MACD, d. h. schneller MACD (MACD 1) über oder unter langsamem MACD (MACD 2) und oben oder unten

Überwachung, ob die Haupt-MACD-Linie über oder unter der Signal-MACD-Linie liegt

Überwachung von 9TF Dual Stochastic, d. h. Fast Stochastics (Stochastik 1) über oder unter Slow Stochastics (Stochastik 2) und nach oben oder unten

Überwachung, ob die stochastische Hauptlinie über oder unter der stochastischen Signallinie liegt

Überwachung von 9TF Double CCI, d. h. der Position auf der OBOS-Linie und der aktuellen Bewegung

Überwachung von 9TF RSIOMA, d. h. RSI-Linie oberhalb oder unterhalb der MA-Linie

Möglichkeit, Parameter festzulegen und den Zeitrahmen nach Ihren Wünschen auszuwählen

Möglichkeit, Legenden ein-/auszublenden

Möglichkeit, die Anzahl der Balken zu erhöhen/verringern, der Standardwert ist 800 bar

Möglichkeit zur Auswahl von bis zu 20 Dashboard-Farbschemata

Dieser Indikator kann den RSIMA-Pfeil für den von Ihnen gewählten Zeitrahmen anzeigen

Dieser Indikator kann den MACD-Pfeil für den von Ihnen gewählten Zeitrahmen anzeigen

Dieser Indikator kann den stochastischen Pfeil für den von Ihnen gewählten Zeitrahmen anzeigen

Dieser Indikator kann den MA 1x2- und MA 3x4-Pfeil für den von Ihnen gewählten Zeitrahmen anzeigen

Dieser Indikator kann den Doppel-RSI-Pfeil für den von Ihnen gewählten Zeitrahmen anzeigen

Dieser Indikator kann den Doppel-CCI-Pfeil für den von Ihnen gewählten Zeitrahmen anzeigen

Pfeil nicht neu lackieren
Empfohlene Produkte
Black series MT4
Dmitriy Kashevich
1 (1)
Black series MT4 - The indicator is designed for trading on binary options with Timeframe M1-M5-M15 Multicurrency (Works on cryptocurrency and currency pairs) The signal appears when the candle opens Up to 90% correct signals There is no signal redrawing at all Can be used with other indicators. Good for scalping! In Settings there is: -Indicator working methods -I Allert Arrow color Red signal down Blue signal up Also watch the video how the indicator works and signals
Smooth price for Monarch MT4
Konstantin Gruzdev
3.67 (3)
The Smooth Price technical indicator is used for plotting a smoothed line as close to the price of the financial instrument as possible, and serves to eliminate its noise components. The indicator is part of the Monarch trading system, but here it is presented as an independent technical analysis tool. The indicator is based on the cluster digital filter , which, unlike the ClusterSMA , is applied directly to the price time series. Smooth Price does not redraw (except the very last, zero bar) an
BinaryUniversal
Andrey Spiridonov
BinaryUniversal is a signal indicator for binary options and Forex. In its work, the indicator uses a complex algorithm for generating signals. Before forming a signal, the indicator analyzes volatility, candlestick patterns, important support and resistance levels. The indicator has the ability to adjust the accuracy of the signals, which makes it possible to apply this indicator for both aggressive and conservative trading. The indicator is set in the usual way, it works on any time period and
El indicador "MR BEAST ALERTAS DE LIQUIDEZ" es una herramienta avanzada diseñada para proporcionar señales y alertas sobre la liquidez del mercado basándose en una serie de indicadores técnicos y análisis de tendencias. Ideal para traders que buscan oportunidades de trading en función de la dinámica de precios y los niveles de volatilidad, este indicador ofrece una visualización clara y detallada en la ventana del gráfico de MetaTrader. Características Principales: Canal ATR Adaptativo: Calcula
Towers
Yvan Musatov
Towers - Trend indicator, shows signals, can be used with optimal risk ratio. It uses reliable algorithms in its calculations. Shows favorable moments for entering the market with arrows, that is, using the indicator is quite simple. It combines several filters to display market entry arrows on the chart. Given this circumstance, a speculator can study the history of the instrument's signals and evaluate its effectiveness. As you can see, trading with such an indicator is easy. I waited for an a
NostradamusMT4
Andrey Spiridonov
1 (1)
NostradamusMT4 is a powerful indicator from the set of professional trader. The indicator is based on Andrei Spiridonov's original price calculation method (ESTIMATED PRICE) for the current candle price. Advantages The indicator does not redraw. It works on any timeframes. Works with any trading instruments. Perfectly suitable for scalping and trading binary options. Parameters Color - color of the ESTIMATED PRICE FUTURE line. How to work with the indicator The indicator forms the ESTIMATE
BinaryScalping
Andrey Spiridonov
BinaryScalping is a professional indicator for trading binary options and scalping. The algorithm of the indicator is based on the calculation of pivot points for each time period separately, the location of the price of the trading instrument relative to the pivot points is analyzed and the probability of a trading operation is calculated. The indicator has a built-in filter of trading signals based on the global trend. The indicator is installed in the usual way and works with any trading inst
Der Indikator erstellt aktuelle Notierungen, die mit historischen verglichen werden können, und auf dieser Grundlage eine Preisbewegungsprognose erstellen. Der Indikator verfügt über ein Textfeld zur schnellen Navigation zum gewünschten Datum. Optionen: Symbol - Auswahl des Symbols, das der Indikator anzeigen soll; SymbolPeriod - Auswahl des Zeitraums, aus dem der Indikator Daten aufnimmt; IndicatorColor - Indikatorfarbe; HorisontalShift - Verschiebung der vom Indikator gezeichnet
VR Cub
Vladimir Pastushak
VR Cub ist ein Indikator für den Erhalt hochwertiger Einstiegspunkte. Der Indikator wurde entwickelt, um mathematische Berechnungen zu erleichtern und die Suche nach Einstiegspunkten in eine Position zu vereinfachen. Die Handelsstrategie, für die der Indikator geschrieben wurde, hat sich seit vielen Jahren bewährt. Ihr großer Vorteil liegt in der Einfachheit der Handelsstrategie, die es auch unerfahrenen Händlern ermöglicht, erfolgreich damit zu handeln. VR Cub berechnet Positionseröffnungspunkt
The indicator for determining key patterns for the BBMA strategy will perfectly complement the Fibo Musang strategy, and can also be used as an independent tool. IMPORTANT! Contact me immediately after purchase to receive the second file! If you have any questions, I will help you deal with the indicator. Designed to save market analysis time; Sends push notifications to the phone when key moments of the strategy have arisen (Extrem A, Csak, cross the BB line with a candle) Advantages Easy to u
Skalping-Sofortanzeige. Ein Signal zum Kauf oder Verkauf zusammen mit dem Basiswert des Indikators wird durch den Pfeil gegeben. Als starkes Signal gilt, wenn der Pfeil und der Kellerindikator, der vier Zeitrahmen anzeigt, in der Vorhersage übereinstimmen. Dieser Indikator enthält viele Algorithmen und Aufgaben, die auf ein Ergebnis reduziert wurden, das der Skalping-Instant-Indikator liefert, nämlich den Händler über die Richtung des Marktes informiert. So gibt er 1. Scalping-Signal (A
Sharp Scalper
Mazin Salim Said Ba Abbad
The “Sharp Scalper” indicator is high-frequency trading tool designed for quick, short term trades in the forex market. It focus on identifying rapid price movement and generating signals for best entry. This indicator is known for its ability to capture small profit opportunities multiple times throughout the day making it ideal for scalpers looking to capitalize on market volatility. The” sharp scalper” indicator employs advance algorithms to detect market trends and fluctuation, helping trade
Smart Reversal Signal  is a professional indicator for the MetaTrader 4 platform; it has been developed by a group of professional traders. This indicator is designed for Forex and binary options trading. By purchasing this indicator, you will receive: Excellent indicator signals. Free product support. Regular updates. Various notification options: alert, push, emails. You can use it on any financial instrument (Forex, CFD, options) and timeframe. Indicator Parameters Perod - indicator calcula
Strength and weakness of currencies : Shows the currency status at any time, values between 50 and -50 are neutral, everything outside indicates a trend change  Waves : Current state of waves, daily, weekly monthly and yearly Recommended volume for trading a specific number of waves Yearly High Low Drawn waves on which the market will react in advance, without redrawing Yearly candle with bonus levels used to display deviations  For more info contact me
This is the complete REX package. It consists of the lite, pro and ULTRA version.  Perfect for beginners and intermediates. REX complete is 100% non repaint. The strategy is based on a mix of different strategies, statistics, including pivot points, oscillators and patterns.  As the trading idea consists of a variety of some classic indicators like Momentum, Williams Percent Range, CCI, Force Index, WPR, DeMarker, CCI, RSI and Stochastic, it is clear that the fundamental indicators have being
ReboltDelta
David Theodore Caro-greene
Rebalance Overlay Technology (Rebolt) enables the trader to visualize the flow of money from one chart to another chart. Rebolt Delta (ReboltDelta) indicates the probable price change that will occur in the target chart based on changes in the source chart. ReboltDelta is designed for use in cooperation with Rebolt Probability. La tecnología de superposición de reequilibrio (Rebolt) permite al operador visualizar el flujo de dinero de un gráfico a otro gráfico. Rebolt Delta (ReboltDelta) indica
Get rid of trading confusion and embrace stable income! Are you still worried about finding a low-risk and stable profit method? Are you still anxious about judging the market direction and controlling the risk of placing orders? The new cross-platform arbitrage indicator helps you easily achieve stable returns! Accurately capture arbitrage opportunities without you having to worry! The cross-platform arbitrage indicator is a powerful tool that can monitor the price differences of the same finan
PZ Trend Trading
PZ TRADING SLU
4.8 (5)
Trend Trading ist ein Indikator, der so weit wie möglich von den Markttrends profitiert, indem er Pullbacks und Breakouts zeitlich festlegt. Sie findet Handelsmöglichkeiten, indem sie analysiert, was der Preis während etablierter Trends tut. [ Installationsanleitung | Update-Anleitung | Fehlerbehebung | FAQ | Alle Produkte ] Handeln Sie mit Zuversicht und Effizienz an den Finanzmärkten Profitieren Sie von etablierten Trends, ohne ins Wanken zu geraten Profitable Pullbacks, Ausbrüche und vor
Owl smart levels
Sergey Ermolov
4.58 (55)
MT5-Version  |  FAQ Der   Owl Smart Levels Indikator   ist ein komplettes Handelssystem innerhalb eines Indikators, der so beliebte Marktanalysetools wie die   fortschrittlichen Fraktale von Bill Williams , Valable ZigZag, das die   richtige Wellenstruktur   des Marktes aufbaut, und   Fibonacci-Levels , die die genauen Einstiegslevels markieren, enthält in den Markt und Orte, um Gewinne mitzunehmen. Detaillierte Strategiebeschreibung Anleitung zur Verwendung des Indikators Berater-Assistent im
WanaScalper MT4
Isaac Wanasolo
1 (1)
A scalping indicator based on mathematical patterns, which on average gives signals with relatively small SL, and also occasionally helps to catch big moves in the markets (more information in the video) This indicator has three main types of notifications: The first type warns of a possible/upcoming signal on the next bar The second type indicates the presence of a ready signal to enter the market/open a position The third type is for SL and TP levels - you will be notified every time price r
"Trend Finder" is a trend trading strategy that combines market noise filtration and all necessary functions in one tool! The system automatically displays entry and exit points using arrows. Only one parameter is sufficient for configuration. It offers simple, intuitively understandable, and effective trend detection. The intelligent algorithm of the "Trend Finder" indicator identifies potential market reversal points. Often, a good trend can be visually observed on the price chart. However, a
Was den teilnehmern erlaubt, war automatisiertes handelsinstrument in einer einer reihe Von methoden und indikatoren definierten methoden. Es bietet eine vielzahl Von geschäftsmöglichkeiten, die auf fehlerfreie transaktionen ausgelegt sind und jedes geschäft durch eine strenge einstiegsstelle neu starten. Die strategie hat sich bereits auf dem realen markt für ein ganzes jahr als niedrigh-live-signal erwiesen.Gleichviel ob ungelehrte Oder erfahrene händler, die heuschrecken bietet mir außergewö
Shark Surfer is a new generation indicator applying a well-established trend-following trading. The product is good both for scalping, as well as medium- and long-term trading. Shark Surfer analyzes a selected symbol and shows the recommended market entry, take profit and stop loss levels. Shark Surfer trades on all symbols and timeframes. It also features email and push notifications concerning the new trading signals. The indicator searches for suitable market entry points on an already formed
DMAX pro
Danny Teoh Kok Keong
DMAX SIGNAL IS VERY POWERFUL TOOL TO HELP YOU ENTRY,ITS CAN DETECT OVERSOLD AND OVERBOUGHT IN FOREX MARKET. ITS CAN TRADE 24 FOREX PAIR IN MARKET, 80% ACCURATE RESULT. MANY TRADER FAIL BECAUSE OF ENTRY POINT AND EXIT POINT , SIGNAL OF DMAX WILL GIVE VERY GOOD SIGNAL TO LET YOU KNOW WHERE TO ENTRY AND EXIT.  RISK MANAGEMENT IS VERY IMPORTANT IN TRADING FOREX, PLEASE DONT RISK OVER 5% PER TRADE IS FORE MARKET
Infinity Trend Pro
Yaroslav Varankin
1 (1)
This is a trend indicator without redrawing Developed instead of the binary options strategy (by the color of the Martingale candlestick) Also works well in forex trading When to open trades (binary options) A signal will appear in the place with a candle signaling the current candle It is recommended to open a deal for one candle of the current timeframe M1 and M5 When a blue dot appears, open a deal up When a red dot appears, open a trade down. How to open trades on Forex. When a signal is rec
Diamond Grail
Dmitriy Kashevich
The universal indicator Diamond Grail which received such a name is not so simple! The indicator has been tested for over a year by our experts! One of the best arrow indicators that is perfect for binary options and forex trading, If you trade on binary options, the best ragtime for it is from 3 minutes to a maximum of 5 minutes An arrow appears on the previous candle. If you trade forex, then the opening time from candle to candle Forex result From 40 To 1324 pips! Profitability
Trendiness Index
Libertas LLC
5 (3)
"The trend is your friend" is one of the best known sayings in investing, because capturing large trendy price movements can be extremely profitable. However, trading with the trend is often easier said than done, because many indicators are based on price reversals not trends. These aren't very effective at identifying trendy periods, or predicting whether trends will continue. We developed the Trendiness Index to help address this problem by indicating the strength and direction of price trend
Gyroscopes
Nadiya Mirosh
Gyroscope        professional forex expert   (for EURUSD, GBPUSD, USDJPY, AUDUSD, USDCHF, EURGBP, EURJPY, NZDUSD, USDCAD, EURCHF, AUDJPY, CADJPY pairs)   alyzing the market using the Elliot Wave Index. Elliott wave theory is the interpretation of processes in financial markets through a system of visual models (waves) on price charts. The author of the theory, Ralph Elliott, identified eight variants of alternating waves (of which five are in the trend and three are against the trend). The mo
ReboltP
David Theodore Caro-greene
Rebalance Overlay Technology (Rebolt) enables the trader to visualize the flow of money from one chart to another chart. Rebolt Probability indicates the probability that money has flowed from one chart to another chart for a specified length of time over a number of intervals specified by the user. When Rebolt reads Cyan or Blue these are buying signs good for the length of time specified by the user or until a conflicting signal arises. When Rebolt reads Violet or Red there are selling signs
PipFinite Exit EDGE
Karlo Wilson Vendiola
4.88 (161)
Did You Have A Profitable Trade But Suddenly Reversed? In a solid strategy, exiting a trade is equally important as entering. Exit EDGE helps maximize your current trade profit and avoid turning winning trades to losers. Never Miss An Exit Signal Again Monitor all pairs and timeframes in just 1 chart www.mql5.com/en/blogs/post/726558 How To Trade You can close your open trades as soon as you receive a signal Close your Buy orders if you receive an Exit Buy Signal. Close your Sell orde
Käufer dieses Produkts erwarben auch
JULY OFFER 80% OFF next price for unlimited version will be 17000$. This is the only time you can get this institutional and professional indicator at this price for unlimited version. Don't dare to miss this. The tool I am about to introduce to you you can't compare it with other tools due to its strategy and accuracy level in predicting the next price directional movement . This tool is designed for serious traders who have decided to make a difference through trading. Be the next person to wi
Der TRANSACTION SPEED ist der hochwertigste Indikator, der anzeigt, wo und wann sich große Aufträge auf dem Markt ansammeln und welche Vorteile dies mit sich bringt. Er erkennt Trendänderungen in einem sehr frühen Stadium. Er ist gleichzeitig ein Indikator und ein Handelssystem. Das Konzept ist einzigartig und unglaublich profitabel. Im Devisenhandel wird das Tick-Volumen irreführenderweise als Volumen bezeichnet. In Wirklichkeit handelt es sich um die Preisveränderung pro Zeiteinheit, was de
The indicator of a Professional Trader is an arrow indicator for predicting the direction of price movement. I have been working on this indicator since 2014. You can use this indicator as your main indicator, use its entry signals, and use it as your only indicator to find entry points. About the product: Recommended TF [H4-D1-W1]   . The indicator predicts the direction of the next candle. Fits a variety of tools; Flexibility in settings for different instruments and intervals through the
WARNING: PRICE IS SUBJECT TO RISE AT ANY TIME. GET YOUR COPY TODAY TO AVOID MORE COST! Dear Traders I am so glad to introduce to you my other tool called the Forex Sniper Entries Indicator. This tool is designed to help serious traders and investors capture big moves in the currency price movements. The philosophy behind this tool is all about winning big and riding the price movement from its beginning until the maximum point. We want to capture those big moves in both down and up markets as mu
WARNING!! THIS SWORD IS TOO SHARP!    ONLY 10 COPIES LEFT FOR THE NEXT PRICE TO BE 8,000$ FOR UNLIMITED PLAN. Dear traders I am very glad once again to introduce to you my other tool called "Forex Sword Indicator". In short this tool is meant to give you an edge over the market that you have been waiting for  so long. Now, here it is. It is a very very simple tool but yet a dangerous sword. I call it a  Holy grail indicator!. I will not talk a lot about this tool. Just let the tool speak by itse
Limitless MT4
Dmitriy Kashevich
Limitless MT4 ist ein universeller Indikator, der für jeden Anfänger und erfahrenen Trader geeignet ist. funktioniert auf allen Währungspaaren, Kryptowährungen, Rohstoffen Limitless MT4 - bereits konfiguriert und erfordert keine zusätzliche Konfiguration Und jetzt die Hauptsache Warum grenzenloses MT4? 1 völliger Mangel an Neuzeichnung 2 zwei Jahre Test durch die besten Handelsspezialisten 3 Die Genauigkeit der korrekten Signale übersteigt 80% 4 schnitten während der Pressemitte
MT My Way
Issara Seeboonrueang
Best strategy,  Easy trade ,  Support of version update in the future MT My Way:  For new traders with no experience It is a very simple trade. Open the order when there is signal and close the order when there is exit or found the next opposite signal. You can set Stop Loss at the arrow and set the distance at Arrow Gap. For experienced traders, It will be very easy to trade. indicator for trade by yourself TRADE: Forex  TIME FRAME:  All Time Frame (Not M1) SYMBOL PAIR: All Sy
IA Trendx3 PRO
Marco Aurelio Santos Costa
What if God Created a Trade System? No miracles... Just see how mathematics can be effective in the market. We managed to combine technical analysis / price action into indicators, creating the best setup for trading, be it in Forex, Indices, or stocks. It took us 2 years to create something that really works, and now it's time for you to discover it. TrendX3 is a revolution in trend analysis. Based on advanced algorithms and real-time data, it provides valuable insights so that you can make inf
Weddell Pro
Dmitriy Kashevich
Weddell Pro is a good trading tool that is suitable for both a beginner and an experienced trader. It can be used both separately and combined with other strategies and indicators Configured for currency pairs was tested several times on cryptocurrency but did not show a high result Currency pairs USD/EUR AUD/CAD GBP/USD Showed itself very well here The percentage of correct transactions is above 68%, which does not make it perfect and bad Doesn't draw or disappear The red arrow sho
Automatic, live & interactive picture of all trendlines. Assign push, email and sound alerts to the lines of your choice and be informed about price rollback, breakout, rollback after breakout, number of rollbacks, line expiration by double breakout. Correct, drag or delete the lines and interactively tune the line system. https://youtu.be/EJUo9pYiHFA . Chart examples https: //www.mql5.com/en/users/efficientforex Price Interaction Events All events are effective immediately and only after on
The indicator displays the probable ( Support and resistance ) levels. The indicator draws horizontal and trend levels of support and resistance. The indicator settings: Trends - the mode for displaying trend lines or horizontal lines of support and resistance Yes - display trend lines only No - display horizontal lines only UseResource - use the resources built into the indicator. Yes - use the ZigZag indicator from the resources of the product. No - use a custom ZigZag indicator. HistoryBar -
The [GRAFF] III manual trading system is based on multiple MetaTrader (MT4) indicators. Together, the entire PACK of GRAFF III indicators makes an advanced trading tool. The system consists of over 20 different custom-built indicators which have been carefully selected and tested in the long term to produce strong and efficient trading signals. The particular indicators are based on different mathematical formulas, so the entire system is calibrated to remove false signals from its own indicator
You can fins our other products from link : https://www.mql5.com/en/users/drbastem/seller   Also, you can ask all your questins from email : haskayafx@gmail.com or mobile : +90 530 867 5076 or @MehmetBastem    on telegram application This indicator is used to determine the trend. Standard Osma indicator is used. It has the indicator warning system: beep, e-mail and has three types of alerts, including messages to mobile phone. It shows the best performance on the chart of 5 minutes. When the
You can fins our other products from link : https://www.mql5.com/en/users/drbastem/seller   Also, you can ask all your questins from email : haskayafx@gmail.com or mobile : +90 530 867 5076 or @MehmetBastem    on telegram application This indicator is used to determine the trend. Standard Three Moving Average and ADX indicators are used. It has the indicator warning system (audio, e-mail) and three types of alerts, including messages to mobile phone. It shows the best performance on M5. When
This indicator is used to determine the trend. Standard Three Moving Average and ADX indicators are used. It has the indicator warning system (audio, e-mail) and three types of alerts, including messages to mobile phone. It shows the best performance on M5. When the trend value reaches the value set, the warning system is activated. This indicator works only with Forex symbols. Inputs SoundAlarm = true - Sound Alert Sendmail=true - Send an e-mail in case of a buy or sell signal Sendnotificatio
You can fins our other products from link : https://www.mql5.com/en/users/drbastem/seller   Also, you can ask all your questins from email : haskayafx@gmail.com or mobile : +90 530 867 5076 or @MehmetBastem    on telegram application This indicator is used to determine the trend. Standard MACD indicator is used. It has the indicator warning system: beep, e-mail and has three types of alerts, including messages to mobile phone. It shows the best performance on the chart of 5 minutes. When the
Regression Channel Tools" basiert. Durch die Nutzung dieses Tools können Trader eine außergewöhnliche Kontrolle über ihren Chart-Regression-Kanal erlangen und fundiertere Handelsentscheidungen treffen. Das Regression Channel Tool ist ein leistungsstarkes Instrument im Werkzeugkasten eines Traders. Es soll wertvolle Einblicke in Preisentwicklungen und potenzielle Unterstützungs- und Widerstandsniveaus bieten. Das Tool eignet sich besonders gut zur Visualisierung von Korrekturwellen innerhalb eine
Green Wall Arrows
Daniel Luchinger
1 (1)
The Name Green Wall : Arrows hits a lot of TP, by changing the idea of non using SL as something bad, but instead use Small TP and a lot of free Margin and Patience. Use micro TP and a lot of Free Margin with this indicator on Forex. It also can be used with Binary Options. This strategy is intended to be traded Manually. This Indicator runs on Open Bar, arrows will delete when price are against it. The only Indicator Parameter is Alerts true/false, all the rest is included inside the code. Arro
Golden Monowave
Ahmed Mohamed Ali
Golden Monowave is monowave indicator, the monowave theory is one of Elliott wave approach and one of most complicate and accurate method. Golden Monowave can shortcut many major steps to identify and describe the monowave. It works on any timeframe and with any trading instrument, including currencies, indices, futures, etc. Input Parameters initial_Bars - set the initial number of bars to calculate. wave_color - select the color of the wave. label_color - select the color of labels. temp_lab
Ticks Size
Viktor Kolmakov
This indicator displays in a separate window the difference between the number of points which increased the price, and the number of points that decreased the price during the time interval specified in the settings. The time interval for calculation is expressed as the number of bars of the chart the indicator is attached to. This approach allows you to evaluate the movement direction (growth or fall) of the instrument's price, the strength of the movement and the size of the movement in point
BinaryIndicator
Andrey Spiridonov
BinaryIndicator is a highly accurate indicator for trading binary options. It shows excellent results in scalping. This indicator is based in multifactor analysis of trend indicators, as well as confirmation oscillators, which in the end gives an increased accuracy of signals. Advantages of the indicator Increased accuracy of signals. Excellent results when trading binary options with a short expiration time from M30 to M1 . It works on any timeframes. Works with any trade symbols. Parameter
Primus Trading Engine is a trading system that combines price action,ratio based indicators & custom indicators to create this leading indicator with a multi-timeframe approach to give you high probability trade setups for forex,CFD cash/futures,metals & binary option to assist in making predictions on what is MOST likely to happen in the market Main Chart Features Price Action Signal-Arrow displayed on a specific bar;NOT buy/sell arrow;DOES NOT repaint;Bullish arrow on a bullish bar,price is l
This is the FXTraderariel PowerTrend . It compute a trendfollowing system based on it own algorithm. It gives you a buy or sell signal based on the trend. It based on the Supertrend, but our Version is not repainting. Furthermoore we added some Improvements and you can get an Arrow, Push or Alert when the trend changes. Depending on the settings it and trading style, it can be used for scalping or long-term trading . The indicator can be used on every time frame , but we advise to use it on H1
Sweet Waffle
Christophe Godart
The arrows are calculated with: -     2 Parabolic  parameters -     2 ADX parameters -     4 Stochastic parameters We recommend to combine it with Parabolic, ZigZag or Elliot waves indicator. Always trade the trend! If you make sure to draw your trend lines and support/resistance zones you will just have to wait for the signal to appear. Take the trade. For Binary Options it is advisable to set the expiry time to 5-15 min in M1 chart. THIS INDICATOR IS ZERO REPAINT Best assets to trade: -
Let´s try to make some real money! Call me profit addicted. I thought why not try to make THE dream come reality. With discipline, a clear strategy and this indicator I focus on entering the perfect trades. This indicator is very easy to use as you will get perfect entry points for Put or Call trades. The arrows are calculated with: -     Momentum  parameters -     Candle stick patterns -     Fundamental Price action We recommend to combine it with Parabolic, ZigZag or Elliot waves indic
SystemPro
Andrey Spiridonov
SystemPro - a professional indicator, is a full-fledged, self-sufficient author's strategy for working in the Forex market. A unique algorithm for analyzing the foreign exchange market is based on the calculation of reference points for three different time periods. Thus, the indicator simultaneously analyzes the long-term, medium-term and short-term price behavior before issuing a signal. The indicator is set in the usual way and works with any trade symbols. Advantages of the indicator It i
Floating Nest
Dzmitry Chentsou
1. What is Floating Nest? This indicator is designed to automate the construction of decision zones (can act as support-resistance levels) according to the Floating Socket strategy. The same indicator allows you to significantly reduce the time when analyzing the behavior of prices in decision areas on historical data. It works on any currency pairs. Time frame: M1-H1. The NEST trading system (Nest) is notable for its simplicity and efficiency when trading currencies, stocks, indice
Dark Sniper
Dmitriy Kashevich
Dark Sniper pointer indicator.  Complete absence of redrawing   The percentage of correct indicator forecasts depends on your settings; the default is period 7 (performed better) The arrow indicates the direction of the next candle and the possible direction of the trend in the future.  Suitable for small timeframes m1 and m5  It is recommended to open transactions from 1 to 2 candles.  The signal appears on the current candle. Open a trade on the next one since the signal is being ge
Pisces TheProfitZone "Pisces TheProfitZone MT4 Indicator Powered byFxGangster" This indicator will calculate new support and resistant zone everyday, and that give us a trading zone such as thats telling us TP and SL, So it still telling us for where should the price will go reach? Fore Example. Uptrend : If Price can stay upper a Line and price close higher above a Line, then the price will continue go up to reach next Line. Downtrend : If Price can't pass to stay upper a Line and the pr
Weitere Produkte dieses Autors
Die Analyse mehrerer Zeitrahmen eines Währungspaares in einem Fenster kann Sie verwirren. Um mehrere Zeiträume zu analysieren, benötigen Sie zuverlässige Indikatoren. Einer von ihnen verwendet die 9TF-MACD-Kurve. Ich habe Tag und Nacht daran gearbeitet, Code zu erstellen, der einfach, aber zuverlässig ist und alle neun Zeitrahmen in nur einem Indikator abdeckt. Schauen wir uns einige der Vorteile dieses Indikators an: Buntes Histogramm. Die Farbe der Kurve in jedem Zeitrahmen untersch
Die Analyse mehrerer Zeitrahmen eines Währungspaares in einem Fenster kann Sie verwirren. Um mehrere Zeiträume zu analysieren, benötigen Sie zuverlässige Indikatoren. Einer von ihnen verwendet 9TF STOCH RSI. Ich habe Tag und Nacht daran gearbeitet, Code zu erstellen, der einfach, aber zuverlässig ist und alle neun Zeitrahmen in nur einem Indikator abdeckt. Schauen wir uns einige der Vorteile dieses Indikators an: Buntes Histogramm. Die Farbe der Kurve in jedem Zeitrahmen unterscheidet
Analyzing multiple time frames of a currency pair in one window can make you confused. To analyze multiple time frames, you need reliable indicators. One of them is using 9TF RSI MA . I've been working day and night to create code that is simple but reliable and covers all nine time frames in just one indicator .  Let's look at some of the advantages of this indicator: Colorful histogram . The color of the curve in each timeframe is different from one another.  Arrows indicating the crossing of
Analyzing multiple time frames of a currency pair in one window can make you confused. To analyze multiple time frames, you need reliable indicators. One of them is using 9TF MACD Limited Bar . I've been working day and night to create code that is simple but reliable and covers all nine time frames in just one indicator .  Attention! When first installed, the indicator does not look intact. Changing the timeframe will solve the problem. Let's look at some of the advantages of this indicator: C
Analyzing multiple time frames of a currency pair in one window can make you confused. To analyze multiple time frames, you need reliable indicators. One of them is using 9TF STOCH RSI LIMITED BAR . I've been working day and night to create code that is simple but reliable and covers all nine time frames in just one indicator .  Attention! When first installed, the indicator does not look intact. Changing the timeframe will solve the problem. Let's look at some of the advantages of this indicat
Die Analyse mehrerer Zeitrahmen eines Währungspaares in einem Fenster kann Sie verwirren. Um mehrere Zeiträume zu analysieren, benötigen Sie zuverlässige Indikatoren. Einer von ihnen verwendet 9TF Double RSI Double MA. Ich habe Tag und Nacht daran gearbeitet, Code zu erstellen, der einfach, aber zuverlässig ist und alle neun Zeitrahmen in nur einem Indikator abdeckt. Schauen wir uns einige der Vorteile dieses Indikators an: Doppeltes RSI, d.h. RSI schneller & RSI langsamer. Doppelter
Die Analyse mehrerer Zeitrahmen eines Währungspaares in einem Fenster kann Sie verwirren. Um mehrere Zeiträume zu analysieren, benötigen Sie zuverlässige Indikatoren. Einer von ihnen verwendet 9TF Double CCI Double MA. Ich habe Tag und Nacht daran gearbeitet, Code zu erstellen, der einfach, aber zuverlässig ist und alle neun Zeitrahmen in nur einem Indikator abdeckt. Schauen wir uns einige der Vorteile dieses Indikators an: Doppeltes CCI, d.h. CCI schneller & CCI langsamer. Doppelter
Ein genauer CCI-Indikator ist verfügbar. Dashboard Trendleiste Smart Level 9TF Double CCI. Doppelter CCI, d.h. Fast CCI & Slow CCI Warum brauchen Sie ein zweites CCI? Die Verwendung zusätzlicher Indikatoren wird uns im Live-Handel mehr überzeugen 9TF Fast CCI-Kurve 9TF Langsame CCI-Kurve 9TF Echtzeit-CCI-Winkel 9TF Echtzeit-CCI-Wert 9TF Echtzeit-CCI-Richtung/Phase 9TF Trendleiste Neuer Algorithmus bei der Berechnung des Trendbalkens An / aus Schalter. Sehr nützlich, um den Indikator mit nur e
Ein genauer RSI-Indikator ist verfügbar. Dashboard Trendleiste Smart Level 9TF Double RSI. Doppelter RSI, d.h. schneller RSI & langsamer RSI Warum brauchen Sie einen zweiten RSI? Die Verwendung zusätzlicher Indikatoren wird uns im Live-Handel mehr überzeugen 9TF Schnelle RSI-Kurve 9TF Langsame RSI-Kurve 9TF Echtzeit-RSI-Winkel 9TF Echtzeit-RSI-Wert 9TF Echtzeit RSI Richtung/Phase 9TF Trendleiste Neuer Algorithmus bei der Berechnung des Trendbalkens An / aus Schalter. Sehr nützlich, um den Ind
Ein genauer MACD-Indikator ist verfügbar. Dashboard Trend Bar Smart Level 9TF Double MACD. Dual MACD, d.h. schnell (MACD 1) & langsam (MACD 2) Warum brauchen Sie einen zweiten MACD? Die Verwendung zusätzlicher Indikatoren wird uns im Live-Handel mehr überzeugen 9TF Fast MACD 1-Kurve 9TF Langsame MACD 2-Kurve 9TF MACD-Winkel in Echtzeit 9TF MACD-Wert in Echtzeit 9TF-Echtzeit-MACD-RichtungEin genauer MACD-Indikator ist verfügbar. Dashboard Trend Bar Smart Level 9TF Double MACD. Dual MACD, d.h
Ein genauer stochastischer Indikator ist verfügbar. Dashboard Trend Bar Smart Level 9TF Dual Stochastic. Dual Stochastic, d. h. Fast Stochastic & Slow Stochastic Warum brauchen Sie die zweite Stochastik? Die Verwendung zusätzlicher Indikatoren wird uns im Live-Handel mehr überzeugen 9TF Fast Stochastic-Kurve 9TF Langsame stochastische Kurve 9TF Stochastischer Winkel in Echtzeit 9TF Echtzeit-Stochastikwert 9TF Echtzeit Stochastische Richtung/Phase 9TF Trendleiste Neuer Algorithmus bei der Bere
[V 1.00] MTF NRPA 5 Moving Average RTD wurde veröffentlicht! Pfeil-Echtzeit-Dashboard ohne Neulackierung. Wenn Sie nach dem besten Indikator für den gleitenden Durchschnitt suchen, sind Sie hier genau richtig. Im Allgemeinen werden zwei gleitende Durchschnitte festgelegt, da der Schnittpunkt der beiden gleitenden Durchschnitte (der Crossover) die Richtung des nächsten Preistrends bestimmt. Wenn sich der schnelle gleitende Durchschnitt mit dem langsam gleitenden Durchschnitt schneidet und sc
[V 1.00] MTF NRPA 5 RSI RTD wurde veröffentlicht! Pfeil-Echtzeit-Dashboard ohne Neulackierung. Wenn Sie es satt haben, verschiedene RSI-Indikatoren zu verwenden, aber feststellen, dass diese ungenau sind, dann probieren Sie dieses eine Tool aus. Normalerweise installieren Leute nur 1 RSI, um den OBOS-Level in einem bestimmten Zeitraum zu bestimmen. Die schlechte Nachricht ist, dass Sie die OBOS-Werte und -Trends nicht in verschiedenen Zeiträumen gleichzeitig sehen können. Deshalb habe ich d
Introducing the advanced trading tools of 2023. MTF PPAAF Model S. This is sub window version of my best trading tool : MTF Precise Price Action Arrow Filtered.  Click here to learn more about MTF PPAAF . This trading tool is equipped with various powerful features : MTF = Multi Time Frame = Time Frame can be changed. On/off button. Non Repaint Arrows.  Customizable parameter, color etc.  Can show all time frame (ATF) crossover arrows of fast stochastic main line & fast stochastic signal line (
If you are curious about the position of the stochastic, RSI, CCI curve, whether it is at the OBOS level or not, then this trading tool is for you. Introducing the advanced trading tools of 2024. ATF Trend Following Trend Bar OBOS. This indicator is similar to MTF PPAAF Model S but have two layers.  Click here to learn more about MTF PPAAFS . This trading tool is equipped with various powerful features : MTF = Multi Time Frame = Time Frame can be changed. On/off button. Customizable parameter,
Hallo Händler. Ich stelle Ihnen mein bestes Trading-Tool vor. MTF PPAAF Modell T. Multi-Time-Frame Präzise Preisaktion, gefiltertes Modell T.  Dieses Handelstool ist meine beste Arbeit nach Jahren der Entwicklung verschiedener Handelstools. Warum ist dieses Handelstool das beste und zuverlässigste?  1. Dieses Tool verwendet 6 Indikatoren:  Doppelter CCI = schneller CCI x langsamer CCI Dual Stochastik = schnelle Stochastik (schnelle stochastische Hauptlinie x schnelle stochas
Mit diesem Handelstool können Sie 15 Märkte gleichzeitig scannen. Einführung eines neuen Handelsindikators 2024: ️ Dashboard Multi-Währung Multi-Time-Frame Stochastic. Es gibt mindestens zwei Gründe, warum ich dieses Handelstool entwickelt habe: Erstens ist es mir langweilig, nur einen Markt zu beobachten. Zweitens möchte ich den Einstieg in einen anderen Markt nicht verpassen. Deshalb möchte ich gleichzeitig auch andere Marktbedingungen kennen. Aus diesem Grund benötige ich einen
Mit diesem Handelstool können Sie 15 Märkte gleichzeitig scannen. Wir stellen vor: der neue Handelsindikator 2024: ️ Dashboard, mehrere Währungen, mehrere Zeitrahmen, doppelter CCI. Es gibt mindestens zwei Gründe, warum ich dieses Handelstool erstellt habe: Erstens langweilt es mich, immer nur einen Markt zu beobachten. Zweitens möchte ich den Einstiegsmoment in einem anderen Markt nicht verlieren. Deshalb möchte ich gleichzeitig andere Marktbedingungen kennen. Aus diesem Grund brauche ich
Mit diesem Handelstool können Sie 15 Märkte gleichzeitig scannen. Einführung eines neuen Handelsindikators 2024: ️ Dashboard für mehrere Währungen und mehrere Zeitrahmen, doppelter RSI. Es gibt mindestens zwei Gründe, warum ich dieses Handelstool entwickelt habe: Erstens ist es mir langweilig, nur einen Markt zu beobachten. Zweitens möchte ich den Einstieg in einen anderen Markt nicht verpassen. Deshalb möchte ich gleichzeitig auch andere Marktbedingungen kennen. Aus diesem Grund b
Auswahl:
Keine Bewertungen
Antwort auf eine Rezension
Version 4.80 2024.08.13
In this new Version V 4.80 :
- Deconstruct from the beginning
- Adding CCIMA indicator
- Adding triple MTF cloud histo
- Adding triple MTF confluence multi mode
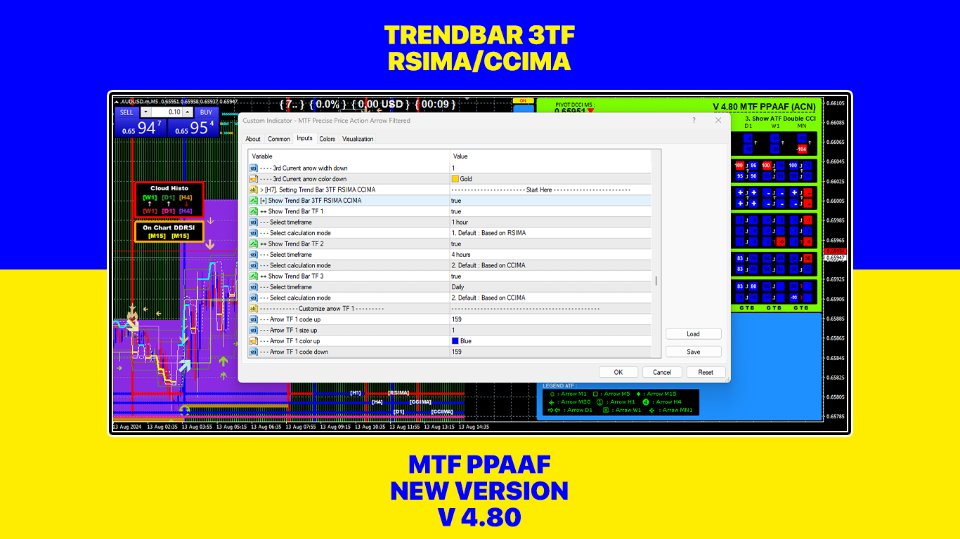
- Adding trend bar 3TF RSIMA/CCIMA
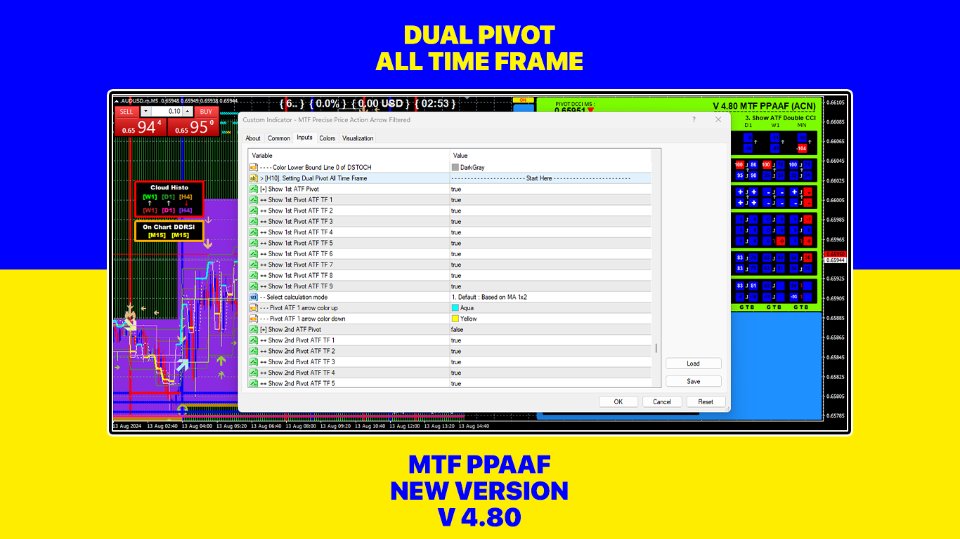
- Adding dual pivot all time frame
- Adding color level scheme
- Customizing on chart feature
- Optimizing the loading time
Version 4.70 2024.04.03
In this new Version V 4.70 :
- Fixing pivot value horizontal line trading in the zone
- Customizing Dual MTF Cloud Histo
Version 4.60 2024.03.29
In this new Version V 4.60 :
- Changing MTF Belt Trend to Dual MTF Belt Trend
- Adding trend following feature to MTF Belt Trend
- Adding time frame scheme True RSIMA
- Customizing On Chart Dual DRSI
- Customizing On Chart Dual Stochastic
- Customizing On Chart True RSIMA
Version 4.50 2024.03.18
In this new Version V 4.50 :

- Deleting Super Trend Arrows (only dashboard available with lines and trend bar) to optimize the rendering time
- Deleting Trend Bar 3TF of SRCM (Stoch,RSI,CCI,MACD)
- Deleting Trend Bar 3TF of MA5 x MA6
- Deleting confluence 3TF of Stochastic
- Deleting confluence 3TF of MACD
- Deleting confluence 3TF of MA1 x MA2
- Deleting confluence 3TF of DRSI
- Deleting confluence Dual Stoch
- Deleting confluence Dual MACD
- Adding MTF Belt Trend
- Adding Dual MTF Cloud Histo
- Adding 3TF True RSIMA lines
- Adding 3TF True RSIMA trend bar
- Adding 3TF True RSIMA dashboard
- Adding horizontal line trading in the zone
- Adding pivot value horizontal line trading in the zone
- Fixing vertical lines trading in the zone
- Total mode right now is 13 (previously 9)
Version 4.40 2024.02.02
In this new Version V 4.40 :
- Adding trend bar feature of True RSIMA
- Adding dashboard feature of True RSIMA
- Adding vertical lines feature of trading in the zone
- Adding current time and broker time feature
- Modifying trend bar 3 time frame
- Fixing dashboard monitor position
- Fixing price index location
Version 4.30 2024.01.25
In this new Version V 4.30 :
- Fixing histogram of MTF Belt Trend
Version 4.20 2024.01.25
In this new Version V 4.20 :
- Fixing OBOS level of ATF dashboard
- Adding calculation mode of TB TRD FOL 3TF, i.e DCCI and FDMACD
- Adding histogram to MTF belt trend
Version 4.10 2024.01.10
In this new Version V 4.10 :
- Fixing ATF Stochastic and ATF MACD
- Fixing algorithm of confluence 3TF
- Fixing algorithm of STF Dual Stochastic and Dual MACD
Version 4.0 2024.01.03
In this new Version 4.00 :
- Adding background color to trend bar 3TF
- Adding Mode 8 : Show ATF MA 1x2 DRSI
- Adding timeframe scheme of trading in the zone
- Adding timeframe scheme of trend following STF
- Adding timeframe scheme of trend bar trend following 3TF
- Fixing dashboard of RSIMA
Version 3.90 2023.12.22
In this new Version 3.90 :
- Deleting favorite arrows
- Adding MTF Trendbar Trend Following 3 Time Frame FDSTOCH/DRSI
- Adding MTF Trendbar Average 3 Time Frame FDSTOCH/DRSI
- Adding MTF Trendbar Trend Following 3 Time Frame MA5 x MA6
- Adding MTF Trendbar Average 3 Time Frame MA5 x MA6
- Fixing status quo of trading in the zone
Version 3.80 2023.11.20
In this new version V 3.80 :
- I fixed the 1 minute RSIMA dashboard
- I limited the number of favorite arrow mode to three
Version 3.70 2023.11.16
In this new version V 3.70 :
- I fixed the RSIMA dashboard
- I added favorite arrow calculation modes
Version 3.60 2023.11.13
In this new version V 3.60 :
- I added favorite arrow feature
- I set up trading in the zone interface
- I added W1 timeframe scheme for trend following STF arrows
Version 3.50 2023.11.06
In this new version V 3.50 :
- I changed the symbol for MACD above zero and MACD below zero level.
- I changed the code of square STF trend following.
Version 3.40 2023.10.30
In this new Version 3.40 :
- I limited the number of candle high time frame
- I added arrow size option to trend following STF arrows
Version 3.30 2023.10.25
In this new Version 3.30 :
- I fixed the on off button sound
- I added trend bar 9TF of STA mode 2 from current time frame (0) to previous 5 bar ago (5)
- I fixed on chart dual stochastic channel
- I fixed dashboard position
- I modified algorithm in STA mode 1 & mode 2
- I added time frame scheme for trend following STF
Version 3.20 2023.10.19
In this new Version 3.20 :
- I changed the dashboard font so it looks clear
Version 3.10 2023.09.25
In this new Version 3.10 :
- Reduce total mode to only 8, i.e show all time frame crossover arrows and trading in the zone
- Modifying parameter setting
- Can show all time frame crossover arrows of fast CCI and slow CCI, i.e DCCI
- Modify the status for mode 8
- Can show trend following selected time frame of fast stochastic, RSI 1x2, CCI 1x2, fast macd and RSIxMA outside the modes.
Version 3.0 2023.09.06
In this new Version 3.00 :
- Modifying STA algorithm both for calculation mode 1 and mode 2
- Modifying dashboard color scheme
- Modifying parameter setting
Version 2.90 2023.09.04
In this new Version 2.90, I added new features :
- Adding Mode 29 : Show ATF Fast Stoch DRSI. With this feature monitoring all time frame arrows of stochastic and RSI is easy.
- Adding STA Calculation Mode. The first mode is based on crossover of RSI & MA and the second mode is based on crossover of fast RSI & slow RSI.
Version 2.80 2023.08.30
In this new Version 2.80, I added new feature :
- Adding Time Spread Profit Info (TSPI) indicator
Version 2.70 2023.08.21
In this new Version 2.70, I make monitoring visually Stoch RSI easy :
- Modifying on chart dual stochastic
- Modifying on chart double rsi
- Modifying on chart rsioma
- Modifying color level
Version 2.60 2023.08.13
In this new Version 2.60, I added new feature :
- Adding STF belt trend
- Fixing on chart range
- Changing arrow code DRSI and DCCI
Version 2.50 2023.07.31
In this new Version 2.50, I added new feature :
- Adding confluence of 3TF MA 1x2
- Changing arrow code for trend following double CCI
- Changing arrow code for trend following double RSI
Version 2.40 2023.07.25
In this new Version 2.40, I added new features :
- Adding confluence of 3TF Fast DSTOCH
- adding confluence of 3TF Fast DMACD
- Adding trend following STF of DRSI
- Adding STA monitor, i.e (from top to bottom) H1,H4,D1,W1,MN1
Version 2.30 2023.07.18
In this new Version 2.30, I added new features :
- Added mode 28 : show trading in the zone
- Added 9TF double CCI dashboard monitor
- Added selected timeframe of double CCI crossover arrows
- Added STA monthly arrows
- Added three new dashboard color scheme
- Fixing STA, dual stochastic & dual MACD algorithm
Version 2.20 2023.07.11
In this new Version 2.20, I added new features :
- Added upper bound 100 & lower bound 0 for on chart dual stochastic
- Added upper bound 100 & lower bound 0 for on chart double rsi
- Fixing trading in the zone four MA
- Added timeframe scheme for four MA
- Fixing RSIMA dashboard
Version 2.10 2023.07.04
In this new Version 2.10 :
- Fixing DRSI arrow TF MN1
- Fixing color super trend arrows
- Fixing arrow MA 3 x MA 4
- Added timeframe scheme D1,W1,MN1 for conflux DRSI
Version 2.0 2023.07.03
In this new Version 2.00, I added new features :
- Added confluence arrows of 3 timeframe double RSI
- Added 12 timeframe scheme to choose from for confluence of double RSI
- Fixing algorithm for trend following dual stoch and dual macd
Version 1.90 2023.06.26
In this new Version 1.90, I added new features :
- Added super trend arrows higher timeframe
- Added MACD above or below zero level into dashboard
- Fixing MTF feature
Version 1.80 2023.06.20
In this new Version 1.80, I've made a lot of changes :
- Change the appearance of the dashboard from a circle to a square shape.
- Fixing color OBOS of slow stochastic and slow drsi.
- Added feature on chart slow stochastic.
- Added feature pivot value of all time frame of Fast Stoch.
- Added feature pivot value of all time frame of Fast MACD.
- Added feature pivot value of all time frame of MA 1,2.
- Added feature pivot value of all time frame of Double RSI.
- Added feature pivot value of all time frame of RSIMA.
- Added feature MTF candle high time frame.
- Ability to change/shift the starting time to monitor in real time 9TF dashboard.
Version 1.70 2023.06.02
In this new Version 1.70, I've added the ability to monitor visually :
- On chart stochastic makes it easy for us to observe the movement of stochastic main line and stochastic signal line along the OBOS channel.
- On chart four MA makes it easy for us to observe the movement of MA 1 cross MA 2 and MA 3 cross MA 4.
- On chart double RSI makes it easy for us to observe the movement of RSI fast line and RSI slow line along the OBOS channel.
- On chart true RSIMA makes it easy for us to observe the movement of RSI line and MA line along the OBOS channel.
This on chart double RSI or on chart true RSIMA will make monitoring RSI divergence much more accurate than installing RSIMA on sub window.
And also I changed the appearance of the 10 dashboard color scheme to be more attractive.
Version 1.60 2023.05.23
In this new Version 1.60, I've made trading in the zone much more easy :
- Added four MA dashboard monitor (not just two MA!)
- Added four MA lines on chart (by default : MA 1x2 on current timeframe and MA 3x4 on M30)
- Customizable four MA lines
- Button can be located on sub window
Version 1.50 2023.05.03
In this new Version 1.50, I've made a lot of reconstruction :
- Total mode up to 27
- New feature : Show Trend Following ATF TWOMA Filtered By Trend Following Selected TF of FAST STOCH
- New feature : Show Trend Following ATF TWOMA Filtered By Trend Following Selected TF of FAST MACD
- New feature : Show Trend Following ATF TWOMA Filtered By Trend Following Selected TF of DRSI
- New feature : Show Trend Following ATF TWOMA Filtered By Trend Following Selected TF of RSIMA
- Trend following = non repaint arrows!
- Fixing algorithm of button
- Adding color level type
Version 1.40 2023.04.11
In this new Version 1.40, I've made a lot of reconstruction :
- Total mode up to 23
- New feature : Show Trend Following All Timeframe of Two MA
- New feature : Show Trend Following All Timeframe of Double RSI
- New feature : Show Trend Following All Timeframe of RSIMA
- New feature : Show Trend Following Selected Timeframe of Two MA
- New feature : Show Trend Following Selected Timeframe of Double RSI
- New feature : Show Trend Following Selected Timeframe of RSIMA
- New feature : Show Trend Following Selected Timeframe of Dual Stoch
- New feature : Show Trend Following Selected Timeframe of Dual MACD
- Trend following = non repaint arrows!
- Fixing algorithm of mode 21 : Show Selected TF of STOCH,MACD,TWOMA,DRSI Filtered By Trend Following RSIMA
- Parameter values can be hide/show
Version 1.30 2023.03.30
In this new Version 1.30, I've made a lot of reconstruction :
- Added dual stochastics dashboard monitor (fast stoch = stochastic 1 and slow stoch = stochastic 2)
- Added dual macd dashboard monitor (fast macd = macd 1 and slow macd = macd 2)
- Fixing MA Phase of RSIMA
- Change arrow code
- New feature : showing trend following arrows of stochastics and macd
- Dashboard monitor can be hide
Version 1.20 2023.03.12
In this new Version 1.20, I've made a lot of reconstruction :
- Fixing daily arrow of MACD
- Fixing arrow of RSIMA
- New algo in determining the up and down arrows
- New feature : showing arrows of Stochastic, MACD, Two MA and RSIMA at once
- Adding the RSIMA 9TF dashboard monitor
- Beautify the dashboard monitor
Version 1.10 2023.02.27
New version 1.10 with new feature available:
- Adding the ability to filter price action by all time frame (ATF) Two Moving Average
- Adding the ability to filter price action by all time frame (ATF) Double RSI
- Adding the value of Stochastic on all time frame
- Adding the value of CCI on all time frame