• Overview
  • Reviews
  • Comments
  • What's new

MTF Precise Price Action Arrow Filtered

If you are looking for a trading tool that combines various indicators, then you are on the right page.

Why do we need to combine different indicators?

THE ANSWER IS TO STRENGTHEN THE SIGNAL.

It is possible that the RSI is rising at that time but is the moving average also rising?

Is the stochastic also rising? Is the CCI also rising?

Sometimes RSI keeps going up even though it is already in the overbought area.

Even at 100 it is still going up. Is it safe for us to take a sell position when RSI is in the overbought area?

Likewise, sometimes RSI keeps going down even though it is already in the oversold area.

Even at 0 it is still going down. Is it safe for us to take a buy position when RSI is in the oversold area?

We need another indicator to convince us that the signal is strong to buy/sell.

Sometimes stochastic H4 buy but in M30 is sell.

Then what do we do?

Is there a change in trend?

Is the market trend still buy or is it good to sell?

For that, you need a multi-time frame trading tool that can monitor market movements starting from the M1 to MN timeframe.

And if you are looking a trading tool that Can Display On Chart Double RSI, On Chart Stochastic and On Chart Moving Average lines of for example H1 timeframe while you open the chart on lower timeframe M5, then yes, this trading tool is what you are looking for!

Because we all agree that monitoring higher timeframe while opening the chart on lower timeframe is very important.

Whether you are a scalper, intraday or day trader or even an investor, you need this awesome MTF trading indicator.

Whether you are a forex trader, gold trader, crypto trader or stock trader, you need this awesome MTF trading indicator.

I present to you a powerful trading tool that you should buy right now :

MTF Precise Price Action Arrow Filtered
New Version
V 5.50

This means that this trading tool has been updated 55 times.

I have worked very hard to continuously observe and research market movements using this tool.

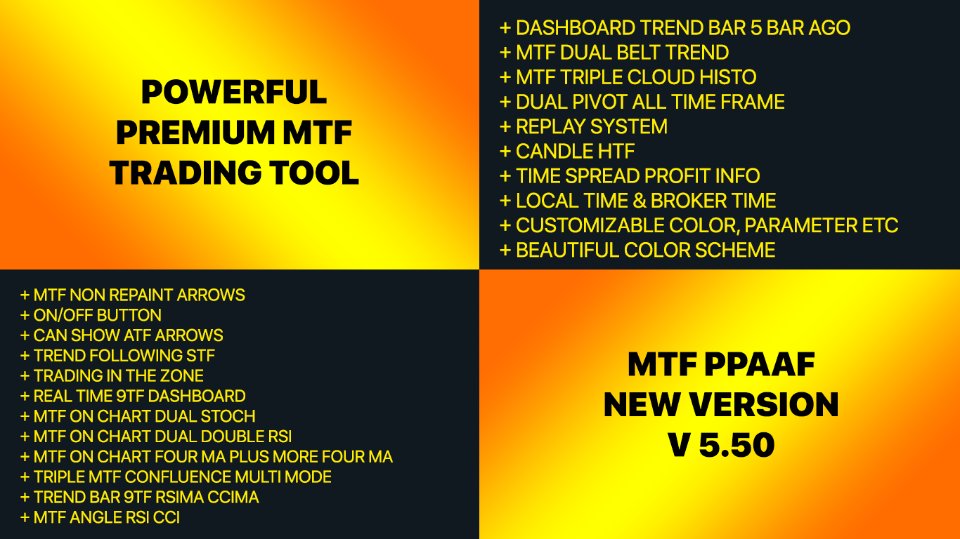
The following are the features available in this tool :

1. This trading tool uses 7 indicators to strengthen the direction of market movement.

a). The first indicator is Dual Double CCI, namely Fast Double CCI and Slow Double CCI

b). The second indicator is Dual Stochastic, namely Fast Stochastic and Slow Stochastic

c). The third indicator is Dual MACD, namely Fast MACD and Slow MACD

d). The fourth indicator is Six MA, namely MA 1x2, MA 3x4 and MA 5x6

e). The fifth indicator is Dual Double RSI, namely Fast Double RSI and Slow Double RSI

f). The sixth indicator is RSIMA, namely RSI x MA

g). The seventh indicator is CCIMA, namely CCI x MA

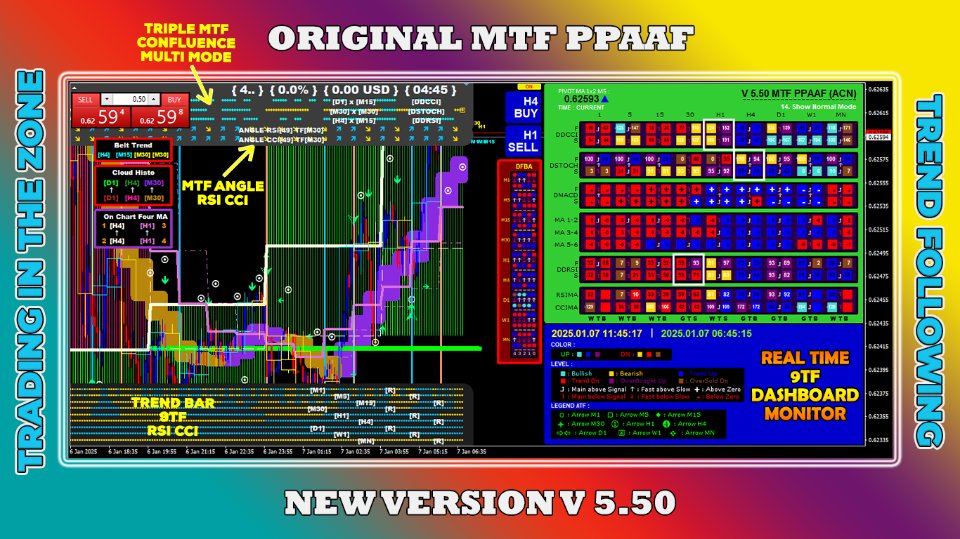
2. Real time 9TF dashboard monitor.

With this feature, you can monitor market movements in real time starting from the 1 minute time frame to the MN time frame. In the dashboard you will be able to see whether the main line is greater than the signal line or not, whether the fast RSI line is greater than the slow RSI line or not, whether the RSI line is all up or not, etc. You can also see whether the Stochastic, RSI and CCI levels are overbought or oversold. Knowing the OBOS (overbought oversold) level is very important.

3. On chart features.

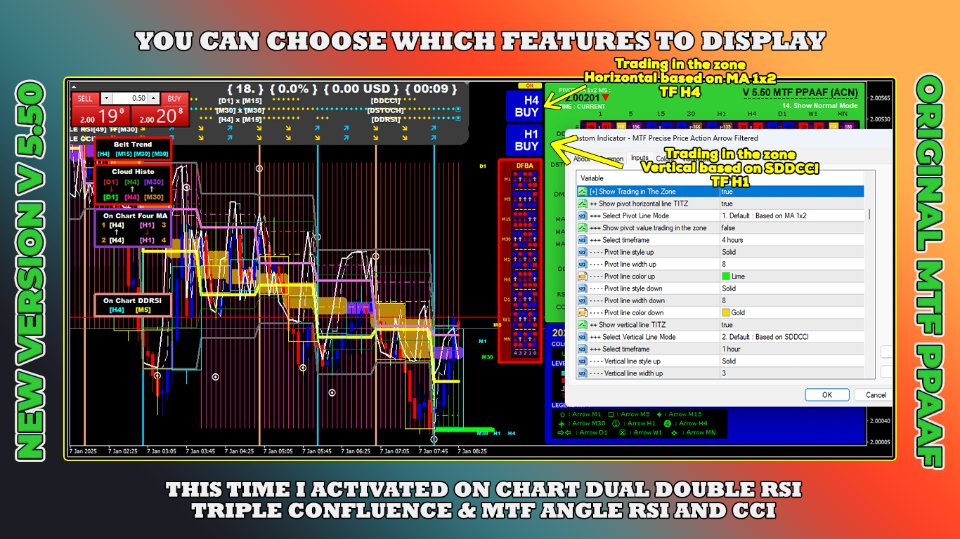
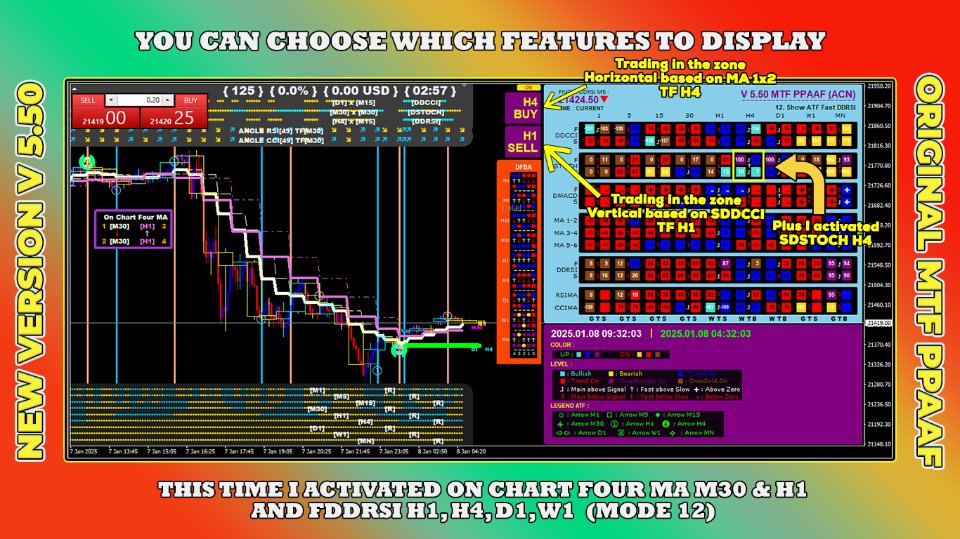
Monitoring visually is important. For this reason, I added the On Chart Dual Stochastic, On Chart Four MA, another On Chart Four MA and On chart Dual Double RSI features. For your information, placing stochastics in the chart window is more accurate than placing stochastics in the sub window. Observing the intersection of the main line and signal line in real time in the chart window will make you confident in determining entry points and exit points. My principle is buy low sell high. Please remember that principle.

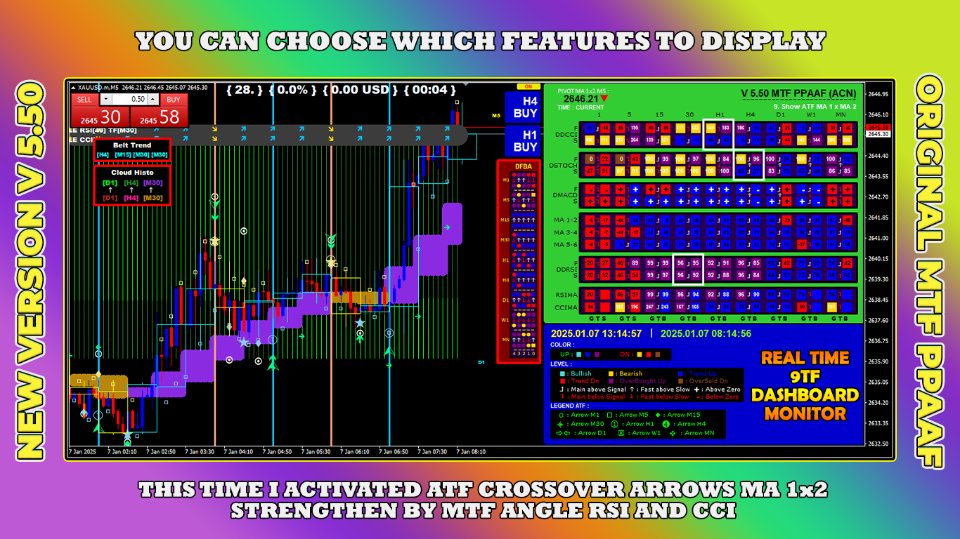
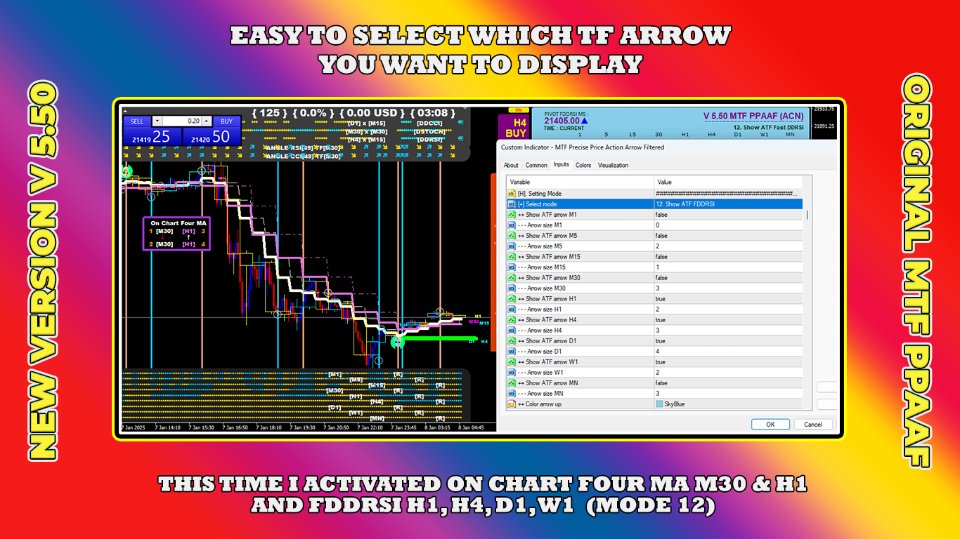
4. Can display ATF (all time frame) crossover arrows :

- Mode 1 : Show ATF RSIMA, namely RSI x MA

- Mode 2 :  Show ATF CCIMA, namely CCI x MA

- Mode 3 :  Show ATF FDDCCI, namely Fast main CCI x Fast signal CCI

- Mode 4 :  Show ATF SDDCCI, namely Slow main CCI x Slow signal CCI

- Mode 5 :  Show ATF FDSTOCH, namely Fast Stochastic main line x Fast Stochastic signal line

- Mode 6 :  Show ATF SDSTOCH, namely Slow Stochastic main line x Slow Stochastic signal line

- Mode 7 :  Show ATF FDMACD , namely Fast MACD main line x Fast MACD signal line

- Mode 8 :  Show ATF SDMACD , namely Slow MACD main line x Slow MACD signal line

- Mode 9 :  Show ATF MA 1x2, namely moving average 1 x moving average 2

- Mode 10 : Show ATF MA 3x4, namely moving average 3 x moving average 4

- Mode 11 : Show ATF MA 5x6, namely moving average 5 x moving average 6

- Mode 12 :  Show ATF FDDRSI, namely Fast main RSI x Fast signal RSI

- Mode 13 :  Show ATF SDDRSI, namely Slow main RSI x Slow signal RSI

- Mode 14 : Show Normal Mode 

5. Dashboard Trend Bar 5 Bar Ago (DFBA).

There are five trend bars that you can observe. The rightmost trend bar is the latest real time trend bar (0). Followed by the previous trend bar (1,2,3,4).

This trend bar is useful for observing changes in the direction of market trends from the previous time frame to the current time frame.
6. Trend Following STF (selected time frame).

Here you can choose the time frame according to your wishes. If two lines cross each other, an arrow appears.

Plus the trend following arrow will appear if the angles of the two lines are all positive (UP) or all negative (Down).

7. Replay System.

With this feature you can go back in time, observing the condition of the 9TF dashboard on a certain day and time.

Suppose you want to analyze why at 2023.10.11 14:21:30 the market sells.

To use this feature, open your Meta Trader 4 chart in a lower timeframe, for example M5.

8. Dual Pivot All Time Frame.

Pivot levels act like S & R, namely Support and Resistance.

The good news is that started from version V 5.00 the replay system also works on Dual Pivot ATF.

This is really an amazing feature.

Now you can analyze buy/sell on a certain day and time vertically (know the time) or horizontally (know the price).

9. Candle HTF (High Time Frame).

With this feature you can see market structure in the high time frame (for example H1) when you open the chart in the lower time frame (I like opening it at M5).

10. TSPI (Time Spread Profit Info).

With this feature you can see in real time the current time, spread, profit/loss and percentage of profit/loss.

11. On/off button feature.

With this feature you can show or hide this trading tool with just one click.

Interesting right?

12. 20 dashboard color schemes.

With this feature, you can choose a dashboard color that matches the color of your chart.

13. Customizable line, color, arrows, parameter.

All parameters used in calculating indicators can be adjusted according to your wishes.

You can use stochastic parameters 14,3,3 or 5,3,3 etc.

Or you use the default settings.

14. MTF, namely Multi Time Frame.

You can set a time frame according to your wishes.

For example, you want to activate the on chart dual stochastic feature on the M5 and H1 time frames.

Yes, you can!

15. Non Repaint Arrows (NRPA).

If two lines intersect at any time then the crossover arrow will appear. Very often, because of high volatility, in the following seconds and minutes, the two lines do not intersect. As a result, the arrow that appeared earlier then disappeared. This is a very important feature. Remember that during high volatility, the arrow that was previously up can become down. The arrow that had previously appeared could disappear in an instant. That's why my message is to validate using the real time 9TF dashboard monitor!

16. Dual MTF Belt Trend.

Belt Trend is based on crossover of moving averages.

You can set a time frame according to your wishes.

17. Triple MTF Cloud Histo.

Cloud Histo is based on crossover of moving averages.

You can set a time frame according to your wishes.

18. Triple MTF Confluence Multi Mode.

Confluence means intersection between two timeframes.

For example, if fast stochastic H4 and slow stochastic M5 are all up then up arrow will appear.

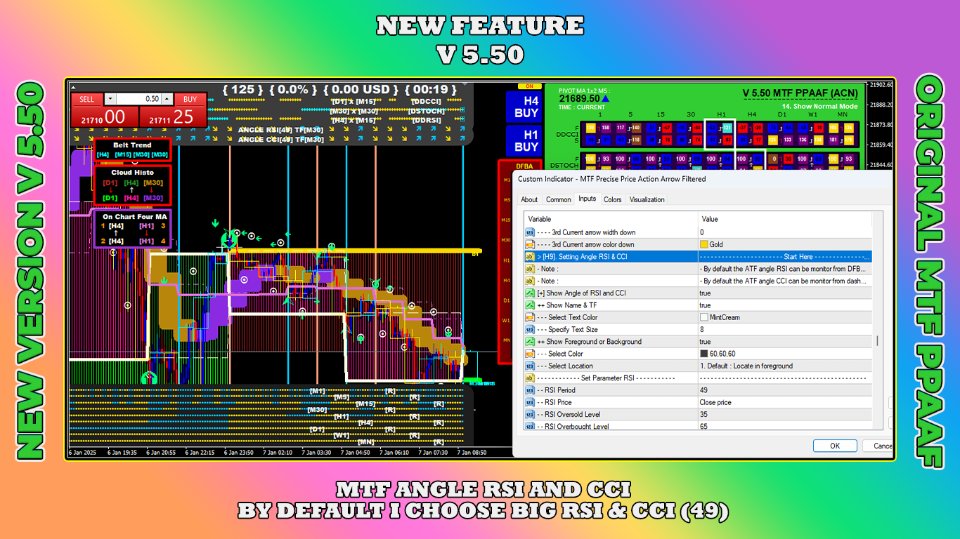
19. MTF Angle of RSI and CCI.

This new feature will show the angle of RSI and CCI of timeframe M30 by default.

You can choose the timeframe you want.

20. Trend Bar 9TF RSIMA/CCIMA.

Coding RSIMA/CCIMA is hard.

But, I have successfully made this tool work accurately for RSIMA/CCIMA.

21. Trading in the zone (TITZ).

There are pivot horizontal line TITZ which based on three calculation modes and vertical lines TITZ which based on eleven calculation modes. 

USING ONLY ONE INDICATOR IS NOT VERY CONVINCING. 

THAT'S WHY WE COMBINE SEVERAL INDICATORS TO STRENGTHEN OUR ANALYSIS ON MARKET DIRECTION.

🟡 Learn old version here :

▶️ V 5.40 ▶️ V 5.30 ▶️ V 5.20 ▶️ V 5.10 ▶️ V 5.00 ▶️ V 4.90 ▶️ V 4.40 ▶️ V 4.10 ▶️ V 4.00 ▶️ V 3.90 ▶️ V 3.80 ▶️ V 3.70 ▶️ V 3.60 ▶️ V 3.50 ▶️ V 3.40 ▶️ V 3.30 ▶️ V 3.20 ▶️ V 3.10 ▶️ V 3.00 ▶️ V 2.90 ▶️ V 2.80 ▶️ V 2.70 ▶️ V 2.60 ▶️ V 2.50 ▶️ V 2.40 ▶️ V 2.30 ▶️ V 2.20 ▶️ V 2.10 ▶️ V 2.00 ▶️ V 1.90 ▶️ V 1.80 ▶️ V 1.70 ▶️ V 1.60 ▶️ V 1.50 ▶️ V 1.40 ▶️ V 1.30 ▶️ V 1.20 ▶️ V 1.10 

    This indicator has gone through a series of trials.

    The programming codes have been written with great care.

    Make confident entries with the best Non Repaint Price Action trading indicator MTF PPAAF

    Download now and trade like a pro!

    Thank you. 


    Recommended products
    Black series MT4
    Dmitriy Kashevich
    1 (1)
    Black series MT4 - The indicator is designed for trading on binary options with Timeframe M1-M5-M15 Multicurrency (Works on cryptocurrency and currency pairs) The signal appears when the candle opens Up to 90% correct signals There is no signal redrawing at all Can be used with other indicators. Good for scalping! In Settings there is: -Indicator working methods -I Allert Arrow color Red signal down Blue signal up Also watch the video how the indicator works and signals
    Lefort
    Maksim Pliskach
    LEFORT is a multi-currency, fully automatic, high-frequency trading robot. The robot works with any instruments in MT4 on any timeframe. The algorithm of the expert Advisor is as follows Single-scalping trades will. Using the analytical signals module, the robot analyzes the market dynamics, and then makes single trades in the direction of the dominant trend with a profit of several pips. A series of open orders. The robot makes a series of trades on a pullback in the direction of the dominant t
    Important Notice: The Fire Wave Expert Advisor is specifically designed to operate on the   GBP/USD pair   using the   5-minute timeframe . Using the EA on higher timeframes   (such as H1 or above)   significantly   increases risk   and could lead to higher-than-expected drawdowns. This is due to the unique calculations of the strategy, which are optimized for the 5-minute chart. However, if you prefer   lower risk with lower returns , the EA can also be used on the   EUR/USD pair , but with low
    A   rocket   (from   Italian :   rocchetto ,   lit. 'bobbin/spool') [nb 1] [1]   is a   projectile   that   spacecraft ,   aircraft   or other   vehicles   use to obtain   thrust   from a   rocket engine . Rocket engine exhaust is formed entirely from   propellant   carried within the rocket. [2]   Rocket engines work by   action and reaction   and push rockets forward simply by expelling their exhaust in the opposite direction at high speed, and can therefore work in the   vacuum   of space. In
    Momentum Classic
    Ivan Pochta
    3.9 (21)
    Momentum Classic Live results:   https://www.mql5.com/en/signals/579509 Momentum Classic   is a completely automatic trading EA. It is a fact that market is mostly trading in range and high-power bursts are rare. These sharp movements are starting with momentum, which is a signal to trend start, increased volatility and trading volumes. We built a special algo, which seeks for such  Impulse  (Momentum) , to signal trade entry.  Momentum Classic  also has several filters, based on deviation fr
    Sell Signall
    Dmitriy Kashevich
    This indicator is named so for a reason, because it will show the reverse side of the market. It has several math indicators built in that are tuned to show the best signals for currency pairs! Ideally proved to be in work on the M5-M15 no more and no less! Only at the same time it shows up to 86.5% of correct signals! The settings include the colors of the arrows, the alert, and the same parameters so that you can reconfigure the indicator and trade on cryptocurrency and raw materials!
    Awesome Scalper Pro
    Nga Ngan Wan
    5 (2)
    Trading Algorithm: Awesome Scalper Pro utilizes the William Percentage Range (W%R) indicator to identify oversold or overbought entry points. A flexible grid system is incorporated to recover from losing positions. This system is designed to trade only at designated oversold or overbought levels. Furthermore, safety mechanisms such as hedging, drawdown reduction, and timeframe adjustments are implemented to minimize drawdown. Live Signal : Running over 17 months, Tickmill account starting with
    The Nihilist 5.0 Indicator includes Forexalien and Nihilist Easy Trend trading strategies and systems. It is composed of an MTF Dashboard where you can analyze the different input possibilities of each strategy at a glance. It has an alert system with different types of configurable filters. You can also configure which TF you want to be notified on your Metatrader 4 platform and Mobile application The indicator has the option to view how could be a TP and SL by using ATR or fixed points, even
    Description of ZiqScalping The ZiqScalping indicator is designed to trade both currencies with high volatility and trend-oriented currencies. Recommended time frame for scalping: М5, М15, М30. Recommended timeframe for intraday trading and above: H1, D1. Works on all pairs! Settings : See screenshots. Decision principle! The indicator is based on 2MA, MACDI,OSMA. Arrows with trend directions and 2MA lines are shown graphically. Calculations of volumes by positions are entered into
    Octo Tack Pro
    Rafael Vega Ruiz
    OCTO TACK TREND PRO INDICATOR Summary/Description: Trend indicator Shows signals that tell you the current market trend Shows different signals to execute orders in favor of the current trend Get ready to have the best trend indicator you've ever tried. It does not repaint in any way, once a signal has been captured, it remains there until it is finalized. It generates clear signals and always in favor of the trend (see screenshots) Just be attentive and wait for the alert to tell you when a n
    KFX Trade Manager
    Joe Christopher Ramirez
    Introducing the "KFX Trade Manager" expert advisor for MetaTrader 4 (MT4), a comprehensive solution for advanced trade management and risk control. This powerful tool is designed to enhance your trading experience by automating various aspects of order handling, profit optimization, and alert notifications. With the "KFX Trade Manager," you can take your trading to the next level and streamline your operations for improved efficiency and better risk management. Key Features: Trade Management Set
    GeoWprPro
    Georgij Komarov
    WPR by Profile, or WPR for Professionals Geo_WprPro is one of the well-known currency profile indicators. It simultaneously displays two WPR indicators with different parameters in the matrix form on all timeframes of multiple currency pairs forming the currency profile . As follows from the description, " WPR is a leading indicator that often goes ahead of the price chart. The oscillator frequently reaches extreme values before the price reversal as if anticipating that event: it almost always
    Overview AITrendBooster   is our latest intelligent trading system, designed to utilize trend-following strategies with scaling positions to significantly enhance profitability while effectively reducing drawdowns during unfavorable market conditions. This system incorporates cutting-edge deep learning technology to significantly improve trend recognition accuracy. The core design goal of the system is to maintain break-even performance during range-bound markets while achieving higher profits
    Effective Decision
    Tatiana Savkevych
    The Effective Decision bot (for EURUSD) works on the Metatrader trading platform, which is widespread on the Forex market. The basis of the bot is a complex algorithm for controlling transactions. Many indicators are used as the main entry signal (Envelopes, ADX, Bands, MA, RSI, AD, Alligator, BearsPower, Fractals, Momentum). Bot environment: Currency pair - EURUSD. TimeFrame - H1. The maximum spread is 20 pips. Required deposit - $10,000 (or equivalent). The maximum drawdown is 12%. Peculiar
    WORLD FOREX ROBOT TRADER  World Forex Robot Trader   is the Forex Robot for the sophisticated and conservative busy investors and traders like you. It will enable you to start right away. You can trade as you learn and master more complex trading techniques. With this EA, your friends will be amazed of the quick 180-degree turn of your trading venture.  Be the one that you truly deserve and destined to be a high achiever.      G U I D E   E B O O K    Download it here for fre
    MACD Divergence Finder Indicator will help you to find Divergences between your typical MACD values and the Chart Prices as potential points of actual Trend Reversion or Pull Backs to increase your positions as per the current Trend. Indicator Windows draws MACD value and Divergence arrows but not MACD Signal as it is not considered relevant to detect this kind of Classic Divergences. In some computer/VPS with old microprocessors or low RAM size, when you launch this Indicator (attach it, change
    Mongol Indicator2
    Sumiyabazar Buyanjargal
    It's a variation of mid of HH and LL since it compares the higher of HH or LL against a period and twice the number of bars back to avoid whipsaws. I used to display this against lines on a chart, but made a histogram out of it and it looks interesting. It looks good at gauging trend strength and general turns (see image below). The name of the indicator is BAM, which is an acronym for "Below and Above Mid". Ways to use it: 1. To see general trend on longer TFs (more than 30 ba
    This system never paints.   This system created by using Envolpes bands and reverse bar count.   This indicator is only working in M5 period.   This system is for long term and profitable.   Signals are shown as arrows. as an optional limit orders.   You can set a voice alarm or email notification.   You can fins our other products from link : https://www.mql5.com/en/users/drbastem/seller   Also, you can ask all your questins from email : haskayafx@gmail.com or mobile : +90 530 867 5076 or @Meh
    Connect Indicator
    Sukunthakan Ngernbamrung
    Connect Indicator is a tool used for connecting indicators between the MQL market and MT4. The connected indicators are made by our group and can be used for other applications, such as sending messages to the Line application or Telegram application. If you have any questions, please don't hesitate to ask us to receive support. Function and indicator buffer Buffer one is the high price of the previous candle. Buffer two is the high price of the previous candle. Usage To connect indicators to fu
    The Pallada Manual System indicator is a complete manual trading system that does not require the use of any other indicators. Very simple and clear to use. Estimated profitability, depending on the setting, is 5-30%. The indicator is ideal for those who want to control the trading process, but do not sit at the monitor for days. Ideal for calm measured trading without nerves and stress.
    ROC acceleration-deceleration is the manual system for medium-term scalping. Indicator based on custom ROC system which defines bullish/bearish market and especially  acceleration-deceleration of tendention in the market's main direction. Buy arrow is plotted during bearish market when current trend decelerates and sell  arrow is plotted during bullish market when current trend decelerates. Main Indicator's Features Signals are not repaint,non-late or disappear(exept cases when system recalculat
    Algo Trading Indicaor  With this indicator , you’ll have zones and trends that hight probability the price will reverse from it. so will gives you all the help that you need  Why should you join us !?  1-This indicator is logical since it’s working in previous days movement , to predict the future movements. 2-Algo trading indicator will help you to draw trends which is special and are too strong than the basics trend , trends will change with the frame time that you work on . 3-We can
    Urgent reminder> Only 13 copies remaining for the price to double on all renting options. Get your copy Today! Introduction Dear Traders, I am always working to come up with tools that may help you to become a better trader and investor. Due to my experience in trading and market analysis and trading software design and development, I am glad to introduce to you my other tool called " Amazing Entries Indicator ". The Indicator is designed in a way that it combines different strategy to provide
    Non-proprietary study of Joe Dinapoli used for trend analysis. The indicator gives trend signals when the fast line penetrates the slow line. These signals remain intact until another penetration occurs. The signal is confirmed at the close of the period. It is applicable for all timeframes.   Inputs lnpPeriod: Period of moving average. lnpSmoothK: %K period. lnpSmoothD: %D period.                                       *****************************************************************************
    FREE
    Moving Pivot Average    The pivot indicator compares the selected period with its counterpart from the previous period. The indicator uses very flexible algorithm for pivot value calculating. It allows you to allocate in days a certain time intervals (custom bars) and calculate the average pivot value based on High, Low and Close prices of these bars. How many custom bars will be taken into account is determined by the "Days" setting. The pivot line can be considered an average trend line and us
    Robot Choppiness
    Diego Mauricio Padilla Mendez
    3 (2)
    The Choppines robot is loaded as an indicator in the MT4 indicators folder It is recommended to use a candle timing of 5 minutes, the recommended robot expiration time is 5 minutes. The robot can be configured to send signals to MT2, MX2, PRICEPRO platforms. To send signals, you must use the connector program of the platform we want to work with. To install on the connector, perform the following procedure (an image is attached describing the configuration with the MT2 platform connector)
    Forex trading bot ai is an artificial intelligence-based robot with self-learning capabilities. This robot initiates its first trades based on the input parameters specified in the settings. Each trade executed by the robot is recorded in a file (memorized). The robot then analyzes all the closed trades and the conditions under which they were closed. If the overall profit of the closed trades is negative, the robot examines the parameters with which they were opened and adjusts them to improve
    My trading system specializes in the Mastering RSI indicator. And this is an EA that only trades XAUUSD/GOLD according to Martingale. It has been tested many times and passed funded with $200,000. To optimize risk management, it only makes transactions in one direction. ** Suitable for capital from 2000 USD or 2000 USC. Buyers please contact me before installing and running EA. I will help you get the right parameters for your broker.
    Reversal Point Detector (RPD) is an advanced indicator that is obtained from a combination of advanced mathematical functions, especially price action, which is able to detect price reversal points, or in other words, invisible market supports or resistances without the use of any tools. This indicator can identify the appropriate trading opportunities on its own and each person can trade by setting the appropriate SL and TP according to their trading strategy and risk management. This advan
    Buyers of this product also purchase
    Gann Swing Structure
    Kirill Borovskii
    5 (1)
    This indicator is based on the mathematics of the great trader W.D. Ganna. With its help, you can easily find strong levels by analyzing swings to find the optimal entry point. The indicator works on all instruments and all timeframes. The indicator is fully manual and has control buttons. All you need to do is press the NEW button, a segment will appear, which you can place on any movement, swing or even 1 candle that you want to analyze. By placing the segment, press the OK button. A grid (th
    Bomb Bank Signal
    Igor Pereira Calil
    5 (1)
    Bomb Bank Signal: Your Trusted Indicator for MetaTrader 4 The Bomb Bank Signal is a powerful indicator for MetaTrader 4, designed to identify the most relevant trends in the financial market. If you are looking for a tool that accurately anticipates movements, Bomb Bank is the ally you need. How it Works: This indicator combines three distinct methods – volume analysis, candle closes and symmetrical trend – to detect and signal buying and selling opportunities. Bomb Bank is like a "bomb"
    Trins
    Ivan Simonika
    1 (1)
    One of the main definitions for monitoring the currency market is the trend. The Trins indicator is designed to display the trend in a visual form. Trend is a stable direction of price movement. To find it, the indicator uses calculations designed to smooth out sharp fluctuations that do not affect the overall picture of price movement. The trend can be increasing (bullish trend) and decreasing (bearish trend). In most cases, the trend is growing for a long time and drops sharply, but in all
    Smooth price for Monarch MT4
    Konstantin Gruzdev
    3.67 (3)
    The Smooth Price technical indicator is used for plotting a smoothed line as close to the price of the financial instrument as possible, and serves to eliminate its noise components. The indicator is part of the Monarch trading system, but here it is presented as an independent technical analysis tool. The indicator is based on the cluster digital filter , which, unlike the ClusterSMA , is applied directly to the price time series. Smooth Price does not redraw (except the very last, zero bar) an
    Market Interest
    Paul Edunyu Carissimo
    Market Interest Indicator : Your Comprehensive Edge in Trading  Key Benefits: Quantifies real-time market participant engagement and sentiment Blends pure price action and volume dynamics for a comprehensive analysis Reveals hidden market sentiment beyond traditional technical indicators Adaptable across multiple timeframes and asset classes Provides early warning signals for potential trend shifts Dual-Component Functionality: The Market Interest Indicator features two distinct components that
    Precautions for subscribing to indicator This indicator only supports the computer version of MT4 Does not support MT5, mobile phones, tablets The indicator only shows the day's entry arrow The previous history arrow will not be displayed (Live broadcast is for demonstration) The indicator is a trading aid Is not a EA automatic trading No copy trading function The indicator only indicates the entry position No exit (target profit)  The entry stop loss point is set at 30-50 PIPS Or the front
    This is the indicator for the biggest money.  It's performance is exceptional. Whatever interest there is in the market you will see it.  In almost all cases it will only give you a long term view of the market, but don't be fooled into thinking this is event bound. Nothing like that. It finds where the biggest interest is in the market and shows it to you. Do not forget that the biggest money (interests)  not shown on the market everyday . That's something you haven't encountered.The price is
    Mafaranga
    Phillimon Shumbusho
    The real market buy/Sell signals, you can trust.  This indicator tracks the trend strength, the market strength, the real current volume, and the price direction to give traders and investors the optimum point for entry in the form of signals. The time frames range from 5 minutes to one (1) hour chart. Trading on higher time frames produce the best outcomes, but also do produce less frequent trades, compared to trading on lower time frames.
    Oni Scalper
    Goh Cheng Wai
    5 (2)
    Dear Onis, This Indicator is used for   GBPUSD, US30 and GOLD on 1-Min Chart . For US30 , Depending on your broker, Minimum Lot Size will differ from 0.01 to 1.0 lots. My Current Account is trading at 1.0 lots at $1 per point . Please check with your Broker what's the Margin Required for your Minimum lot sizes before you trade on your Real account. I have Forward Tested the indicator for around 6 months before releasing it to the public. ( No Demo is available for the Indicator, Strategy
    Arbitrage Indicators is a professional and easy-to-use Forex trading indicator that uses the best trading principles of the latest AI arbitrage models. This indicator provides accurate buy and sell signals. Applies to currency pairs only. It has six different metrics options, MACD, KDJ, RSI, CCI, RVI, DEMARK. It can be freely switched by users, and intuitively shows the direction and reversal signal of the currency pair. When the two lines cross colors, the currency has a high probability of rev
    Al in one level
    Kundan Kumar Srivastava
    5 (1)
    This indicator is collection of important dynamic support and resistance giving a trader crystal clear idea , where to sell and where to buy. it completely complements trend lines, support, resistance, and sideways market and allow a trader to make sustainable profits. The thickness of lines suggests its strengths, the thicker the dynamic line, the stronger is rejection or pullback allowing a trader to make multi-fold profit, as they can clearly see them. Introducing Your Ultimate Trading Edge
    Automatic, live & interactive picture of all trendlines. Assign push, email and sound alerts to the lines of your choice and be informed about price rollback, breakout, rollback after breakout, number of rollbacks, line expiration by double breakout. Correct, drag or delete the lines and interactively tune the line system. https://youtu.be/EJUo9pYiHFA . Chart examples https: //www.mql5.com/en/users/efficientforex Price Interaction Events All events are effective immediately and only after on
    The indicator displays the probable ( Support and resistance ) levels. The indicator draws horizontal and trend levels of support and resistance. The indicator settings: Trends - the mode for displaying trend lines or horizontal lines of support and resistance Yes - display trend lines only No - display horizontal lines only UseResource - use the resources built into the indicator. Yes - use the ZigZag indicator from the resources of the product. No - use a custom ZigZag indicator. HistoryBar -
    The indicator of a Professional Trader is an arrow indicator for predicting the direction of price movement. I have been working on this indicator since 2014. You can use this indicator as your main indicator, use its entry signals, and use it as your only indicator to find entry points. About the product: Recommended TF [H4-D1-W1]   . The indicator predicts the direction of the next candle. Fits a variety of tools; Flexibility in settings for different instruments and intervals through the
    The [GRAFF] III manual trading system is based on multiple MetaTrader (MT4) indicators. Together, the entire PACK of GRAFF III indicators makes an advanced trading tool. The system consists of over 20 different custom-built indicators which have been carefully selected and tested in the long term to produce strong and efficient trading signals. The particular indicators are based on different mathematical formulas, so the entire system is calibrated to remove false signals from its own indicator
    You can fins our other products from link : https://www.mql5.com/en/users/drbastem/seller   Also, you can ask all your questins from email : haskayafx@gmail.com or mobile : +90 530 867 5076 or @MehmetBastem    on telegram application This indicator is used to determine the trend. Standard Osma indicator is used. It has the indicator warning system: beep, e-mail and has three types of alerts, including messages to mobile phone. It shows the best performance on the chart of 5 minutes. When the
    You can fins our other products from link : https://www.mql5.com/en/users/drbastem/seller   Also, you can ask all your questins from email : haskayafx@gmail.com or mobile : +90 530 867 5076 or @MehmetBastem    on telegram application This indicator is used to determine the trend. Standard Three Moving Average and ADX indicators are used. It has the indicator warning system (audio, e-mail) and three types of alerts, including messages to mobile phone. It shows the best performance on M5. When
    This indicator is used to determine the trend. Standard Three Moving Average and ADX indicators are used. It has the indicator warning system (audio, e-mail) and three types of alerts, including messages to mobile phone. It shows the best performance on M5. When the trend value reaches the value set, the warning system is activated. This indicator works only with Forex symbols. Inputs SoundAlarm = true - Sound Alert Sendmail=true - Send an e-mail in case of a buy or sell signal Sendnotificatio
    You can fins our other products from link : https://www.mql5.com/en/users/drbastem/seller   Also, you can ask all your questins from email : haskayafx@gmail.com or mobile : +90 530 867 5076 or @MehmetBastem    on telegram application This indicator is used to determine the trend. Standard MACD indicator is used. It has the indicator warning system: beep, e-mail and has three types of alerts, including messages to mobile phone. It shows the best performance on the chart of 5 minutes. When the
    This indicator offers a robust market analysis method centered around the concept of the 'Regression Channel Tool'. By harnessing this tool, traders can gain exceptional control over their chart's regression channel, enabling them to make more informed trading decisions. The Regression Channel Tool is a powerful instrument in a trader's toolkit. It's designed to provide valuable insights into price trends and potential support and resistance levels. The tool is especially effective for visualizi
    A simplistic indicator informing a user on RSI divergence by sending messages to mobile device and email. The indicator draws 2 vertical lines, marking two RSI extrema that formed the divergence. You get the alert, open the charts and make a decision. The indicator does not show past divergences, thus when you attach it to a chart for the first time you see nothing. Graphics and alerts will appear as soon as divergences do. Drop it in Tester to see how it works. Parameters: RSIPeriod - number of
    Green Wall Arrows
    Daniel Luchinger
    1 (1)
    The Name Green Wall : Arrows hits a lot of TP, by changing the idea of non using SL as something bad, but instead use Small TP and a lot of free Margin and Patience. Use micro TP and a lot of Free Margin with this indicator on Forex. It also can be used with Binary Options. This strategy is intended to be traded Manually. This Indicator runs on Open Bar, arrows will delete when price are against it. The only Indicator Parameter is Alerts true/false, all the rest is included inside the code. Arro
    Golden Monowave
    Ahmed Mohamed Ali
    Golden Monowave is monowave indicator, the monowave theory is one of Elliott wave approach and one of most complicate and accurate method. Golden Monowave can shortcut many major steps to identify and describe the monowave. It works on any timeframe and with any trading instrument, including currencies, indices, futures, etc. Input Parameters initial_Bars - set the initial number of bars to calculate. wave_color - select the color of the wave. label_color - select the color of labels. temp_lab
    Ticks Size
    Viktor Kolmakov
    This indicator displays in a separate window the difference between the number of points which increased the price, and the number of points that decreased the price during the time interval specified in the settings. The time interval for calculation is expressed as the number of bars of the chart the indicator is attached to. This approach allows you to evaluate the movement direction (growth or fall) of the instrument's price, the strength of the movement and the size of the movement in point
    NostradamusMT4
    Andrey Spiridonov
    1 (1)
    NostradamusMT4 is a powerful indicator from the set of professional trader. The indicator is based on Andrei Spiridonov's original price calculation method (ESTIMATED PRICE) for the current candle price. Advantages The indicator does not redraw. It works on any timeframes. Works with any trading instruments. Perfectly suitable for scalping and trading binary options. Parameters Color - color of the ESTIMATED PRICE FUTURE line. How to work with the indicator The indicator forms the ESTIMATE
    BinaryIndicator
    Andrey Spiridonov
    BinaryIndicator is a highly accurate indicator for trading binary options. It shows excellent results in scalping. This indicator is based in multifactor analysis of trend indicators, as well as confirmation oscillators, which in the end gives an increased accuracy of signals. Advantages of the indicator Increased accuracy of signals. Excellent results when trading binary options with a short expiration time from M30 to M1 . It works on any timeframes. Works with any trade symbols. Parameter
    FutureTrade
    Andrey Spiridonov
    3 (2)
    FutureTrade is one of the few indicators that predicts the price right on the price chart. The indicator calculation algorithm is based on the fast Fourier transform. Given the oscillatory behavior of the price, the Fourier function predicts its future behavior. The indicator should be attached in the usual way to a chart with the trading instrument specified symbol and with the M15 timeframe. This timeframe is the most optimal for working with any symbols. Once started, the indicator calculates
    XCalper Triad MT4
    Aecio de Feo Flora Neto
    xCalper Triad works as a Target scanner tool. Its algorithm calculates price level areas with high precision and instantly. By default, they are automatically identified and the trader normally sets visual parameters only. Explore a new perspective in price action analysis by adding Triad to your setup and surprise yourself. Main Features Automatic & exclusive Target levels Daily candle representation in all intraday timeframes. Side panel information essential to all traders: Remaining time t
    BinaryScalping
    Andrey Spiridonov
    BinaryScalping is a professional indicator for trading binary options and scalping. The algorithm of the indicator is based on the calculation of pivot points for each time period separately, the location of the price of the trading instrument relative to the pivot points is analyzed and the probability of a trading operation is calculated. The indicator has a built-in filter of trading signals based on the global trend. The indicator is installed in the usual way and works with any trading inst
    More from author
    [V 1.30] MTF NRPA 5 RSI RTD has been released! (New algo 2025!) Non repaint arrow real time dashboard. If you are tired of using various RSI indicators but find that they are inaccurate, then try this one tool. Usually people only install 1 RSI to determine the OBOS level in a timeframe. The bad news is that you can't see OBOS levels and trends in various timeframes at once. That's why I developed this trading tool. Here's how it's explained: On this trading tool, I use five RSI. Yes, five! By
    Analyzing multiple time frames of a currency pair in one window can make you confused. To analyze multiple time frames, you need reliable indicators. One of them is using 9TF MACD Curve . I've been working day and night to create code that is simple but reliable and covers all nine time frames in just one indicator .  Let's look at some of the advantages of this indicator: Colorful histogram . The color of the curve in each timeframe is different from one another.  Arrows indicating the crossin
    Analyzing multiple time frames of a currency pair in one window can make you confused. To analyze multiple time frames, you need reliable indicators. One of them is using 9TF STOCH RSI . I've been working day and night to create code that is simple but reliable and covers all nine time frames in just one indicator .  Let's look at some of the advantages of this indicator: Colorful histogram . The color of the curve in each timeframe is different from one another.  Arrows indicating the crossing
    Analyzing multiple time frames of a currency pair in one window can make you confused. To analyze multiple time frames, you need reliable indicators. One of them is using 9TF RSI MA . I've been working day and night to create code that is simple but reliable and covers all nine time frames in just one indicator .  Let's look at some of the advantages of this indicator: Colorful histogram . The color of the curve in each timeframe is different from one another.  Arrows indicating the crossing of
    Analyzing multiple time frames of a currency pair in one window can make you confused. To analyze multiple time frames, you need reliable indicators. One of them is using 9TF MACD Limited Bar . I've been working day and night to create code that is simple but reliable and covers all nine time frames in just one indicator .  Attention! When first installed, the indicator does not look intact. Changing the timeframe will solve the problem. Let's look at some of the advantages of this indicator: C
    Analyzing multiple time frames of a currency pair in one window can make you confused. To analyze multiple time frames, you need reliable indicators. One of them is using 9TF STOCH RSI LIMITED BAR . I've been working day and night to create code that is simple but reliable and covers all nine time frames in just one indicator .  Attention! When first installed, the indicator does not look intact. Changing the timeframe will solve the problem. Let's look at some of the advantages of this indicat
    Analyzing multiple time frames of a currency pair in one window can make you confused. To analyze multiple time frames, you need reliable indicators. One of them is using 9TF Double RSI Double MA . I've been working day and night to create code that is simple but reliable and covers all nine time frames in just one indicator .  Let's look at some of the advantages of this indicator: Double RSI , i.e RSI faster & RSI slower. Double MA , i.e MA faster & MA slower. MA angle of fast & slow. ( Note
    Analyzing multiple time frames of a currency pair in one window can make you confused. To analyze multiple time frames, you need reliable indicators. One of them is using 9TF Double CCI Double MA . I've been working day and night to create code that is simple but reliable and covers all nine time frames in just one indicator .  Let's look at some of the advantages of this indicator: Double CCI , i.e CCI faster & CCI slower. Double MA , i.e MA faster & MA slower. MA angle of fast & slow. ( Note
    An accurate CCI indicator is available. Dashboard Trend Bar Smart Level 9TF Double CCI. Double CCI , i.e Fast CCI & Slow CCI Why you need second CCI? Using additional indicators will convince us more in live trading 9TF Fast CCI curve 9TF Slow CCI curve 9TF real time  CCI angle 9TF real time CCI value 9TF real time CCI direction/phase 9TF Trend Bar   New algo in calculating trend bar On/off Button . Very useful to show/hide indicator in just one click Real time 9TF dashboard monitor   Ability to
    An accurate RSI indicator is available. Dashboard Trend Bar Smart Level 9TF Double RSI. Double RSI , i.e Fast RSI & Slow RSI Why you need second RSI? Using additional indicators will convince us more in live trading 9TF Fast RSI curve 9TF Slow RSI curve 9TF real time  RSI angle 9TF real time RSI value 9TF real time RSI direction/phase 9TF Trend Bar   New algo in calculating trend bar On/off Button . Very useful to show/hide indicator in just one click Real time 9TF dashboard monitor   Ability to
    An accurate MACD indicator is available. Dashboard Trend Bar Smart Level 9TF Dual MACD. Dual MACD , i.e Fast (MACD 1) & Slow (MACD 2) Why you need second MACD? Using additional indicators will convince us more in live trading 9TF Fast MACD 1 curve 9TF Slow MACD 2 curve 9TF real time  MACD angle 9TF real time MACD value 9TF real time MACD direction/phase 9TF Trend Bar   New algo in calculating trend bar On/off Button . Very useful to show/hide indicator in just one click Real time 9TF dashboard m
    An accurate Stochastic indicator is available. Dashboard Trend Bar Smart Level 9TF Dual Stochastic. Dual Stochastic , i.e Fast Stochastic & Slow Stochastic  Why you need second Stochastic? Using additional indicators will convince us more in live trading 9TF Fast Stochastic curve 9TF Slow Stochastic curve 9TF real time  Stochastic angle 9TF real time Stochastic value 9TF real time Stochastic direction/phase 9TF Trend Bar   New algo in calculating trend bar On/off Button . Very useful to show/hid
    [V 1.40] MTF NRPA 5 Moving Average RTD has been released! ( New algo 2025 ) Non repaint arrow real time dashboard. If you are looking for the best moving average indicator then you are on the right page. Generally people will install two moving averages because the intersection of the two moving averages (the crossover) will determine the direction of the next price trend. If the fast moving average intersects with the slow moving average and fast > slow then the trend is up. Conversely, if the
    Introducing the advanced trading tools of 2023. MTF PPAAF Model S. This is sub window version of my best trading tool : MTF Precise Price Action Arrow Filtered.  Click here to learn more about MTF PPAAF . This trading tool is equipped with various powerful features : MTF = Multi Time Frame = Time Frame can be changed. On/off button. Non Repaint Arrows.  Customizable parameter, color etc.  Can show all time frame (ATF) crossover arrows of fast stochastic main line & fast stochastic signal line (
    If you are curious about the position of the stochastic, RSI, CCI curve, whether it is at the OBOS level or not, then this trading tool is for you. Introducing the advanced trading tools of 2024. ATF Trend Following Trend Bar OBOS. This indicator is similar to MTF PPAAF Model S but have two layers.  Click here to learn more about MTF PPAAFS . This trading tool is equipped with various powerful features : MTF = Multi Time Frame = Time Frame can be changed. On/off button. Customizable parameter,
    Hello traders. Introducing my best trading tool : MTF PPAAF Model T. Multi Time Frame Precise Price Action Arrow Filtered Model T. This trading tool is my best work after years of making various trading tools. This trading tool is similar to the original MTF PPAAF but you can monitor per TF curve of Double RSI and Stochastic visually from M1 to MN which is very very important! Why is this trading tool the best and reliable? 1. This tool uses 7 indicators :  Similar to the original MTF PPAAF
    With this trading tool, you can scan 15 markets simultaneously . Introducing, new trading indicator 2024 : ️ Dashboard Multi Currency Multi Time Frame Stochastic. There are at least two reasons why I created this trading tool : First , I'm bored of only observing one market. Second , I don't want to lose the entry moment in another market. That's why I want to know other market conditions at the same time. For this reason, I need a scanner that can scan the conditions of several market
    With this trading tool, you can scan 15 markets simultaneously . Introducing, new trading indicator 2024 : ️ Dashboard Multi Currency Multi Time Frame Double CCI. There are at least two reasons why I created this trading tool : First , I'm bored of only observing one market. Second , I don't want to lose the entry moment in another market. That's why I want to know other market conditions at the same time. For this reason, I need a scanner that can scan the conditions of several market
    With this trading tool, you can scan 15 markets simultaneously . Introducing, new trading indicator 2024 : ️ Dashboard Multi Currency Multi Time Frame Double RSI. There are at least two reasons why I created this trading tool : First , I'm bored of only observing one market. Second , I don't want to lose the entry moment in another market. That's why I want to know other market conditions at the same time. For this reason, I need a scanner that can scan the conditions of several market
    Filter:
    No reviews
    Reply to review
    Version 5.50 2024.12.31
    In this new Version V 5.50 :
    - Adding Another On Chart Four MA feature
    - Adding MTF Angle RSI CCI feature
    - New algo Dual Pivot ATF
    Version 5.40 2024.12.18
    In this new Version V 5.40 :
    - Fixing trading in the zone (TITZ)
    - TITZ applied to pivot horizontal line and vertical line
    - Customizing on chart four MA feature
    Version 5.30 2024.11.28
    In this new Version V 5.30 :
    - Fixing belt trend arrows
    - Adding belt trend calculation mode
    Version 5.20 2024.11.20
    In this new Version V 5.20 :
    - Adding calculation mode for trading in the zone (vertical and horizontal)
    - Adding Trend Bar 9TF RSIMA CCIMA (complete!)
    Version 5.10 2024.09.20
    In this new Version V 5.10 :
    - Adding Trend Bar 3TF RSIMA CCIMA arrows scheme
    Version 5.0 2024.09.10
    In this new Version V 5.00 :
    - Replay system applicable to Dual Pivot ATF
    - Adding display type to Dual Pivot ATF
    Version 4.90 2024.08.26
    In this new Version V 4.90 :
    - Adding Dual Double CCI
    - Adding DCCI calculation mode
    Version 4.80 2024.08.13
    In this new Version V 4.80 :
    - Deconstruct from the beginning
    - Adding CCIMA indicator
    - Adding triple MTF cloud histo
    - Adding triple MTF confluence multi mode
    - Adding trend bar 3TF RSIMA/CCIMA
    - Adding dual pivot all time frame
    - Adding color level scheme
    - Customizing on chart feature
    - Optimizing the loading time
    Version 4.70 2024.04.03
    In this new Version V 4.70 :
    - Fixing pivot value horizontal line trading in the zone
    - Customizing Dual MTF Cloud Histo
    Version 4.60 2024.03.29
    In this new Version V 4.60 :
    - Changing MTF Belt Trend to Dual MTF Belt Trend
    - Adding trend following feature to MTF Belt Trend
    - Adding time frame scheme True RSIMA
    - Customizing On Chart Dual DRSI
    - Customizing On Chart Dual Stochastic
    - Customizing On Chart True RSIMA
    Version 4.50 2024.03.18
    In this new Version V 4.50 :

    - Deleting Super Trend Arrows (only dashboard available with lines and trend bar) to optimize the rendering time
    - Deleting Trend Bar 3TF of SRCM (Stoch,RSI,CCI,MACD)
    - Deleting Trend Bar 3TF of MA5 x MA6
    - Deleting confluence 3TF of Stochastic
    - Deleting confluence 3TF of MACD
    - Deleting confluence 3TF of MA1 x MA2
    - Deleting confluence 3TF of DRSI
    - Deleting confluence Dual Stoch
    - Deleting confluence Dual MACD
    - Adding MTF Belt Trend
    - Adding Dual MTF Cloud Histo
    - Adding 3TF True RSIMA lines
    - Adding 3TF True RSIMA trend bar
    - Adding 3TF True RSIMA dashboard
    - Adding horizontal line trading in the zone
    - Adding pivot value horizontal line trading in the zone
    - Fixing vertical lines trading in the zone
    - Total mode right now is 13 (previously 9)
    Version 4.40 2024.02.02
    In this new Version V 4.40 :
    - Adding trend bar feature of True RSIMA
    - Adding dashboard feature of True RSIMA
    - Adding vertical lines feature of trading in the zone
    - Adding current time and broker time feature
    - Modifying trend bar 3 time frame
    - Fixing dashboard monitor position
    - Fixing price index location
    Version 4.30 2024.01.25
    In this new Version V 4.30 :
    - Fixing histogram of MTF Belt Trend
    Version 4.20 2024.01.25
    In this new Version V 4.20 :
    - Fixing OBOS level of ATF dashboard
    - Adding calculation mode of TB TRD FOL 3TF, i.e DCCI and FDMACD
    - Adding histogram to MTF belt trend
    Version 4.10 2024.01.10
    In this new Version V 4.10 :
    - Fixing ATF Stochastic and ATF MACD
    - Fixing algorithm of confluence 3TF
    - Fixing algorithm of STF Dual Stochastic and Dual MACD
    Version 4.0 2024.01.03
    In this new Version 4.00 :
    - Adding background color to trend bar 3TF
    - Adding Mode 8 : Show ATF MA 1x2 DRSI
    - Adding timeframe scheme of trading in the zone
    - Adding timeframe scheme of trend following STF
    - Adding timeframe scheme of trend bar trend following 3TF
    - Fixing dashboard of RSIMA
    Version 3.90 2023.12.22
    In this new Version 3.90 :
    - Deleting favorite arrows
    - Adding MTF Trendbar Trend Following 3 Time Frame FDSTOCH/DRSI
    - Adding MTF Trendbar Average 3 Time Frame FDSTOCH/DRSI
    - Adding MTF Trendbar Trend Following 3 Time Frame MA5 x MA6
    - Adding MTF Trendbar Average 3 Time Frame MA5 x MA6
    - Fixing status quo of trading in the zone
    Version 3.80 2023.11.20
    In this new version V 3.80 :
    - I fixed the 1 minute RSIMA dashboard
    - I limited the number of favorite arrow mode to three
    Version 3.70 2023.11.16
    In this new version V 3.70 :
    - I fixed the RSIMA dashboard
    - I added favorite arrow calculation modes
    Version 3.60 2023.11.13
    In this new version V 3.60 :
    - I added favorite arrow feature
    - I set up trading in the zone interface
    - I added W1 timeframe scheme for trend following STF arrows
    Version 3.50 2023.11.06
    In this new version V 3.50 :
    - I changed the symbol for MACD above zero and MACD below zero level.
    - I changed the code of square STF trend following.
    Version 3.40 2023.10.30
    In this new Version 3.40 :
    - I limited the number of candle high time frame
    - I added arrow size option to trend following STF arrows
    Version 3.30 2023.10.25
    In this new Version 3.30 :
    - I fixed the on off button sound
    - I added trend bar 9TF of STA mode 2 from current time frame (0) to previous 5 bar ago (5)
    - I fixed on chart dual stochastic channel
    - I fixed dashboard position
    - I modified algorithm in STA mode 1 & mode 2
    - I added time frame scheme for trend following STF
    Version 3.20 2023.10.19
    In this new Version 3.20 :
    - I changed the dashboard font so it looks clear
    Version 3.10 2023.09.25
    In this new Version 3.10 :
    - Reduce total mode to only 8, i.e show all time frame crossover arrows and trading in the zone
    - Modifying parameter setting
    - Can show all time frame crossover arrows of fast CCI and slow CCI, i.e DCCI
    - Modify the status for mode 8
    - Can show trend following selected time frame of fast stochastic, RSI 1x2, CCI 1x2, fast macd and RSIxMA outside the modes.
    Version 3.0 2023.09.06
    In this new Version 3.00 :
    - Modifying STA algorithm both for calculation mode 1 and mode 2
    - Modifying dashboard color scheme
    - Modifying parameter setting
    Version 2.90 2023.09.04
    In this new Version 2.90, I added new features :
    - Adding Mode 29 : Show ATF Fast Stoch DRSI. With this feature monitoring all time frame arrows of stochastic and RSI is easy.
    - Adding STA Calculation Mode. The first mode is based on crossover of RSI & MA and the second mode is based on crossover of fast RSI & slow RSI.
    Version 2.80 2023.08.30
    In this new Version 2.80, I added new feature :
    - Adding Time Spread Profit Info (TSPI) indicator
    Version 2.70 2023.08.21
    In this new Version 2.70, I make monitoring visually Stoch RSI easy :
    - Modifying on chart dual stochastic
    - Modifying on chart double rsi
    - Modifying on chart rsioma
    - Modifying color level
    Version 2.60 2023.08.13
    In this new Version 2.60, I added new feature :
    - Adding STF belt trend
    - Fixing on chart range
    - Changing arrow code DRSI and DCCI
    Version 2.50 2023.07.31
    In this new Version 2.50, I added new feature :
    - Adding confluence of 3TF MA 1x2
    - Changing arrow code for trend following double CCI
    - Changing arrow code for trend following double RSI
    Version 2.40 2023.07.25
    In this new Version 2.40, I added new features :
    - Adding confluence of 3TF Fast DSTOCH
    - adding confluence of 3TF Fast DMACD
    - Adding trend following STF of DRSI
    - Adding STA monitor, i.e (from top to bottom) H1,H4,D1,W1,MN1
    Version 2.30 2023.07.18
    In this new Version 2.30, I added new features :
    - Added mode 28 : show trading in the zone
    - Added 9TF double CCI dashboard monitor
    - Added selected timeframe of double CCI crossover arrows
    - Added STA monthly arrows
    - Added three new dashboard color scheme
    - Fixing STA, dual stochastic & dual MACD algorithm
    Version 2.20 2023.07.11
    In this new Version 2.20, I added new features :
    - Added upper bound 100 & lower bound 0 for on chart dual stochastic
    - Added upper bound 100 & lower bound 0 for on chart double rsi
    - Fixing trading in the zone four MA
    - Added timeframe scheme for four MA
    - Fixing RSIMA dashboard
    Version 2.10 2023.07.04
    In this new Version 2.10 :
    - Fixing DRSI arrow TF MN1
    - Fixing color super trend arrows
    - Fixing arrow MA 3 x MA 4
    - Added timeframe scheme D1,W1,MN1 for conflux DRSI
    Version 2.0 2023.07.03
    In this new Version 2.00, I added new features :
    - Added confluence arrows of 3 timeframe double RSI
    - Added 12 timeframe scheme to choose from for confluence of double RSI
    - Fixing algorithm for trend following dual stoch and dual macd
    Version 1.90 2023.06.26
    In this new Version 1.90, I added new features :
    - Added super trend arrows higher timeframe
    - Added MACD above or below zero level into dashboard
    - Fixing MTF feature
    Version 1.80 2023.06.20
    In this new Version 1.80, I've made a lot of changes :
    - Change the appearance of the dashboard from a circle to a square shape.
    - Fixing color OBOS of slow stochastic and slow drsi.
    - Added feature on chart slow stochastic.
    - Added feature pivot value of all time frame of Fast Stoch.
    - Added feature pivot value of all time frame of Fast MACD.
    - Added feature pivot value of all time frame of MA 1,2.
    - Added feature pivot value of all time frame of Double RSI.
    - Added feature pivot value of all time frame of RSIMA.
    - Added feature MTF candle high time frame.
    - Ability to change/shift the starting time to monitor in real time 9TF dashboard.
    Version 1.70 2023.06.02
    In this new Version 1.70, I've added the ability to monitor visually :
    - On chart stochastic makes it easy for us to observe the movement of stochastic main line and stochastic signal line along the OBOS channel.
    - On chart four MA makes it easy for us to observe the movement of MA 1 cross MA 2 and MA 3 cross MA 4.
    - On chart double RSI makes it easy for us to observe the movement of RSI fast line and RSI slow line along the OBOS channel.
    - On chart true RSIMA makes it easy for us to observe the movement of RSI line and MA line along the OBOS channel.
    This on chart double RSI or on chart true RSIMA will make monitoring RSI divergence much more accurate than installing RSIMA on sub window.
    And also I changed the appearance of the 10 dashboard color scheme to be more attractive.
    Version 1.60 2023.05.23
    In this new Version 1.60, I've made trading in the zone much more easy :
    - Added four MA dashboard monitor (not just two MA!)
    - Added four MA lines on chart (by default : MA 1x2 on current timeframe and MA 3x4 on M30)
    - Customizable four MA lines
    - Button can be located on sub window
    Version 1.50 2023.05.03
    In this new Version 1.50, I've made a lot of reconstruction :
    - Total mode up to 27
    - New feature : Show Trend Following ATF TWOMA Filtered By Trend Following Selected TF of FAST STOCH
    - New feature : Show Trend Following ATF TWOMA Filtered By Trend Following Selected TF of FAST MACD
    - New feature : Show Trend Following ATF TWOMA Filtered By Trend Following Selected TF of DRSI
    - New feature : Show Trend Following ATF TWOMA Filtered By Trend Following Selected TF of RSIMA
    - Trend following = non repaint arrows!
    - Fixing algorithm of button
    - Adding color level type
    Version 1.40 2023.04.11
    In this new Version 1.40, I've made a lot of reconstruction :
    - Total mode up to 23
    - New feature : Show Trend Following All Timeframe of Two MA
    - New feature : Show Trend Following All Timeframe of Double RSI
    - New feature : Show Trend Following All Timeframe of RSIMA
    - New feature : Show Trend Following Selected Timeframe of Two MA
    - New feature : Show Trend Following Selected Timeframe of Double RSI
    - New feature : Show Trend Following Selected Timeframe of RSIMA
    - New feature : Show Trend Following Selected Timeframe of Dual Stoch
    - New feature : Show Trend Following Selected Timeframe of Dual MACD
    - Trend following = non repaint arrows!
    - Fixing algorithm of mode 21 : Show Selected TF of STOCH,MACD,TWOMA,DRSI Filtered By Trend Following RSIMA
    - Parameter values can be hide/show
    Version 1.30 2023.03.30
    In this new Version 1.30, I've made a lot of reconstruction :
    - Added dual stochastics dashboard monitor (fast stoch = stochastic 1 and slow stoch = stochastic 2)
    - Added dual macd dashboard monitor (fast macd = macd 1 and slow macd = macd 2)
    - Fixing MA Phase of RSIMA
    - Change arrow code
    - New feature : showing trend following arrows of stochastics and macd
    - Dashboard monitor can be hide
    Version 1.20 2023.03.12
    In this new Version 1.20, I've made a lot of reconstruction :
    - Fixing daily arrow of MACD
    - Fixing arrow of RSIMA
    - New algo in determining the up and down arrows
    - New feature : showing arrows of Stochastic, MACD, Two MA and RSIMA at once
    - Adding the RSIMA 9TF dashboard monitor
    - Beautify the dashboard monitor
    Version 1.10 2023.02.27
    New version 1.10 with new feature available:
    - Adding the ability to filter price action by all time frame (ATF) Two Moving Average
    - Adding the ability to filter price action by all time frame (ATF) Double RSI
    - Adding the value of Stochastic on all time frame
    - Adding the value of CCI on all time frame