• Übersicht
  • Bewertungen (6)
  • Diskussion (12)
  • Neue Funktionen

Multi Anchored VWAP

4.6

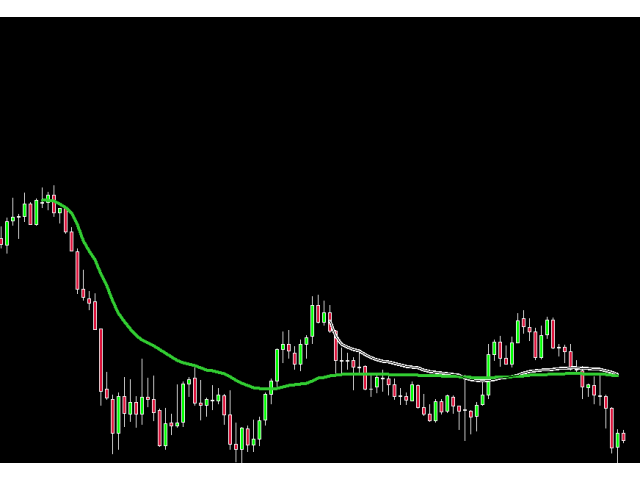
Anchored Volume Weighted Average Price (AVWAP, or Anchored VWAP). Tells you who is in control, the buyers or the sellers. Better than all other moving averages because it adds weight to the traded volume. This technique was made popular by Brian Shannon of Alphatrends. It is calculated by multiplying typical price by volume, and the dividing by total volume.

It is very simple to use.

1. Press a number from 1 to 9 on the keyboard, then click the chart where you want to anchor the VWAP.

3. Hold Ctrl and click the chart to erase lines 1 to 8.

4. Line 9 shows up on all charts, use this to anchor from a major event. It is a Global AVWAP.

5. Press 0 then click chart to erase line 9."

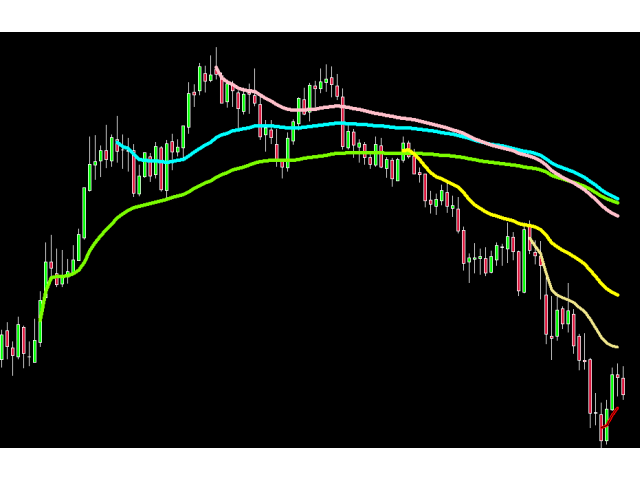
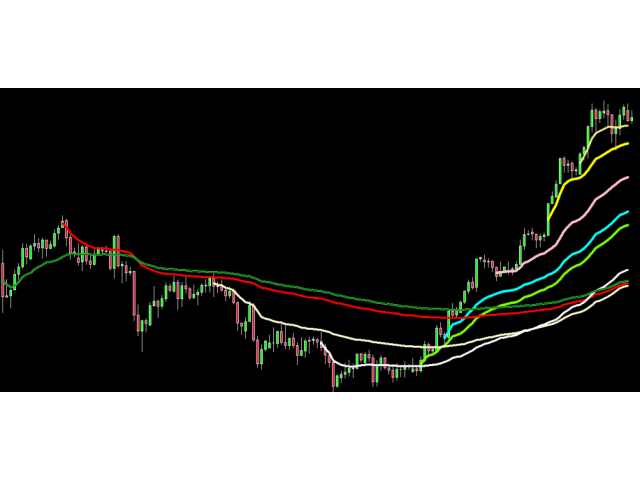
Each number will produce a different coloured line.

When the timeframe is changed the lines stay on the chart.

COLORS

All ODD numbers (1,3,5,7,9) are in the GREEN color family.

All EVEN numbers (2,4,6,8) are in the RED color family.

This makes it easy to assign VWAP to pivot highs and pivot lows, more visually meaningful.

The anchored VWAP lines update as new bars are created on the chart.

if you have any problems using the indicator or have any other questions, do not hesitate to contact us.

About: I run a small team of professional traders with experience in software development. We have been on the market for over 21 years and specialize in the development of MetaTrader 4 software


VWAP vs AVWAP

VWAP is Volume Weighted Average Price

AVWAP is Anchored Volume Weighted Average Price

A traditional VWAP incorporates price and volume in a weighted average and is an ongoing calculation, similar to a moving average.

The AVWAP start off the chart on the left side and continue to to the right side. The AVWAP starts where you anchor it on any visible bar and continues to the right side of the chart. Both can be used to identify areas of support and resistance on the chart.

Introduction to AVWAP

The Anchored Volume Weighted Average Price (AVWAP) indicator ties VWAP calculations to a price bar, or anchor point, chosen by the trader. AVWAP is an important indicator when intraday trading since it graphically tracks the average price of a stock, using a specific price bar relative to the traded volume. It is the most accurate and objective measurement of supply and demand there is.

The AVWAP is a combination of price, volume, and time that makes it special. Traders can objectively determine the emergent sentiment from that moment forward.

The AVWAP can be used on any timeframe and is actually best used on multiple timeframes and because of its moving property, the AVWAP can be analyzed in ways like a traditional moving average. Some considerations when using this indicator; direction and slope of the AVWAP, how far above or below price action is in relation to the AVWAP, etc.

Important Events

Always anchor from important events. The AVWAPs should be anchored from important events and the most important events include start of day (month, quarter, year), major news, mergers, share offerings, gaps, fed announcements, etc.

The first anchor that most people should use is the previous highs and lows in whatever timeframe they are looking at. Consider the high of the week, or the high of the day. Traders can use the previous swing high or low and anchor from there. An anchor from the previous low would give us the average price that traders paid on the run up. Anytime price tries to go below it, it should act as a support since every who bought during the rally does not want to lose money and will step in to defend their position. 

Year to date, month to date, and week to date are some of the most important AVWAPs. These act as strong support and resistance levels. When a new year, month, or week starts, many people start new positions on both long and short side. The YTD, MTD, and WTD AVWAPs show the average price they paid for their positions, and they defend these AVWAPs.

Bewertungen 6
Yalda Soft
114
Yalda Soft 2023.10.17 04:25 
 

A great indicator to use for my strategy. I would love shortcuts for adding 'weekly', 'monthly', 'yearly', and 'quarterly' as I usually also add these as well.

Irmantas Uikis
350
Irmantas Uikis 2023.05.02 16:39 
 

Great indicator. Works fine. I really like 9th blue line, which draw average in all your charts.

Asavage20
76
Asavage20 2022.10.24 09:20 
 

This is the pefect pullback tool.

Empfohlene Produkte
VR Cub
Vladimir Pastushak
VR Cub ist ein Indikator für den Erhalt hochwertiger Einstiegspunkte. Der Indikator wurde entwickelt, um mathematische Berechnungen zu erleichtern und die Suche nach Einstiegspunkten in eine Position zu vereinfachen. Die Handelsstrategie, für die der Indikator geschrieben wurde, hat sich seit vielen Jahren bewährt. Ihr großer Vorteil liegt in der Einfachheit der Handelsstrategie, die es auch unerfahrenen Händlern ermöglicht, erfolgreich damit zu handeln. VR Cub berechnet Positionseröffnungspunkt
This system never paints.   This system created by using Envolpes bands and reverse bar count.   This indicator is only working in M5 period.   This system is for long term and profitable.   Signals are shown as arrows. as an optional limit orders.   You can set a voice alarm or email notification.   You can fins our other products from link : https://www.mql5.com/en/users/drbastem/seller   Also, you can ask all your questins from email : haskayafx@gmail.com or mobile : +90 530 867 5076 or @Meh
To get access to MT5 version please click here . This is the exact conversion from TradingView: "RedK_Supply/Demand Volume Viewer v3.0" by "RedKTrader" This is a light-load processing and non-repaint indicator. All input options are available.  Buffers are available for processing in EAs. You can message in private chat for further changes you need. Thanks for downloading
The  Market Sessions Indicator for MT5 helps you  predict market turnarounds  by detecting major supply and demand areas. These pivot points tend to occur after a new session has started and the previous one is still open. It is also used to gauge how many points or pips the market moves on average during a session. This helps us to place better our take profits and stop losses. The indicator works on all forex pairs, gold, silver, commodities, stocks, indices and any other instrument that yo
Meraz V2
Md Meraz Mahmud
Hello Alright. This indicator works on MT4 and is very easy to use. When you receive a signal from it, you wait for that candle with the signal to close and you enter your trade at the beginning of the next new candle. A red arrow means sell and a green arrow means buy. All arrows comes with a long dotted like for easy identification of trade signal. Are you okay with that?   100% non repaint Work All Major currency  Pair,  1 minute time frame 1 minute expire, 5 minute timeframe 5 minute expire
About
Tatiana Savkevych
About - Forex indicator. This trend indicator is used to determine the current trend in price movement, making it clear in which direction it is better to open a position: buy or sell. The About trend indicator is displayed on the chart and moves in parallel with the price. The Forex About trend indicator allows you to determine in time a change in the direction of price movement, thereby minimizing the likelihood of capital loss. In trading practice, various combinations of About and other ind
JapaneseBreakout
Ahmet Metin Yilmaz
Instructions Attach the indicator to any chart (advised H4) Use input tabs (defaults are 5 and false ) Press ok and continue trading. Description The indicator uses a kind of pattern breakout strategy to help your trading strategy. I am using this strategy on H4 charts for many of pairs with a trailing stop and default indicator settings. Better results are shown on USDJPY, EURJPY, CADJPY, EURGBP, EURUSD, USDCAD, USDCHF, NZDUSD and GBPUSD. Trailing stops should be different for each pair. The
Cosmic Diviner X Planet
Olena Kondratenko
4 (2)
This unique multi-currency strategy simultaneously determines the strength of trends and market entry points, visualizing this using histograms on the chart. The indicator is optimally adapted for trading on the timeframes М5, М15, М30, Н1. For the convenience of users, the indicator renders the entry point (in the form of an arrow), recommended take profit levels (TP1, TP2 with text labels) and the recommended Stop Loss level. The take profit levels (TP1, TP2) are automatically calculated for
LordTrendSignal
Igor Pereira Calil
LordTrendSignal is a financial market indicator for Meta Trader that checks signals through trends and candles, works on all TimeFrames (M1, M5, M15, M30, H1, H4, D1). LordTrendSignal checks the signal through trends and candles and informs you via notification, alerts via email and push on the automatic screen. The trend flexibility of LordTrendSignal is high, however, together with other of our indicators LordAutoFibonacci and LordAutoTrendLine you will be able to work very well to obtain
Limitless MT4
Dmitriy Kashevich
Limitless MT4 ist ein universeller Indikator, der für jeden Anfänger und erfahrenen Trader geeignet ist. funktioniert auf allen Währungspaaren, Kryptowährungen, Rohstoffen Limitless MT4 - bereits konfiguriert und erfordert keine zusätzliche Konfiguration Und jetzt die Hauptsache Warum grenzenloses MT4? 1 völliger Mangel an Neuzeichnung 2 zwei Jahre Test durch die besten Handelsspezialisten 3 Die Genauigkeit der korrekten Signale übersteigt 80% 4 schnitten während der Pressemitte
Koala Supply Demand
Ashkan Hazegh Nikrou
Vorstellung des Koala Supply Demand Indikators für MetaTrader 4: Willkommen beim Koala Supply Demand Indikator. Dieser Indikator wurde entwickelt, um ununterbrochene Angebots- und Nachfragezonen zu identifizieren. Er hilft dem Trader, den Markt als Zonenbereiche zu betrachten; Sie können sehen, wie der Preis einige kraftvolle Zonen respektiert. Der Indikator kann auch Preisaktionssignale anzeigen, wenn sie sich innerhalb der Zonen bilden. Schließen Sie sich dem  Koala Trading Solution Channel 
True SnD
Indra Lukmana
5 (1)
This Supply & Demand indicator uses a unique price action detection to calculate and measures the supply & demand area. The indicator will ensure the area are fresh and have a significant low risk zone. Our Supply Demand indicator delivers functionality previously unavailable on any trading platform. Trading idea You may set pending orders along the supply & demand area. You may enter a trade directly upon price hit the specific area (after a rejection confirmed). Input parameters Signal - S
Noize Absorption Index MT4
Ekaterina Saltykova
5 (1)
Noize Absorption Index - is the manual trading system that measures the difference of pressure between bears forces and bulls forces. Green line - is a noize free index that showing curent situation. Zero value of index shows totally choppy/flat market.Values above zero level shows how powerfull bullish wave is and values below zero measures bearish forces.Up arrow appears on bearish market when it's ready to reverse, dn arrow appears on weak bullish market, as a result of reverse expectation. S
Ugenesys AI MT4
Odaine Ramon Mcmillan
5 (1)
uGenesys AI - 90% Accurate Daytrading Indicator Introducing the ultimate forex trading indicator system, uGenesys AI, powered by cutting-edge AI technology and advanced analytical techniques, including Time-Series Analysis and Genetic Algorithms. Our AI-powered trading system leverages the power of time-series analysis to identify trends and patterns in historical price data, allowing traders to make informed predictions about future market movements. By analyzing vast amounts of data, our sys
Next level of trend trading here. Possibility 75%, the indicator analyzes the current market to determine short (small dot), middle (circle with a dot inside) and long (cross with a circle and a dot inside) trends.  Wingdings characters of  Aqua color represents the beginning of the UP trend. Wingdings characters of  Orange color represents the beginning of the DOWN trend. Possibility 75% Indicator will improve your trading in the world of forex, commodities, cryptocurrencies and indices.
Supply and Demand Dashboard PRO
Bernhard Schweigert
4.8 (20)
Derzeit 20% reduziert! Dieses Dashboard ist eine sehr leistungsfähige Software, die mit mehreren Symbolen und bis zu 9 Zeitrahmen arbeitet. Es basiert auf unserem Hauptindikator (Beste Bewertungen: Advanced Supply Demand ).   Das Dashboard gibt einen guten Überblick. Es zeigt: Gefilterte Angebots- und Nachfragewerte einschließlich der Zonenstärkebewertung, Pips-Abstände zu/und innerhalb von Zonen, Es hebt verschachtelte Zonen hervor, Es gibt 4 Arten von Alarmen für die gewählten Symbole in
The indicator shows you buy/sell signals and does not repaint. It works well with almost all pairs, while the best ones are GBPUSD, XAUUSD and EURUSD. The product works better on H1 and H4. You can change the parameters in the inputs tab to get the best signals and the best trade results on each pair. You can enable/disable alerts when signal appears. The indicator is easy to use. Parameters barstrip & Sensitive: amount of bars to process the highest and lowest prices (relates to the internal
A Boss Stats
Anthonius Soruh
Hi Trader, We are strategy development for Binary and Forex tools, our product have success for binary trading 1 min - 2 min experation. At the moment I build indicator for trading all day, not like Bonosu series with specific time. We launch A-Boss Stats Indicator for trading 1 minute to 5 minutes experation is mean can trade from 1 minutes - 5 minutes. Specification of A Boss Stats trading binary option: Work with all MT4 broker. Chart Time Frame M1 only, can use M5 Experation time for contact
Profile SR
Teresinha Moraes Correia
Description of Support and Resistance Indicator Based on Volume Profile for MetaTrader 4 Introduction The financial market is an arena where traders and investors constantly seek ways to gain a competitive edge. One of the most widely used and respected concepts in any market is support and resistance . These levels represent key price zones where supply and demand balance out, and where significant decisions are made by participants who drive the market. Our Support and Resistance Indicator wit
KT Horizontal Lines MT4
KEENBASE SOFTWARE SOLUTIONS
In MetaTrader, plotting multiple   horizontal lines   and then tracking their respective price levels can be a hassle. This indicator automatically plots multiple horizontal lines at equal intervals for setting price alerts, plotting support and resistance levels, and other manual purposes. This indicator is suitable for Forex traders who are new and looking for chances to make quick profits from buying and selling. Horizontal lines can help traders find possible areas to start trading when the
Indikator. "Indikatorwelle oder Indikator Ma". Unter Verwendung von 23 Standardindikatoren und dem Algorithmus des Autors werden die Einkäufe (von 0 bis +100) und die Verkäufe (von 0 bis -100) berechnet. Dann zeichnet der "Wave Indicator" mit den berechneten Levels eine Welle mit 21 gleitenden Durchschnitten. Die Wellenzahl entspricht der Mittelungsperiode der berechneten Pegel. Wellen Nr. 1 - 7 sich schnell bewegende Durchschnitte Wellen von Nr. 8 bis 14 gleitender Durchschnitte Well
Market Session Pro MT4
Kambiz Shahriarynasab
5 (1)
The  Market Sessions Indicator for MT5 helps you  predict market turnarounds  by detecting major supply and demand areas. These pivot points tend to occur after a new session has started and the previous one is still open. It is also used to gauge how many points or pips the market moves on average during a session. This helps us to place better our take profits and stop losses. The indicator works on all forex pairs, gold, silver, commodities, stocks, indices and any other instrument that your
Classical Divergence , Hidden Divergence both available . Enter a trade with the arrow on lower indicator. Nexus Divergence Pro is the best Divergence tool one can imagine with trade signals you will experience the super functionality. Needless to say how accurate divergence trading can be . Do your research on google you will understand its a standalone super accurate strategy.
If you are good at trading at levels This indicator is all you need levels to manage your trades Market is usually follow current trend when break out some levels or reverse Trade at the Institutional traders level with the best supply and demand zone indicator available in MT4 and MT5 The Secret Profit Levels Signals indicator for MT4 is a complete trading system that provides traders with the entry price and 2 take profit levels. Technical analysts use support and resistance levels to iden
To download MT5 version please click  here . This is the exact conversion from TradingView: "WaveTrend [LazyBear]" By "zeusuk3". One of the coolest indicators out there to detect overbought and oversold zones. It can be used as a part of more complicated strategy and for confirming a potential trade setup. There are buffers to use in EAs also. The indicator is loaded light and non-repaint. - You can message in private chat for further changes you need. Thanks for downloading 
Der Trading Levels Indicator ist ein Handelssystem zur Bestimmung von Einstiegspunkten, zum Halten von Positionen und zur Trendrichtung. Beinhaltet mehrere in einem Komplex arbeitende Mechanismen, Wellenanalyse der Trendrichtung, Pegelanalyse beim Aufbau von Signalen, zeigt mögliche TP- und SL-Ziele an. Indikatorfunktionen Signalpfeile erscheinen auf der aktuellen Kerze und werden nicht neu eingefärbt. Verwendet spezielle Algorithmen, um nach Niveaus zu suchen, von denen der Preis abprallt
Strong Retracement Points Pro demo edition! SRP (Strong Retracement/Reversal Points) is a powerful and unique support and resistance indicator. It displays the closest important levels which we expect the price retracement/reversal! If all level are broken from one side, it recalculates and draws new support and resistance levels, so the levels might be valid for several days depending on the market! If you are still hesitating to start using this wonderful tool, you can check this link to see h
Binary Options Support Resistance Indicator This indicator is designed for binary options trading and effectively shows retracements from support and resistance levels. Signals appear on the current candle. A red arrow pointing downwards indicates a potential selling opportunity, while a blue arrow pointing upwards suggests buying opportunities. All that needs adjustment is the color of the signal arrows. It is recommended to use it on the M1-M5 timeframes as signals are frequent on these timef
The Th3Eng PipFinite indicator is based on a very excellent analysis of the right trend direction with perfect custom algorithms. It show the true direction and the best point to start trading. With StopLoss point and Three Take Profit points. Also it show the right pivot of the price and small points to order to replace the dynamic support and resistance channel, Which surrounds the price. And Finally it draws a very helpful Box on the left side on the chart includes (take profits and Stop loss
Unser Basic Support and Resistance Indikator ist die Lösung, die Sie für die Steigerung Ihrer technischen Analyse benötigen.Mit diesem Indikator können Sie Support- und Widerstandsebenen in der Tabelle projizieren/ MT5 -Version Funktionen Integration von Fibonacci -Ebenen: Mit der Option, Fibonacci -Werte neben Unterstützung und Widerstandsniveau anzuzeigen, gibt unser Indikator einen noch tieferen Einblick in das Marktverhalten und mögliche Umkehrbereiche. Leistungsoptimierung: Mit der Op
Käufer dieses Produkts erwarben auch
Gann Made Easy
Oleg Rodin
4.8 (97)
Gann Made Easy ist ein professionelles und einfach zu bedienendes Forex-Handelssystem, das auf den besten Handelsprinzipien unter Verwendung der Theorie von Mr. basiert. W.D. Gann. Der Indikator liefert genaue KAUF- und VERKAUFSsignale, einschließlich Stop-Loss- und Take-Profit-Levels. Mit PUSH-Benachrichtigungen können Sie auch unterwegs handeln. Bitte kontaktieren Sie mich nach dem Kauf! Ich werde meine Handelstipps und tolle Bonusindikatoren kostenlos mit Ihnen teilen! Wahrscheinlich haben Si
Golden Trend Indicator
Noha Mohamed Fathy Younes Badr
5 (8)
Golden Trend indicator  is The best indicator for predicting trend movement this indicator never lags and never repaints and never back paints    and give  arrow buy and sell    before the candle appear  and it will help you and  will make your trading decisions clearer its work on all currencies and  gold and crypto and all time frame This unique  indicator uses very secret algorithms to catch the  trends, so you can trade using this indicator and see the trend clear on charts  manual guide and
- Real price is 80$ - 40% Discount ( It is 49$ now ) Contact me for instruction, add group and any questions! Related Products:  Bitcoin Expert , Gold Expert Introduction The breakout and retest strategy is traded support and resistance levels. it involves price breaking through a previous level.  The break and retest strategy is designed to help traders do two main things, the first is to avoid false breakouts. Many false breakouts start with a candlestick that breaks out of a level but ends w
Easy Breakout
Mohamed Hassan
5 (6)
After your purchase, feel free to contact me for more details on how to receive a bonus indicator called VFI, which pairs perfectly with Easy Breakout for enhanced confluence!   Easy Breakout is a powerful price action trading system built on one of the most popular and widely trusted strategies among traders: the Breakout strategy ! This indicator delivers crystal-clear Buy and Sell signals based on breakouts from key support and resistance zones. Unlike typical breakout indicators, it leve
Trend Reversal – Ihr Verbündeter zur Erkennung von Trendwenden in MT4 Suchen Sie ein leistungsstarkes und intuitives Werkzeug, um Ihre Marktanalyse zu verbessern und fundiertere Entscheidungen zu treffen? Der Trend Reversal Indikator wurde speziell für Trader entwickelt, die Trendwenden auf der MetaTrader 4 Plattform präzise identifizieren möchten. Dank der Kombination aus fortschrittlichen Algorithmen und bewährten Techniken bietet Trend Reversal klare und sichtbare Signale, um Schlüsselereig
FX Volume
Daniel Stein
4.58 (33)
Verschaffen Sie sich einen echten Vorteil am Forex mit FX Volume: Dem ultimativen Volumenindikator FX Volume ist der erste und einzige Volumenindikator, der die echte Marktstimmung aus der Sicht eines Insiders aufzeigt. FX Volume bietet einzigartige Einblicke in die Positionierung von institutionellen Marktteilnehmern und Brokern und ermöglicht es Ihnen, mit der Voraussicht zu handeln, die normalerweise den großen Akteuren vorbehalten ist. Verabschieden Sie sich von den verzögerten COT-Bericht
FX Power MT4 NG
Daniel Stein
5 (14)
Schöpfen Sie die volle Leistung von FX Power NG aus: Dem ultimativen Währungsstärkemesser Seit mehr als acht Jahren unterstützt FX Power Händler weltweit mit zuverlässigen, präzisen Analysen der Währungsstärke. FX Power NG hebt dieses bewährte Tool nun auf die nächste Stufe und bietet fortschrittliche Funktionen, die Ihnen unübertroffene Genauigkeit, Anpassungsfähigkeit und Einblicke in Ihr Trading ermöglichen. Was macht FX Power NG zu einem Muss für ernsthafte Trader? FX Power NG baut auf a
TPSproTREND PrO
Roman Podpora
4.79 (19)
TPSpro TREND PRO   ist ein Trendindikator, der den Markt automatisch analysiert und Informationen über den Trend und jede seiner Änderungen liefert sowie Signale für den Einstieg in Geschäfte ohne Neuzeichnung gibt! Der Indikator verwendet jede Kerze und analysiert sie separat. bezieht sich auf verschiedene Impulse – Aufwärts- oder Abwärtsimpuls. Exakte Einstiegspunkte in Transaktionen für Währungen, Krypto, Metalle, Aktien, Indizes! Version MT5                   VOLLSTÄNDIGE BESCHREIBUNG DES
TPSpro RFI Levels
Roman Podpora
4.82 (22)
ANWEISUNGEN    Russland -    ENG    Die Empfehlung basiert auf dem Indikator -   TPSpro   TREND PRO -   Version MT5 Die wichtigsten Elemente in der Branche sind entweder in Zonen oder in der Fabrik enthalten, oder sie führen zu einer Lösung bei einem Kauf oder dem Verkauf eines anderen Instruments. Wenn viele Menschen ihre Rechte nicht auf dem Händlerkonto verschlüsseln, werden die Folgen nicht schnell genug sein. Ich habe es damit abgeschlossen, dass ich diese Folgen nun noch interpretieren un
Scalper Inside PRO
Alexey Minkov
4.75 (60)
!!!CHRISTMAS SALE!!! An exclusive indicator that utilizes an innovative algorithm to swiftly and accurately determine the market trend. The indicator automatically calculates opening, closing, and profit levels, providing detailed trading statistics. With these features, you can choose the most appropriate trading instrument for the current market conditions. Additionally, you can easily integrate your own arrow indicators into Scalper Inside Pro to quickly evaluate their statistics and profitab
Hinterlassen Sie nach dem Kauf einen Kommentar, um 4 hochwertige Indikatoren als Bonus zu erhalten. Der Chart Patterns All-in-One Indikator hilft Tradern, verschiedene Chartmuster, die häufig in der technischen Analyse verwendet werden, zu visualisieren. Dieser Indikator unterstützt die Identifizierung möglicher Marktbewegungen, garantiert jedoch keine Rentabilität. Es wird empfohlen, den Indikator vor dem Kauf im Demomodus zu testen. Aktuelles Angebot : 50 % Rabatt auf den "Chart Patterns All i
Ultimate Sniper Dashboard
Hispraise Chinedum Abraham
4.82 (22)
Ermäßigt auf $299! Die Preise können in Zukunft steigen! Lesen Sie die Beschreibung unten! Bestes Einstiegssystem für Ultimate Sniper Dashboard: ULTIMATIVE DYNAMISCHE EBENEN. (Bitte überprüfen Sie meine Produkte) Das Ultimate Sniper Dashboard funktioniert NUR auf Live-Märkten aufgrund der MT4 Multicurrency Testlimits. Wir stellen Ihnen das Ultimate-Sniper Dashboard vor! Unser bestes, das sowohl HA-Sniper, MA-Sniper und viele spezielle Modi enthält. Das Ultimate Sniper Dashboard ist ein
Derzeit 20% Rabatt! Die beste Lösung für jeden Neueinsteiger oder Expert Händler! Dieses Dashboard arbeitet mit 28 Währungspaaren. Es basiert auf 2 unserer Hauptindikatoren (Advanced Currency Strength 28 und Advanced Currency Impulse). Es bietet einen hervorragenden Überblick über den gesamten Forex-Markt. Es zeigt die Werte der Advanced Currency Strength, die Veränderungsrate der Währungen und die Signale für 28 Devisenpaare in allen (9) Zeitrahmen. Stellen Sie sich vor, wie sich Ihr Hande
Dynamic Forex28 Navigator
Bernhard Schweigert
5 (4)
Dynamic Forex28 Navigator – Das Forex-Handelstool der nächsten Generation AKTUELL 49 % RABATT. Dynamic Forex28 Navigator ist die Weiterentwicklung unserer seit langem beliebten Indikatoren und vereint die Leistung von drei in einem: Advanced Currency Strength28 Indicator (695 Bewertungen) + Advanced Currency IMPULSE mit ALERT (520 Bewertungen) + CS28 Combo Signals (Bonus) Details zum Indikator https://www.mql5.com/en/blogs/post/758844 Was bietet der Strength Indicator der nächsten Generation?
Gann Zone Pro
Kirill Borovskii
This indicator identifies and displays zones, as it were areas of strength, where the price will unfold. The indicator can work on any chart, any instrument, at any timeframe. The indicator has two modes. The indicator is equipped with a control panel with buttons for convenience and split into two modes. Manual mode: To work with manual mode, you need to press the NEW button, a segment will appear. This segment is stretched over the movement and the LVL button is pressed. The level is displayed
Der ADR-Umkehrindikator zeigt Ihnen auf einen Blick, wo der Preis derzeit im Verhältnis zu seiner normalen durchschnittlichen Tagesspanne gehandelt wird. Sie erhalten sofortige Benachrichtigungen per Pop-up, E-Mail oder Push, wenn der Preis seine durchschnittliche Spanne und darüber liegende Niveaus Ihrer Wahl überschreitet, sodass Sie schnell in Pullbacks und Umkehrungen einsteigen können. Der Indikator zeichnet horizontale Linien auf dem Chart an den durchschnittlichen täglichen Range-Extreme
Bull versus Bear
Mohamed Hassan
4.47 (17)
Enjoy a   50% OFF   Christmas holiday sale!   Send us a message after your purchase to receive more information on how to get your  BONUS  for FREE  that works in great combination with Bull vs Bear ! Bull versus Bear is an easy-to-use Forex indicator that gives traders clear and accurate signals based on clear trend retests . Forget about lagging indicators or staring at charts for hours because  Bull vs Bear provides real-time entries with no lag and no repaint, so you can trade with conf
Full Forex Market View Dashboard
Opengates Success International
5 (2)
VOLLSTÄNDIGE FOREX-MARKTANSICHT Dashboard-Anzeige Dies ist ein benutzerdefinierter Indikator, der erstellt wurde, um Händlern einen vollständigen Überblick darüber zu geben, was auf dem Markt vor sich geht. Es verwendet Echtzeitdaten, um auf den Markt zuzugreifen und alle Informationen anzuzeigen, die für einen erfolgreichen Handel erforderlich sind. INSTALLATION: Bevor Sie diesen Indikator an Ihren Fenster-Chart anhängen, gehen Sie zum Market Watch Panel Ihres MT4 und AUSBLENDEN Sie al
Trend Screener
STE S.S.COMPANY
4.81 (89)
Trendindikator, bahnbrechende, einzigartige Lösung für Trendhandel und -filterung mit allen wichtigen Trendfunktionen in einem Tool! Es handelt sich um einen 100 % nicht neu zu malenden Multi-Timeframe- und Multi-Währungs-Indikator, der für alle Symbole/Instrumente verwendet werden kann: Forex, Rohstoffe, Kryptowährungen, Indizes und Aktien. ZEITLICH BEGRENZTES ANGEBOT: Der Support- und Resistance-Screener-Indikator ist für nur 50 $ und lebenslang verfügbar. (Ursprünglicher Preis 250 $) (Angebot
Scalper Vault
Oleg Rodin
5 (27)
Scalper Vault ist ein professionelles Scalping-System, das Ihnen alles bietet, was Sie für erfolgreiches Scalping benötigen. Dieser Indikator ist ein komplettes Handelssystem, das von Forex- und Binäroptionshändlern verwendet werden kann. Der empfohlene Zeitrahmen ist M5. Das System liefert Ihnen genaue Pfeilsignale in Richtung des Trends. Es liefert Ihnen auch Top- und Bottom-Signale und Gann-Marktniveaus. Die Indikatoren bieten alle Arten von Warnungen, einschließlich PUSH-Benachrichtigungen.
MetaBands M4
Vahidreza Heidar Gholami
5 (3)
MetaBands verwendet leistungsstarke und einzigartige Algorithmen, um Kanäle zu zeichnen und Trends zu erkennen, sodass es Tradern potenzielle Punkte für den Einstieg und Ausstieg aus Trades bieten kann. Es ist ein Kanalindikator sowie ein leistungsstarker Trendindikator. Es umfasst verschiedene Arten von Kanälen, die einfach durch Verwendung der Eingabeparameter zusammengeführt werden können. MetaBands verwendet alle Arten von Warnmeldungen, um Benutzer über Marktereignisse zu informieren. Funkt
Werden Sie Breaker Trader und profitieren Sie von Änderungen der Marktstruktur, wenn sich der Preis umkehrt. Der Order Block Breaker Indikator zeigt an, wann sich eine Trend- oder Preisbewegung der Erschöpfung nähert und bereit ist, sich umzukehren. Es weist Sie auf Änderungen in der Marktstruktur hin, die normalerweise auftreten, wenn eine Umkehrung oder ein größerer Rückzug bevorsteht. Der Indikator verwendet eine proprietäre Berechnung, die Ausbrüche und Preisdynamik identifiziert. Jedes
Ultimate Index Advisor ist ein fortschrittliches Tool, das entwickelt wurde, um Marktbewegungen präzise zu analysieren und Handelsmöglichkeiten dynamisch zu identifizieren. Der Indikator bietet Signale, die auf einer Kombination von Strategien basieren, die für Trends, Korrekturen und Umkehrungen optimiert sind, was ihn vielseitig für verschiedene Handelsstile macht. Mit einer intuitiven Benutzeroberfläche hebt Ultimate Index Advisor klare Ein- und Ausstiegspunkte durch sichtbare Pfeile im Cha
Zunächst einmal ist es wichtig zu betonen, dass dieses Handelstool ein Nicht-Repaint-, Nicht-Redraw- und Nicht-Verzögerungsindikator ist, was es ideal für professionelles Trading macht. Online-Kurs, Benutzerhandbuch und Demo. Der Smart Price Action Concepts Indikator ist ein sehr leistungsstarkes Werkzeug sowohl für neue als auch erfahrene Händler. Er vereint mehr als 20 nützliche Indikatoren in einem und kombiniert fortgeschrittene Handelsideen wie die Analyse des Inner Circle Traders und Stra
Stratos Pali
Michela Russo
5 (1)
Stratos Pali Indicator   is a revolutionary tool designed to enhance your trading strategy by accurately identifying market trends. This sophisticated indicator uses a unique algorithm to generate a complete histogram, which records when the trend is Long or Short. When a trend reversal occurs, an arrow appears, indicating the new direction of the trend. Important Information Revealed Leave a review and contact me via mql5 message to receive My Top 5 set files for Stratos Pali at no cost! D
Der Volumetrische Orderblock Multi Timeframe Indikator ist ein leistungsstarkes Werkzeug für Trader, die tiefere Einblicke in das Marktverhalten suchen, indem sie Schlüsselpreisbereiche identifizieren, in denen bedeutende Marktteilnehmer Aufträge ansammeln. Diese Bereiche, bekannt als volumetrische Orderblöcke, können als potenzielle Unterstützungs- und Widerstandszonen dienen und bieten einen wesentlichen Vorteil für fundierte Handelsentscheidungen. MT5-Version ansehen unter:   Volumetric Orde
Break and Retest
Mohamed Hassan
4.3 (20)
Enjoy a   50% OFF   Christmas holiday sale!   This Indicator only places quality trades when the market is really in your favor with a clear break and retest. Patience is key with this price action strategy! If you want more alert signals per day, you increase the number next to the parameter called: Support & Resistance Sensitivity.  After many months of hard work and dedication, we are extremely proud to present you our  Break and Retest price action indicator created from scratch. One of t
Advanced Supply Demand
Bernhard Schweigert
4.91 (294)
Derzeit 33% Rabatt! Die beste Lösung für jeden Anfänger oder erfahrenen Händler! Dieser Indikator ist ein einzigartiges, qualitativ hochwertiges und erschwingliches Trading-Tool, da wir eine Reihe von proprietären Funktionen und eine neue Formel integriert haben. Mit diesem Update werden Sie in der Lage sein, doppelte Zeitrahmenzonen anzuzeigen. Sie können nicht nur einen höheren TF (Zeitrahmen) anzeigen, sondern sowohl den Chart-TF als auch den höheren TF: SHOWING NESTED ZONES. Alle Supply Dema
Das RSI / TDI-Warnungs-Dashboard ermöglicht es Ihnen, RSIs (von Ihnen wählbar) für jedes wichtige Paar, das Sie handeln, sofort zu überwachen. Sie können es auf zwei Arten verwenden: 1. Wählen Sie mehrere Zeitrahmen aus und der Strich zeigt Ihnen, wenn es mehrere Zeitrahmen gibt, die über die normalen Handelsbedingungen hinausgehen. Ein großartiger Indikator dafür, dass der Preis in letzter Zeit stark nach oben gedrückt hat, da er über mehrere Zeiträume hinweg ein überkauftes oder überver
Ultimate Dynamic Levels
Hispraise Chinedum Abraham
4.7 (10)
Derzeit auf Urlaub Rabatt bei $ 399! Die Preise können in Zukunft steigen. Lesen Sie die Beschreibung unten!  Einführung von Ultimate Dynamic Levels - der BESTE Einstiegsindikator für das Ultimate Sniper Dashboard! Extrem risikoarme, rechtzeitige Einstiege und hohe RR!! Finden Sie das Ultimate Sniper Dashboard HIER. Die wichtigste Fähigkeit sowohl für Anfänger als auch für Profis ist es, genau zu erkennen, wo und wann ein Markt am wahrscheinlichsten dreht, und wie man sicher einsteigt und mi
Weitere Produkte dieses Autors
Draw My Levels
Brian Derich
5 (1)
Get This: The Ultimate Power Tool for Traders—Draw My Levels! Believe me, folks, this is BIG. This isn’t just some regular, everyday tool—this is *the* essential tool for your trading arsenal. “Draw My Levels” is a simple, elegant, and powerful script that’ll take your trading game to a whole new level. You want precision? You want control? You want to see where the real action is happening on the chart? Then this script is for you. Why Do You Need This Script? Let me tell you, if you’re a trade
FREE
If you like this product, please leave a 5 start review! Monitors symbols and shows you which one are the most active for the 3 different time frames you select. Shows volume and spread as well. Good for scalpers or short term traders. Forex is 24 hours, so knowing which pair is active is key to entering with good spreads and catching moves in an active market. This utility attached to a chart and shows you which pair is active, the list is auto sorted, active pairs move to the top of the list
FREE
What does this do? It shows you on the chart which stop belongs to which entry.  Have you ever had multiple positions or trades open on a single pair and were confused which stop loss goes with what entry? Even worse, the stop loss orders for buy and sells are the same color on the chart. Well, your problem has been solved! This indicator will show you which stop belongs to which entry.  It will place a vertical line and an arrow on the chart for each open trade. A yellow line connects the entry
SALE - On sale for 2 weeks! After that the price goes back to $169 Introducing Tipster Trendlines 2: The Future of Manual Trading is Here! Are you ready to elevate your trading game? Tipster Trendlines 2 isn’t just another tool; it’s your ultimate trading companion —designed to empower you, save time, and help you trade smarter. For 9 years, this tool has been a game-changer for traders who value control, precision, and results. Now it’s your turn to experience its magic. What Makes Tipster Tr
Auswahl:
Demian1982
140
Demian1982 2024.04.01 13:23 
 

Has some inadequacies. Sometimes anchorpoints shifts anwantedly by a few candles, and the major AVWAP a lot more significantly. So, especially if you changed the chart or timeframe, you have to check the anchorpoints constantly. On the other hand I cannot find any AWVAP-indicator for mt4, where you can plot several AVWAPS that uncomplicate, maintaining the anchor points (at least approximately) when switching timeframe. So 4 stars. CORRECTION: There are seemingly arbitrary situations this indicator doesn't work anymore below the H4 timeframe. For nearly 40Bucks, thats a bit lame.

Brian Derich
1228
Antwort vom Entwickler Brian Derich 2024.11.12 20:48
Thank you for your feedback! This AVWAP indicator is designed for serious traders who know their tools, and it’s been a fantastic resource for many who appreciate the precision and adaptability it brings to their trading strategies. We’ve tested this indicator thoroughly, and it works perfectly across multiple timeframes and market conditions. Pro traders love it—it’s consistently reliable and performs as intended, keeping those anchor points steady. Now, if you’re seeing any shifts, especially below the H4 timeframe, this could be due to how AVWAP recalculates dynamically with each tick, adapting the anchor points to keep the data relevant across timeframes. For optimal performance, double-check your anchor points after changing timeframes to keep everything aligned. This feature gives the indicator the flexibility that many traders rely on, but it does require familiarity with multi-timeframe strategies. That said, we understand that MT4 and its MQL4 programming language present their own unique challenges. Unlike more advanced platforms like MT5, MT4 has certain limitations in its architecture that restrict multi-timeframe analysis and real-time data synchronization. Despite these platform constraints, this indicator is crafted to deliver reliable, accurate results, and for $40, it’s offering value that’s hard to beat on MT4. If the platform’s limitations are affecting your experience, exploring MT5 or similar platforms with enhanced features might be worth considering. We’ve invested a lot into making this AVWAP indicator the best it can be within MT4’s ecosystem, and we appreciate your feedback as it helps us refine our tools even further. Thanks again for reaching out; we’re here to help you maximize the benefits of this powerful indicator, which has helped many traders take their strategies to the next level.
Yalda Soft
114
Yalda Soft 2023.10.17 04:25 
 

A great indicator to use for my strategy. I would love shortcuts for adding 'weekly', 'monthly', 'yearly', and 'quarterly' as I usually also add these as well.

Brian Derich
1228
Antwort vom Entwickler Brian Derich 2024.11.12 20:45
Thank you for your comment
Irmantas Uikis
350
Irmantas Uikis 2023.05.02 16:39 
 

Great indicator. Works fine. I really like 9th blue line, which draw average in all your charts.

Brian Derich
1228
Antwort vom Entwickler Brian Derich 2023.05.08 14:35
Thank you for your review!
Francis K N Ho
517
Francis K N Ho 2022.12.07 03:44 
 

"When you switch timeframes the chart will be clear of previously drawn AVWAP lines." Can we have an option to leave the AVWAP lines alone when we switch time frames? Having to redraw lines whenever I switch to check other timeframes is annoying and tedious.

And thank you for this fantastic tool. Full 5 stars if you can add this.

Brian Derich
1228
Antwort vom Entwickler Brian Derich 2023.05.08 14:37
Thank you for the comment, appreciate that. New version has been made available. Includes a Global AVWAP now. See notes in the update section and the description page.
Thank you for your review!
Asavage20
76
Asavage20 2022.10.24 09:20 
 

This is the pefect pullback tool.

Brian Derich
1228
Antwort vom Entwickler Brian Derich 2023.05.08 14:36
Thank you for using Multi AVWAP and for your review!
onbrand
217
onbrand 2022.09.11 09:32 
 

Is possible to update the indicator with an option that it doesnt refresh at new bars ? It would be nice it stay fixed on the chart even when chart update

Brian Derich
1228
Antwort vom Entwickler Brian Derich 2023.05.08 14:36
Thank you for your comment.
The indicator has been updated. Thank you for using Multi AVWAP and thank you for your review!
Antwort auf eine Rezension
Version 1.4 2022.12.17
Improvements
When the timeframe is changed the lines stay on the chart.
Line 9 shows up on all charts. Press 0 then click chart to remove.
See description page for full instructions.
Version 1.3 2022.10.24
Removed print to expert's tab text that is not required to use this indicator
Version 1.2 2022.10.24
AVWAP lines stay at the anchor point as new bars are formed, and the line updates with the new price and volume information.
Version 1.1 2022.06.23
Updated the colors.
All ODD numbers (1,3,5,7,9) are in the GREEN color family.
All EVEN numbers (2,4,6,8) are in the RED color family.
This should make it easier to assign VWAP to pivot highs and pivot lows, more visually meaningful.

Fixed a bug, the lines did not update as time progressed and new bars created. The Anchored VWAPs now redraw as the new bars are created on the chart.