Multi Anchored VWAP
- Indicatori
- Brian Derich
- Versione: 1.4
- Aggiornato: 17 dicembre 2022
- Attivazioni: 10
Anchored Volume Weighted Average Price (AVWAP, or Anchored VWAP). Tells you who is in control, the buyers or the sellers. Better than all other moving averages because it adds weight to the traded volume. This technique was made popular by Brian Shannon of Alphatrends. It is calculated by multiplying typical price by volume, and the dividing by total volume.
It is very simple to use.
1. Press a number from 1 to 9 on the keyboard, then click the chart where you want to anchor the VWAP.
3. Hold Ctrl and click the chart to erase lines 1 to 8.
4. Line 9 shows up on all charts, use this to anchor from a major event. It is a Global AVWAP.
5. Press 0 then click chart to erase line 9."
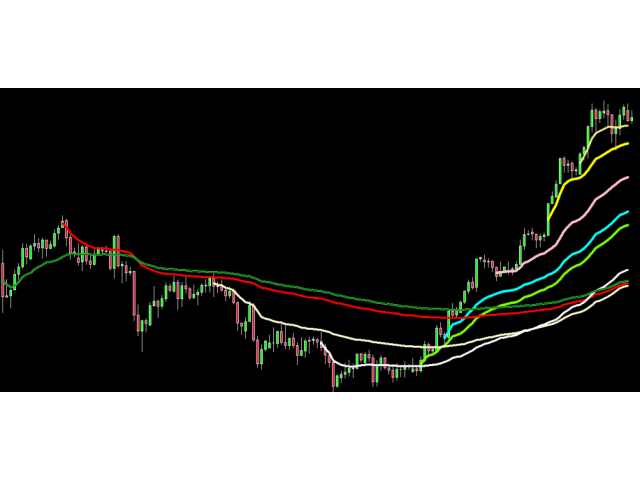
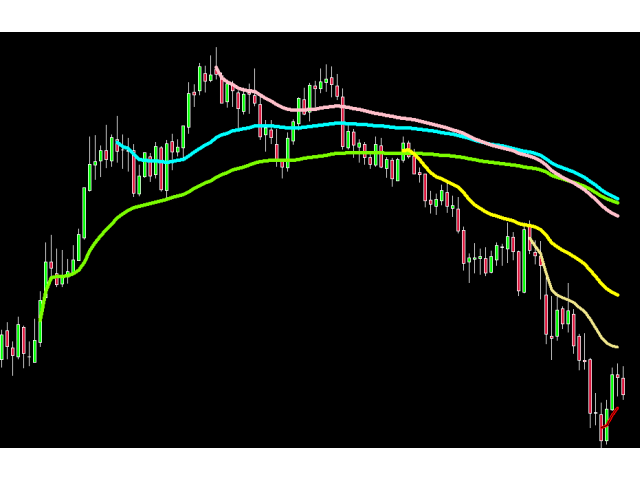
Each number will produce a different coloured line.
When the timeframe is changed the lines stay on the chart.
COLORS
All ODD numbers (1,3,5,7,9) are in the GREEN color family.
All EVEN numbers (2,4,6,8) are in the RED color family.
This makes it easy to assign VWAP to pivot highs and pivot lows, more visually meaningful.
The anchored VWAP lines update as new bars are created on the chart.
if you have any problems using the indicator or have any other questions, do not hesitate to contact us.
About: I run a small team of professional traders with experience in software development. We have been on the market for over 21 years and specialize in the development of MetaTrader 4 software
VWAP vs AVWAP
AVWAP is Anchored Volume Weighted Average Price
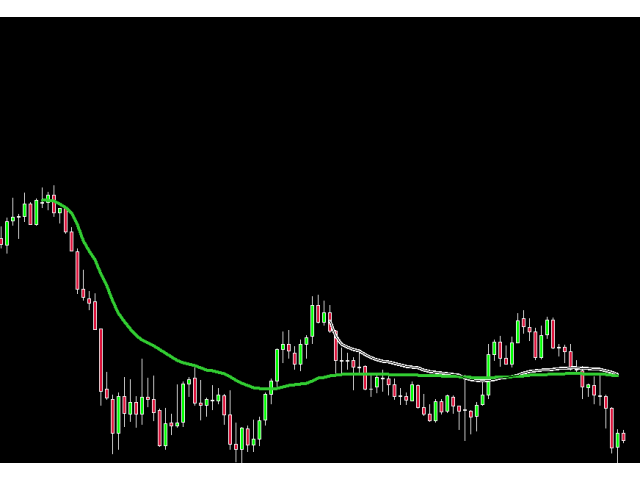
A traditional VWAP incorporates price and volume in a weighted average and is an ongoing calculation, similar to a moving average, it starts off the chart on the left side and continues to to the right side. The AVWAP starts where you anchor it on any visible bar and continues to the right side of the chart. Both can be used to identify areas of support and resistance on the chart.
Introduction to AVWAP
The AVWAP is a combination of price, volume, and time that makes it special. Traders can objectively determine the emergent sentiment from that moment forward.
The AVWAP can be used on any timeframe and is actually best used on multiple timeframes and because of its moving property, the AVWAP can be analyzed in ways like a traditional moving average. Some considerations when using this indicator; direction and slope of the AVWAP, how far above or below price action is in relation to the AVWAP, etc.
Important Events
The first anchor that most people should use is the previous highs and lows in whatever timeframe they are looking at. Consider the high of the week, or the high of the day. Traders can use the previous swing high or low and anchor from there. An anchor from the previous low would give us the average price that traders paid on the run up. Anytime price tries to go below it, it should act as a support since every who bought during the rally does not want to lose money and will step in to defend their position.
Year to date, month to date, and week to date are some of the most important AVWAPs. These act as strong support and resistance levels. When a new year, month, or week starts, many people start new positions on both long and short side. The YTD, MTD, and WTD AVWAPs show the average price they paid for their positions, and they defend these AVWAPs.








A great indicator to use for my strategy. I would love shortcuts for adding 'weekly', 'monthly', 'yearly', and 'quarterly' as I usually also add these as well.